 Open Access Article
Creative Commons Attribution 3.0 Unported Licence
Silica template-assisted synthesis of SnO2@porous carbon composites as anode materials with excellent rate capability and cycling stability for lithium-ion batteries†
Jian Guo,
Ping Li,
Liying Chai,
Yi Su,
Jinxiang Diao and
Xiaohui Guo *
*
Key Lab of Synthetic and Natural Functional Molecule Chemistry of Ministry of Education, The College of Chemistry and Materials Science, College of Chemistry and Materials Science, Northwest University, Xi’an 710069, China. E-mail: guoxh2009@nwu.edu.cn; Tel: +86-2981535025
First published on 9th June 2017
Abstract
In this study, a type of porous carbon-coated SnO2 nanoparticle composite (SnO2@PC) was produced in the presence of a silica template. The prepared SnO2@PC composite displays a highly specific surface area (SSA) and large pore volume compared with common porous carbons. Electrochemical testing demonstrates that as an anode material the SnO2@PC1 composite can deliver a specific capacity of 1130.1 m Ah g−1 at a current density of 0.2 A g−1 after 100 cycles, which is much higher than that of pure SnO2 anodes. The specific capacity of the SnO2@PC1 anode is as high as 770.3 m Ah g−1 at a current density of 0.5 A g−1 after 300 cycles, indicating excellent rate and cycling capability. The superior lithium storage performance of the SnO2@PC1 composite can be attributed to the synergistic effect of the porous carbon and SnO2 nanoparticles. In addition, the large specific surface area and pore volume of the SnO2@PC1 composite can significantly shorten the diffusion path of lithium ions and provide a sufficient internal void space for volume change. The proposed synthetic approach is facile, controllable, and economical, and can be applied in producing carbon coatings for other transition metal oxide-based composite functional materials.
1. Introduction
Lithium-ion batteries (LIBs) have attracted a great deal of attention as popular energy storage devices due to their excellent electrochemical performance, such as having a long cycle lifetime and high energy density.1–3 Anode materials in LIBs play a key role in modulating the lithium storage performance. Graphite, as the traditional LIB anode material, cannot meet our daily demands owing to its low theoretical specific capacity of only 372 m Ah g−1.4,5 The development of electronic devices has presented higher energy storage requirements for LIBs. Hence, the exploitation of advanced anode materials with excellent lithium storage capabilities has become very urgent.Currently, SnO2 is considered as one of the most promising anode materials for next-generation LIBs due to several unique characteristics including a high theoretical capacity (ca.790 m Ah g−1), environmental friendliness, natural abundance, and a low cost. However, the sizable volume expansion/contraction associated with lithium insertion/extraction causes the destruction and collapse of the SnO2 anode structure, which further causes severe capacity fading and poor cycling stability.6–8 These disadvantages have severely restricted the practical application of SnO2 in LIBs.
To our knowledge, many research groups have attempted to develop high-performance SnO2-based anode materials with high cyclic stability for next-generation LIBs. Compared to bulk SnO2 materials, nanostructured SnO2 materials have been proven to be effective in buffering the volume change of SnO2 anodes and shortening the diffusion path of lithium ions.9,10 SnO2 structures such as ultrafine SnO2 nanoparticles,11 SnO2 quantum dots,12 hollow SnO2 spheres,13,14 porous SnO2,15 SnO2 nanorods,16 SnO2 nanotubes,17–19 SnO2 nanosheets20 and SnO2 nanoribbons21 have been successfully produced via various synthetic approaches in recent studies. However, further improvements in the electrochemical performance of these nanostructured SnO2 anodes are limited owing to their poor electrical conductivity.
Various conductive components such as MoS2,22 conductive polymers,23–25 and conductive carbon materials (including graphene,26–28 carbon nanotubes,29,30 carbon nanofibers,31–34 and 3D carbon frameworks35–37) have been introduced into SnO2 materials to enhance their electrical conductivity and accelerate ion transfer. These conductive matrices can effectively accommodate the internal stress caused by the SnO2 volume change during the charge/discharge process, which can prevent the aggregation of SnO2 nanoparticles27 and hence improve the cyclic stability of the SnO2 materials. Although improved cyclic durability has been realized for these SnO2-based composite anodes, the issue of fast capacity decay at high rates still limits the scalable application of SnO2-based composite anodes in LIBs.
Among these conductive materials, porous carbon materials have attracted extensive interest due to their high specific surface area, low density, large pore volume, and high mass loading, so they would be an ideal support for SnO2 nanoparticles with regard to their electrochemical performance in LIBs. The lithium storage properties of carbon-coated SnO2 (SnO2@PC) composites can be significantly improved by integrating a porous carbon coating layer wherein large amounts of active sites for lithium storage are supplied by the large specific surface area (SSA), which can increase the contact area with the electrolyte. The hollow internal structure provides extra void space to accommodate the structural strain and volume expansion, which can assure the integrity of the electrode structures.35 The pulverization and agglomeration of the SnO2 nanoparticles is also prevented by adding a porous carbon coating layer,36 additionally, alloying and dealloying during the charge/discharge processes is effectively modulated via a desirable porous channel that favors the reversibility of the electrochemical reaction. These excellent porous features would ensure the realization of high capacity retention at high rates or long-term cycling.
Recently, various SnO2@porous carbon-based anode architectures have been developed to provide enhanced electrochemical performance in LIBs. For example, Zhou et al. prepared SnO2 quantum dots encapsulated by a three-dimensional porous carbon network (NSGC@SnO2) based anode material, which can deliver a specific capacity of 1118 m Ah g−1 at a current density of 0.2 A g−1 after 100 cycles.38 Chen et al. synthesized ultrafine SnO2 nanoparticles embedded in carbon networks as an anode material that can exhibit a discharge specific capacity of 597.3 m Ah g−1 at a current density of 0.1 A g−1 after 220 cycles.39 Jin et al. reported that SnO2 nanoparticles@CMK-3 composite-based anodes can deliver a discharge specific capacity of 1054 m Ah g−1 at a current density of 0.1 A g−1.40 Although the electrochemical performance of the above mentioned SnO2@porous carbon-based anodes has been improved in LIBs, their absolute electrochemical capacity remains unsatisfactory and still suffers capacity decay during the initial ten or twenty cycles. In other words, the fabrication of SnO2@porous carbon composite electrode materials with simultaneous high rate capability and stable cycling performance remains elusive. Moreover, the synthetic processes involved in obtaining such composites are relatively complex, thus limiting their large-scale applications in LIBs. As a result, there is sizable demand for producing high-performance SnO2@porous carbon composite anodes via a facile and economical synthetic approach.
In this work, we synthesized a type of porous carbon-coated SnO2 (SnO2@PC) based composite with the assistance of a silica template under mild conditions. The PC was generated by a facile sol–gel route followed by a calcination treatment process. The prepared SnO2@PC1 composite displayed a high specific surface area of 246.2 m2 g−1 and a large pore volume of 0.505 cm3 g−1. Due to the synergic effect of the SnO2 nanoparticles and the porous carbon network, as an advanced anode material the prepared SnO2@PC1 composite delivers an initial specific capacity of 1803 m Ah g−1, remarkable cycling stability and outstanding rate capability. More importantly, the unique porous carbon-coated metal oxide-based composite structure could possess potential applications in chemical, adsorption, catalytic, and biological engineering fields.
2. Experimental section
Analytical grade tin(IV) chloride pentahydrate (SnCl4·5H2O), sodium hydroxide (NaOH), concentrated hydrochloric acid (HCl, 37 wt%), glucose and sodium silicate (Na2SiO3·9H2O) were used without any further purification.2.1 Synthesis of SnO2@PC
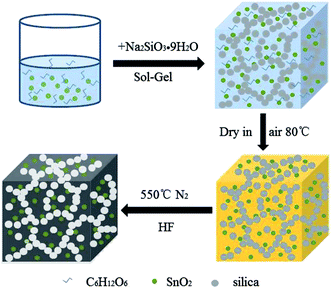
First, the SnO2 nanoparticles were produced according to a previously reported synthetic method.41 Then, SnO2@PC1 was synthesized by the following procedures. 0.5 g of SnO2 NPs was dispersed in 25 mL of water by ultrasonic treatment for 2 h, and then 1 mL of concentrated hydrochloric acid, 0.4 g of glucose and 2.4 g of sodium silicate were added into the above suspension under vigorous stirring. A gel-like product was formed several minutes later and subsequently dried in air at 80 °C in an oven overnight. The resulting product was ground into a powder and transferred to a corundum crucible. The corundum crucible was put into a tubular furnace under a N2 atmosphere and heated to 550 °C with a ramp rate of 5 °C min−1. After it cooled to room temperature, the resulting powder was etched in a hydrofluoric acid solution, followed by washing with water and ethanol several times. Finally, the product was obtained via drying treatment in an oven at 80 °C for 5 h. For comparison, SnO2@PC2 (0.3 g glucose), SnO2@PC3 (0.5 g glucose), and SnO2@PC4 (0.1 g glucose) samples were synthesized by a similar synthetic procedure, only changing the weight of glucose. In addition, SnO2@C was synthesized by a similar procedure without the addition of hydrochloric acid and sodium silicate.2.2 Characterization
The morphology and crystal structures of all the samples were characterized by a field-emission scanning electron microscope (FE-SEM, Hitachi, S-4800), a high-resolution transmission electron microscope (HRTEM, FEI Tecnai G2 F20) and a Bruker D8 advance X-ray powder diffractometer. The surface electron state of SnO2@PC1 was identified by an X-ray photoelectron spectroscope (XPS, Model VG ESCALAB). The specific porous structures of all the samples were determined by a Brunauer–Emmett–Teller (BET) surface analyzer (Tri Star-3020, Micromeritics, USA). Component identification of the samples was performed via a Raman spectrometer (Jobin Yvon Co., France) model HR800 employing a 10 mW helium/neon laser at 632.8 nm. The carbon content in the samples was measured via thermogravimetric analysis (TGA, Netzsch-Sta 449) in an air atmosphere, over a temperature range of 25–1000 °C with a heating rate of 10 °C min−1.2.3 Electrochemical performance evaluation
CR2032 coin-type cells were used to test the electrochemical performance of all the samples. The working electrode was prepared by mixing the synthesized materials, acetylene black and sodium alginate at a weight ratio of 7![[thin space (1/6-em)]](https://www.rsc.org/images/entities/char_2009.gif) :
:![[thin space (1/6-em)]](https://www.rsc.org/images/entities/char_2009.gif) 1.5
1.5![[thin space (1/6-em)]](https://www.rsc.org/images/entities/char_2009.gif) :
:![[thin space (1/6-em)]](https://www.rsc.org/images/entities/char_2009.gif) 1.5 in a water solvent. The obtained slurry was cast on Cu foil and dried under vacuum at 80 °C for 8 h. The electrode was cut into circular disks of 12 mm with an average mass loading of 0.8 mg cm−2. The LIBs were assembled in an argon-filled glove box. 1 M LiPF6 in ethylene carbonate (EC) and diethyl carbonate (DEC) (1
1.5 in a water solvent. The obtained slurry was cast on Cu foil and dried under vacuum at 80 °C for 8 h. The electrode was cut into circular disks of 12 mm with an average mass loading of 0.8 mg cm−2. The LIBs were assembled in an argon-filled glove box. 1 M LiPF6 in ethylene carbonate (EC) and diethyl carbonate (DEC) (1![[thin space (1/6-em)]](https://www.rsc.org/images/entities/char_2009.gif) :
:![[thin space (1/6-em)]](https://www.rsc.org/images/entities/char_2009.gif) 1, v/v) was used as the electrolyte, Celgard 2400 microporous polypropylene membrane as the separator and Li foil as the counter electrode. The electrochemical properties of the assembled cells were measured by a LAND-CT2001A battery test system within a voltage range of 0.005 to 3 V. Cyclic voltammetry (CV) was carried out by a CHI660e electrochemical workstation at a scan rate of 0.2 mV s−1 within a voltage window of 0.005 to 3 V (vs. Li/Li+).
1, v/v) was used as the electrolyte, Celgard 2400 microporous polypropylene membrane as the separator and Li foil as the counter electrode. The electrochemical properties of the assembled cells were measured by a LAND-CT2001A battery test system within a voltage range of 0.005 to 3 V. Cyclic voltammetry (CV) was carried out by a CHI660e electrochemical workstation at a scan rate of 0.2 mV s−1 within a voltage window of 0.005 to 3 V (vs. Li/Li+).
3. Results and discussion
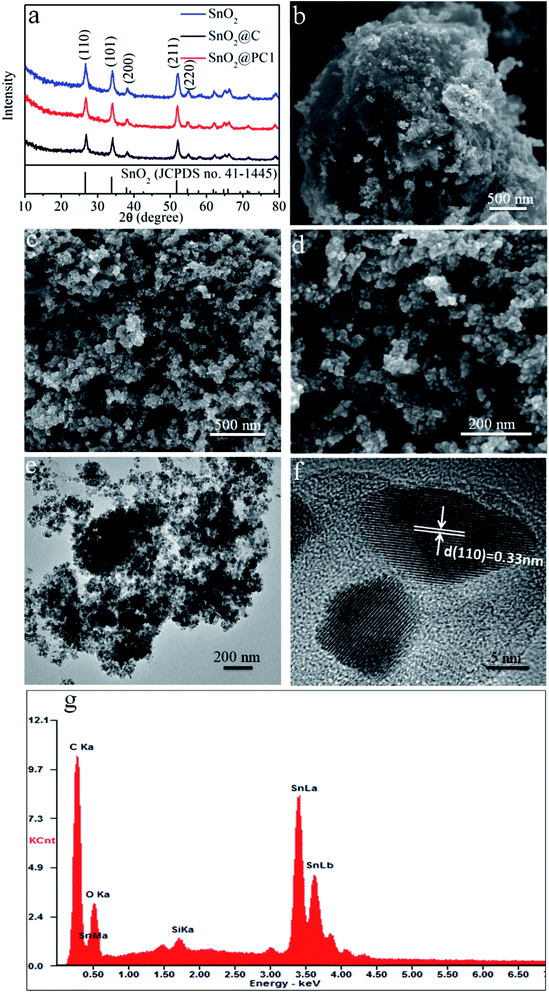
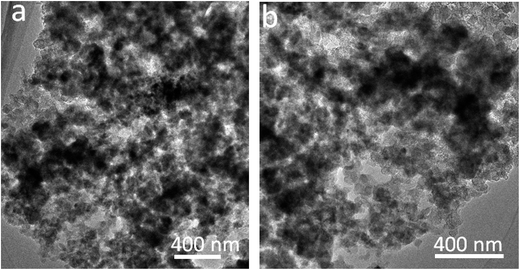
The SnO2@PC fabrication procedure is illustrated schematically in Fig. 1. The three SnO2-based samples were obtained via a facile synthetic approach, as described above. The structural features of the SnO2 nanoparticles, SnO2@C, and SnO2@PC1 were characterized by XRD. As shown in Fig. 2a, the diffraction peaks of the three samples correspond to those of rutile SnO2 (JCPDS card no. 41-1445), while the main diffraction peaks at 26.6°, 33.8°, 37.9°, 51.8°, and 54.8° are ascribed to (110), (101), (200), (211), and (220) facets, respectively, indicating the good crystalline nature of the SnO2 component. The broad peak at 20–25° can be ascribed to the amorphous carbon.40 In contrast to the XRD patterns of pure SnO2, no other impurity peaks were detected in the XRD patterns of SnO2@PC1 or SnO2@C. By comparison, SnO2@PC2, SnO2@PC3, and SnO2@PC4 samples were produced by modulating the glucose content in the same reaction system. These samples displayed similar structure and morphology features to SnO2@PC1 (Fig. S1†).The morphologies of SnO2@PC1 and SnO2@C were observed via FESEM, and it was found that the SnO2@C displays a large aggregate structure, which is approximately several microns in size (Fig. 2b). The SnO2@PC1 presents a porous, network-like structure with many interconnected pores. The SnO2 nanoparticles are uniformly coated with a carbon layer, exhibiting a marked difference compared with the SnO2@C (Fig. 2c–d). TEM was performed to further observe the microstructure of the SnO2@PC1 (Fig. 2e–f). The SnO2 nanoparticles were uniformly anchored on a porous carbon framework and had a mean size of about 10–20 nm, as shown in Fig. 2f. The SnO2 nanoparticles displayed well-defined crystal lattice stripes, and the spacing was measured to be 0.33 nm, corresponding to the (110) plane. The components of the SnO2@PC1 sample were also confirmed via EDS analysis, as shown in Fig. 2g. The sole presence of C, O, and Sn in the sample indicates the successful formation of a carbon-coated SnO2-based composite.
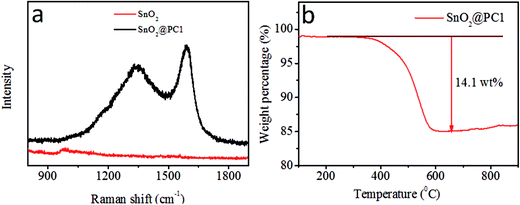
In order to confirm the presence of a carbon component in the sample, Raman spectroscopy was performed at room temperature, as shown in Fig. 3a. The SnO2@PC1 displays two broad peaks at about 1350 and 1591 cm−1, assigned to the D band and G band, respectively, which are characteristic of carbon species.42 The peak intensity ratio between the D band and G band (ID/IG ∼0.837), indicates high defect concentrations in the porous carbon. In addition, the carbon content of the four SnO2@PC-based samples was quantified via TGA testing, and the corresponding carbon content in SnO2@PC1, SnO2@PC2, SnO2@PC3, and SnO2@PC4 was calculated to be 14.1, 9.3, 15.7, and 2.6 wt%, respectively, as shown in Fig. 3b and S2.†
Isothermal N2 adsorption–desorption analysis was employed to investigate the porous features of SnO2@PC1 and SnO2@C. The N2 adsorption–desorption isotherms acquired at 77 K and the Barrett–Joyner–Halenda (BJH) adsorption pore size distribution plots of the samples are shown in Fig. 4. The nitrogen adsorption isotherms of the samples are typical type IV curves and the loop nature of the nitrogen adsorption isotherms suggests the presence of the mesoporous structure of the samples. According to the corresponding Barrett–Joyner–Halenda (BJH) calculation, the SSA and pore volume of the as-prepared SnO2@PC1 were measured as 246.2 m2 g−1 and 0.505 cm3 g−1, respectively, and the pore size was focused at 11.8 nm. For comparison, the SSA, pore volume and pore size of SnO2@C were calculated as 83.25 m2 g−1, 0048 cm3 g−1 and 3.9 nm, respectively. Additionally, we also examined the porous features of the SnO2@PC2, SnO2@PC3, and SnO2@PC4 samples. The obtained N2 adsorption–desorption isotherms and the pore-size-distribution curves of the three SnO2@PC-based samples are shown in Fig. S3.† As a result, it is believed that the larger specific surface area and pore volume of SnO2@PC were generated by removal of the silica template.
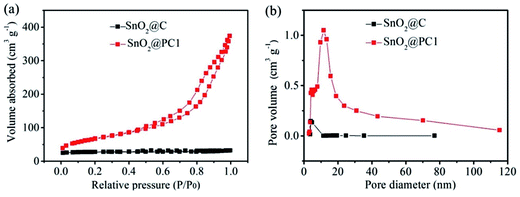 | ||
| Fig. 4 (a) Nitrogen adsorption–desorption isotherms and (b) pore size distribution plots of SnO2@C and SnO2@PC1. | ||
To further investigate the state of the elements within the SnO2@PC1, XPS analysis was implemented and the corresponding results are presented in Fig. 5. The survey XPS spectrum of SnO2@PC1 (Fig. 5a) indicates the presence of Sn, O, and C species in the sample. As shown in Fig. 5b, it was seen that three major peaks at binding energies of 285 eV, 286 eV and 287.32 eV are ascribed to the C–C, C–O and C![[double bond, length as m-dash]](https://www.rsc.org/images/entities/char_e001.gif) O bonds, respectively.40 The XPS spectra of the O 1s species split into three distinct peaks centred at binding energies of 531.6, 532.7, and 533.5 eV, corresponding to Sn–O, C
O bonds, respectively.40 The XPS spectra of the O 1s species split into three distinct peaks centred at binding energies of 531.6, 532.7, and 533.5 eV, corresponding to Sn–O, C![[double bond, length as m-dash]](https://www.rsc.org/images/entities/char_e001.gif) O, and C–O bonds, respectively, indicating the presence of O2− (Fig. 5c). Two peaks at binding energies of 487.6 eV (Sn 3d5/2) and 496 eV (Sn 3d3/2) can be clearly seen from the high-resolution Sn 3d XPS spectra, as illustrated in Fig. 5d, which confirms the presence of Sn4+ in the sample. These XPS results confirm the presence of SnO2@PC1.
O, and C–O bonds, respectively, indicating the presence of O2− (Fig. 5c). Two peaks at binding energies of 487.6 eV (Sn 3d5/2) and 496 eV (Sn 3d3/2) can be clearly seen from the high-resolution Sn 3d XPS spectra, as illustrated in Fig. 5d, which confirms the presence of Sn4+ in the sample. These XPS results confirm the presence of SnO2@PC1.
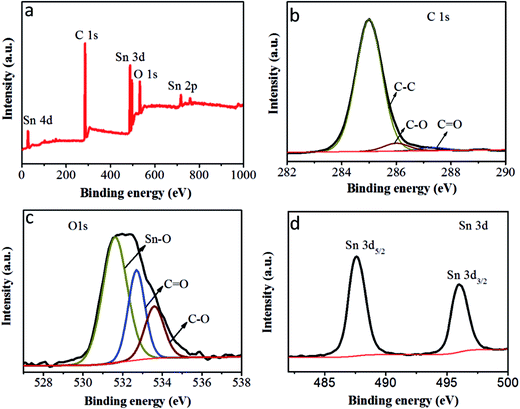 | ||
| Fig. 5 (a) The XPS survey scan of SnO2@PC1, (b) the XPS spectra of C 1s peaks of SnO2@PC1, (c) the XPS spectra of O 1s peaks of SnO2@PC1 and (d) the XPS spectra of Sn 3d peaks of SnO2@PC1. | ||
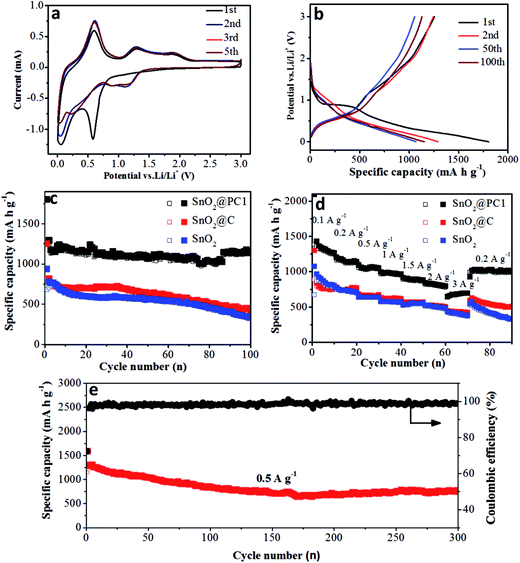
The electrochemical performance of the bare SnO2, SnO2@PC, and SnO2@C anodes was investigated. The reaction mechanism of the SnO2@PC1 electrode for the initial several cycles was measured via cyclic voltammetry in the voltage range of 0.005–3.0 V (vs. Li/Li+) at a scan rate of 0.2 mV s−1, as shown in Fig. 6a. In the first cycle, two cathodic peaks were observed at 0.58 V and 0.06 V. The peak at 0.58 V disappeared in subsequent cycles, corresponding to the formation of an SEI layer, the conversion of SnO2 into Sn and the formation of amorphous Li2O, while the peak at 0.06 V is attributed to the formation of LixSn. The peaks at 0.4–1 V in the anodic curves are a result of dealloying of LixSn, and the anodic peaks at 1.28 and 1.86 V are attributed to the partial oxidation of Sn into SnOx. Two cathodic peaks can be observed at 0.88 and 1.18 V after the first cycle that correspond to the reduction of SnOx into Sn, indicating the partial reversibility in eqn (1) that is responsible for the excess capacity. The reduction peak potential is shifted from 0.58 to 1.18 V, suggesting the partial reduction of SnOx into Sn after the first cycle, which can be confirmed in Fig. S4.† All curves can be overlapped after the first cycle, which indicates the superior reversibility and cycling durability of the SnO2@PC1 electrode.18,38 The whole reaction process is represented by the following equations:
| SnO2 + 4Li+ + 4e− ↔ Sn + 2Li2O | (1) |
| Sn + xLi+ + xe− ↔ LixSn (0 ≤ x ≤ 4.4) | (2) |
Fig. 6b shows the discharge–charge curves of the SnO2@PC1 electrode for different cycles at a current density of 0.2 A g−1 in the voltage range of 0.005–3.0 V (vs. Li/Li+). The first discharge curve of the SnO2@PC1 electrode exhibited a voltage platform at 0.8 to 1 V that was apparently different from the rest curves, which can probably be ascribed to the formation of an SEI layer and the conversion of SnO2 into Sn. The charge–discharge specific capacities of the SnO2@PC1 electrode in the initial cycles were 1255 m Ah g−1 and 1803.5 m Ah g−1, respectively. The capacity loss during the first cycle results from the formation of the SEI layer, which is a common phenomenon for most anode materials. The initial capacity is much higher than the theoretical capacity of pure SnO2 owing to the good reversibility in eqn (1). In addition, the decomposition of the electrolyte in the low-potential region and the simple adsorption of Li+ on the surface of the supporting carbon matrix are also responsible for the enhanced capacity.43 The discharge–charge curves exhibit little change from the 2nd to the 100th cycle, and then the coulombic efficiency can reach 99%, indicating the excellent reversibility and cycling stability of the SnO2@PC1 electrode.
Meanwhile, at the same charge–discharge testing conditions, the initial discharge capacity of the bare SnO2 anode was 939 m Ah g−1, thus the coulombic efficiency for the first cycle was 62.5%. In the second cycle, it delivered a discharge capacity of 780 m Ah g−1 with a coulombic efficiency of 90.7% (Fig. S5b†), which is in accord with the CV result in Fig. S5a.† Meanwhile, the SnO2@C electrode exhibited a similar discharge–charge feature with the bare SnO2 nanoparticles, as shown in Fig. S6.† These results indicate that the bare SnO2 NPs and SnO2@C undergo a large capacity loss during the initial discharge–charge cycles, which can probably be ascribed to the formation of unstable SEI film and the irreversibility of the reaction described by eqn (1).
To further study the cycling durability of the three anodes, they were cycled at a voltage window of 0.005 to 3 V under a current density of 0.2 A g−1 (results are shown in Fig. 6c). The bare SnO2 anode delivered a charge specific capacity of 321 m Ah g−1 after 100 cycles, with a capacity retention of 47.1%. It was noted that the pure carbon anode delivered a low charge specific capacity of 107.46 m Ah g−1 after 50 cycles (Fig. S7†). Moreover, the SnO2@C anode delivered a charge specific capacity of 414 m Ah g−1 after 100 cycles, with a capacity retention of 51.0%. The rapid capacity decay for the pure SnO2 and SnO2@C anodes after 100 cycles may have resulted from the electrode structure collapse and pulverization of the SnO2 active material. In contrast, the SnO2@PC1 electrode exhibited superior cycling stability compared with SnO2@C and bare SnO2. For the SnO2@PC1 electrode, the charge specific capacity of SnO2@PC1 after 100 cycles could reach 1130 m Ah g−1, with a capacity retention of 90.0%, which is much higher than that of bare SnO2 and SnO2@C. These results demonstrated that the novel porous carbon structures directed by the silica template can effectively enhance the structural stability and cycling performance, which can be evidenced in previous literature.44
Herein, the complete carbon enclosure and the large void space between the core and shell can physically restrict the SnO2 core and buffer its volume expansion, preventing it from pulverization and detaching from the current collector, which can favor a high specific capacity after long-time cycling. It should be noted that the discharge specific capacity of the SnO2@PC1 electrode can deliver 1130 m Ah g−1 at 0.2 A g−1 after 100 cycles, which is much higher than the theoretical capacity of SnO2 (∼790 m Ah g−1). The extra capacity may result from the reversible formation of an organic polymeric gel-like layer caused by electrolyte decomposition at low potential and the electro-catalytic reversible conversion of some components from SEI films.36,45 The partially reversible conversion between Sn and SnOx at the initial cycle process can also contribute additional capacity. In addition, previous work also suggested that a nanostructure with a porous structure may improve the number of Li+ storage sites and contribute extra capacity.46
The rate performance of the bare SnO2, SnO2@C, and SnO2@PC1 electrodes was investigated at current densities ranging from 0.1 to 3 A g−1. As shown in Fig. 6d, the specific capacities of the bare SnO2, SnO2@C, and SnO2@PC1 anodes at a current density of 0.1 A g−1 after 10 cycles were 781, 761, and 1247 m Ah g−1, respectively. As the current density was increased to 0.5 A g−1, the specific capacities of the bare SnO2, SnO2@C, and SnO2@PC1 anodes were 633, 671, and 1039 m Ah g−1, respectively. Further increasing the current density to 3 A g−1 gave specific capacities of the bare SnO2, SnO2@C, and SnO2@PC1 anodes of 366, 413, and 692 m Ah g−1 after 70 cycles, respectively. The SnO2@PC1 anode was found to retain a relatively high specific capacity of 698 m Ah g−1 at high rate testing conditions, which highlights its potential as an advanced anode material for next-generation LIBs. When the current density was returned back to 0.2 A g−1, the specific capacities of the bare SnO2, SnO2@C, and SnO2@PC1 were 321, 492, and 1002 m Ah g−1, respectively. The specific capacities of the SnO2@C and SnO2@PC1 anodes were close to their initial values, implying their excellent rate capability and cyclic reversibility. In addition, electrochemical impedance spectroscopy of the SnO2-based anodes was conducted, as shown in Fig. S8.† It was found that SnO2@PC1 displays low charge transfer resistance compared with pure SnO2, indicating the good electrical conductivity of SnO2@PC1. These results altogether demonstrate that porous carbon as a support for SnO2 plays a significant role in improving the electrochemical performance of the SnO2@PC anodes.
To better highlight the generality of the porous carbon structure, the rate capability of the SnO2@PC2, SnO2@PC3, and SnO2@PC4 anodes was tested, as shown in Fig. S9.† At the same rate testing conditions, when the current density was returned back to 0.2 A g−1, the specific capacities of SnO2@PC2, SnO2@PC3, and SnO2@PC4 remained at 921.8, 743.2 and 461.5 m Ah g−1, respectively, which is lower than that of SnO2@PC1. This case proved that a desirable carbon coating layer thickness is a key factor for improving the lithium storage performance of SnO2@PC-based anodes in LIBs, in which the relatively thin carbon shell layer could be destroyed by the repeated volume change, leading to the release of SnO2 active material from the carbon loading layer during the repeated charge–discharge processes. It can also be concluded that the lithium storage performance of SnO2@PCx (x = 2, 3, 4) is inferior compared with SnO2@PC1.
Next, in order to further investigate the structural integrity of the SnO2@PC anodes, the long term cycling performance of SnO2@PC1 at a current density of 0.5 A g−1 was examined. The charge specific capacity of SnO2@PC1 could reach up to 770.3 m Ah g−1 after 300 cycles, with a capacity retention of 67.0%. For comparison, the cycling performance of the other SnO2@PC-based anodes was tested, as shown in Fig. S10.† The specific capacities of the SnO2@PC2, SnO2@PC3, and SnO2@PC4 anodes after 200 cycles at 0.5 A g−1 were 573.6, 457.1, and 68.3 m Ah g−1, respectively, and their capacity retentions were calculated to be ∼51.3, 50.2, and 9.31%, respectively. These electrochemical data are much lower than that of SnO2@PC1 and so these results fully demonstrate that the prepared SnO2@PC1 anode displays optimal lithium storage capability compared with similar SnO2@PCx (x = 2, 3, 4) anodes. Moreover, the cycling and rate performance of the SnO2@PC1 anode in LIBs is superior to most previously reported results in literature, and a detailed performance comparison can be seen in Table 1. Herein, capacity fading occurs in the initial cycling process that may be owing to the partial destruction of the anode structure. The morphology and microstructural changes of the SnO2@PC1 before and after long cycles are shown in Fig. 7 and S11.† After the charge/discharge cycles, the SnO2@PC1 anode material displays a similar structure to the as-synthesized sample, and it was seen that after long cycles the SnO2@PC1 composite structure was not destroyed, but only partly aggregated compared to the fresh sample. The above results indicate that the SnO2@PC1 has a relatively robust structure.
| SnO2@carbon-based composite anodes | Current density (A g−1) | Initial charge capacity (m Ah g−1) | Final capacity/cycle number (m Ah g−1) | Capacity retention (%) | Reference |
|---|---|---|---|---|---|
| SnO2@C yolk–shell nanospheres | 0.1 | 1236 | 630 (100) | 51.0 | 47 |
| Carbon coated SnO2/graphene | 0.1 | 955 | 770 (70) | 80.6 | 48 |
| SnO2@C nanocomposites | 0.1 | 1208 | 900 (50) | 74.5 | 49 |
| SnO2@OMC | 0.05 | 943 | 646 (50) | 68.5 | 40 |
| SnO2 SMCs@C | 0.05 | 1220.3 | 870.9 (120) | 71.4 | 15 |
| SnO2@voids@C | 0.2 | 1246 | 986 (50) | 79.1 | 34 |
| SnO2 NPs@carbon networks | 0.1 | 945 | 597 (220) | 63.2 | 39 |
| SnO2 nanotube @C | 0.5 | 947 | 596 (200) | 62.9 | 50 |
| SnO2-NPs/EG | 0.1 | ∼1160 | 976 (100) | 84.1 | 45 |
| NSG/CNTs@SnO2 | 0.2 | 1296 | 1118 (100) | 86.3 | 51 |
| F–G/SnO2@C | 0.1 | 889 | 820 (100) | 92.2 | 52 |
| SnO2@PC1 | 0.2 | 1255 | 1130 (100) | 90.0 | This work |
| 0.5 | 1150 | 770 (300) | 67.0 |
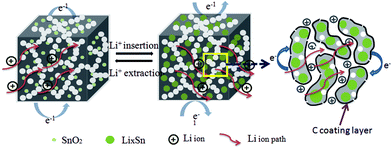
The electrochemical reaction process of Li+ insertion/extraction of the SnO2@PC electrode is illustrated in Fig. 8. The superior cycling and rate performance of the SnO2@PC1 electrode is due to the rational design of the novel carbon coating structure. In this work, the porous carbon plays an important role in enhancing the electrochemical performance. The porous carbon of SnO2@PC offers pathways for fast electron/ion transportation, preventing the pulverization and aggregation of SnO2 nanoparticles and promoting the formation of a stable SEI film, the high SSA of SnO2@PC provides many more active sites for lithium storage to facilitate the transportation of ions and electrons, and the larger pore volume provides extra void space to buffer volume expansion/contraction during the cycling process. The above results and analysis fully demonstrate that effective combination of the high theoretical capacity of SnO2 and the unique porous carbon coating structure can synergistically enhance the lithium storage performance, especially the cycling and rate capability of the SnO2@PC anode in LIBs.
4. Conclusion
In summary, this work demonstrated that a type of novel porous carbon-coated SnO2-based composite could be successfully produced in the presence of a silica template. The prepared SnO2@PC composite possesses a large specific surface area and a high pore volume, which can significantly shorten the diffusion path of lithium ions and provide a sufficient internal void space for the volume change of SnO2. Benefiting from unique structural features, the prepared SnO2@PC composite anodes exhibit high specific capacity, excellent cycling durability and remarkable rate capability in LIBs. In addition, the synthetic strategy proposed here can be extended to produce similarly structured electrode materials for high-performance LIBs.Acknowledgements
We acknowledge funding support from the Program for New Century Excellent Talents in University (NCET-13-0953), Projects from the Science and Technology Committee of Shaanxi Province (Grant No. 2014KW09-03, 2011KGXX47), and the fund of the State Key Laboratory of Solidification Processing in NWPU (No. SKLSP201613).References
- V. Etacheri, R. Marom, R. Elazari, G. Salitra and D. Aurbach, Energy Environ. Sci., 2011, 4, 3243–3262 CAS.
- J. B. Goodenough and Y. Kim, Chem. Mater., 2010, 22, 587–603 CrossRef CAS.
- J. B. Goodenough and K.-S. Park, J. Am. Chem. Soc., 2013, 135, 1167–1176 CrossRef CAS PubMed.
- M. Armand and J. M. Tarascon, Nature, 2008, 451, 652–657 CrossRef CAS PubMed.
- J. M. Tarascon and M. Armand, Nature, 2001, 414, 359–367 CrossRef CAS PubMed.
- L. Liu, F. Xie, J. Lyu, T. Zhao, T. Li and B. G. Choi, J. Power Sources, 2016, 321, 11–35 CrossRef CAS.
- J. S. Chen and X. W. Lou, Small, 2013, 9, 1877–1893 CrossRef CAS PubMed.
- Q.-H. Wu, C. Wang and J.-G. Ren, Ionics, 2013, 19, 1875–1882 CrossRef CAS.
- X. W. Lou, L. A. Archer and Z. Yang, Adv. Mater., 2008, 20, 3987–4019 CrossRef CAS.
- A. S. Arico, P. Bruce, B. Scrosati, J. M. Tarascon and W. Van Schalkwijk, Nat. Mater., 2005, 4, 366–377 CrossRef CAS PubMed.
- Y. Chen, J. Ma, Q. Li and T. Wang, Nanoscale, 2013, 5, 3262–3265 RSC.
- K. Zhao, L. Zhang, R. Xia, Y. Dong, W. Xu, C. Niu, L. He, M. Yan, L. Qu and L. Mai, Small, 2016, 12, 588–594 CrossRef CAS PubMed.
- X. W. Lou, Y. Wang, C. Yuan, J. Y. Lee and L. A. Archer, Adv. Mater., 2006, 18, 2325–2329 CrossRef CAS.
- X. M. Yin, C. C. Li, M. Zhang, Q. Y. Hao, S. Liu, L. B. Chen and T. H. Wang, J. Phys. Chem. C, 2010, 114, 8084–8088 CAS.
- B. Huang, X. Li, Y. Pei, S. Li, X. Cao, R. C. Massé and G. Cao, Small, 2016, 12, 1945–1955 CrossRef CAS PubMed.
- C. Xu, J. Sun and L. Gao, J. Mater. Chem., 2012, 22, 975–979 RSC.
- Y. Wang, H. C. Zeng and J. Y. Lee, Adv. Mater., 2006, 18, 645–649 CrossRef CAS.
- D. Pham-Cong, J. S. Park, J. H. Kim, J. Kim, P. V. Braun, J. H. Choi, S. J. Kim, S. Y. Jeong and C. R. Cho, Carbon, 2017, 111, 28–37 CrossRef CAS.
- J. Ye, H. Zhang, R. Yang, X. Li and L. Qi, Small, 2010, 6, 296–306 CrossRef CAS PubMed.
- Y. Zhu, H. Guo, H. Zhai and C. Cao, ACS Appl. Mater. Interfaces, 2015, 7, 2745–2753 CAS.
- Z. Wang, H. Zhang, N. Li, Z. Shi, Z. Gu and G. Cao, Nano Res., 2010, 3, 748–756 CrossRef CAS.
- (a) L. Pan, K.-X. Wang, X.-D. Zhu, X.-M. Xie and Y.-T. Liu, J. Mater. Chem. A, 2015, 3, 6477–6483 RSC; (b) D. Zhang, Q. Wang, Q. Wang, J. Sun, L. Xing and X. Xue, Electrochim. Acta, 2015, 174, 476–482 CrossRef.
- R. Liang, H. Cao, D. Qian, J. Zhang and M. Qu, J. Mater. Chem., 2011, 21, 17654–17657 RSC.
- L. Cui, J. Shen, F. Cheng, Z. Tao and J. Chen, J. Power Sources, 2011, 196, 2195–2201 CrossRef CAS.
- R. Liu, D. Li, C. Wang, N. Li, Q. Li, X. Lu, J. S. Spendelow and G. Wu, Nano Energy, 2014, 6, 73–81 CrossRef CAS.
- C. Botas, D. Carriazo, G. Singh and T. Rojo, J. Mater. Chem. A, 2015, 3, 13402–13410 CAS.
- Y. Deng, C. Fang and G. Chen, J. Power Sources, 2016, 304, 81–101 CrossRef CAS.
- L. Wang, D. Wang, Z. Dong, F. Zhang and J. Jin, Nano Lett., 2013, 13, 1711–1716 CrossRef CAS PubMed.
- H. Zhang, H. Song, X. Chen, J. Zhou and H. Zhang, Electrochim. Acta, 2012, 59, 160–167 CrossRef CAS.
- S. Ding, J. S. Chen and X. W. Lou, Adv. Funct. Mater., 2011, 21, 4120–4125 CrossRef CAS.
- C. A. Bonino, L. Ji, Z. Lin, O. Toprakci, X. Zhang and S. A. Khan, ACS Appl. Mater. Interfaces, 2011, 3, 2534–2542 CAS.
- Z. Shen, Y. Hu, Y. Chen, R. Chen, X. He, X. Zhang, H. Shao and Y. Zhang, Electrochim. Acta, 2016, 188, 661–670 CrossRef CAS.
- M. Dirican, M. Yanilmaz, K. Fu, Y. Lu, H. Kizil and X. Zhang, J. Power Sources, 2014, 264, 240–247 CrossRef CAS.
- W. Xie, L. Gu, F. Xia, B. Liu, X. Hou, Q. Wang, D. Liu and D. He, J. Power Sources, 2016, 327, 21–28 CrossRef CAS.
- (a) J. Qin, C. He, N. Zhao, Z. Wang, C. Shi, E.-Z. Liu and J. Li, ACS Nano, 2014, 8, 1728–1738 CrossRef CAS PubMed; (b) L. Xing, C. Ma, C. Cui and X. Xue, Solid State Sci., 2012, 12, 111–116 CrossRef.
- Y. Dong, M. Yu, Z. Wang, Y. Liu, X. Wang, Z. Zhao and J. Qiu, Adv. Funct. Mater., 2016, 26, 7590–7598 CrossRef CAS.
- W.-M. Zhang, J.-S. Hu, Y.-G. Guo, S.-F. Zheng, L.-S. Zhong, W.-G. Song and L.-J. Wan, Adv. Mater., 2008, 20, 1160–1165 CrossRef CAS.
- J. Yang, L. Xi, J. Tang, F. Chen, L. Wu and X. Zhou, Electrochim. Acta, 2016, 217, 274–282 CrossRef CAS.
- F. Wang, H. Jiao, E. He, S. Yang, Y. Chen, M. Zhao and X. Song, J. Power Sources, 2016, 326, 78–83 CrossRef CAS.
- H. Xue, J. Zhao, J. Tang, H. Gong, P. He, H. Zhou, Y. Yamauchi and J. He, Chem.–Eur. J., 2016, 22, 4915–4923 CrossRef CAS PubMed.
- S. M. He, Dissert. Master Degree, China, 2007.
- L. Wu, J. Yang, X. Zhou, M. Zhang, Y. Ren and Y. Nie, J. Mater. Chem. A, 2016, 4, 11381–11387 CAS.
- S. R. Mukai, T. Hasegawa, M. Takagi and H. Tamon, Carbon, 2004, 42, 837–842 CrossRef CAS.
- W. Zhang, X. Zhu, X. Chen, Y. Zhou, Y. Tang, L. Ding and P. Wu, Nanoscale, 2016, 8, 9828–9836 RSC.
- Y. Li, Y. Zhao, C. Ma and Y. Zhao, Electrochim. Acta, 2016, 218, 191–198 CrossRef CAS.
- S.-W. Bian and L. Zhu, RSC Adv., 2013, 3, 4212–4215 RSC.
- J. Wang, W. Li, F. Wang, Y. Xia, A. M. Asiri and D. Zhao, Nanoscale, 2014, 6, 3217–3222 RSC.
- W. Li, D. Yoon, J. Hwang, W. Chang and J. Kim, J. Power Sources, 2015, 293, 1024–1031 CrossRef CAS.
- M. Wang, H. Yang, X. Zhou, W. Shi, Z. Zhou and P. Cheng, Chem. Commun., 2016, 52, 717–720 RSC.
- X. Zhou, L. Yu and X. W. Lou, Nanoscale, 2016, 8, 8384–8389 RSC.
- X. Zhou, L. Xi, F. Chen, T. Bai, B. Wang and J. Yang, Electrochim. Acta, 2016, 213, 633–640 CrossRef CAS.
- B. Luo, T. Qiu, L. Hao, B. Wang, M. Jin, X. Li and L. Zhi, J. Mater. Chem. A, 2016, 4, 362–367 CAS.
Footnote |
| † Electronic supplementary information (ESI) available. See DOI: 10.1039/c7ra03594b |
| This journal is © The Royal Society of Chemistry 2017 |

