 Open Access Article
Temperature controlled shape evolution of iron oxide nanostructures in HMTA media†
Bin Zhao‡
 a,
Kevin M. Ryan
 b,
Emmet O'Reillyb and
Conor McCarthy*a
aSchool of Engineering, Bernal Institute, University of Limerick, Limerick, Ireland. E-mail: Conor.McCarthy@ul.ie; Fax: +353 61 202944; Tel: +353 61 234334
bSchool of Natural Sciences, Bernal Institute, University of Limerick, Limerick, Ireland
First published on 17th May 2017
Abstract
This work reported an improved approach to the synthesis of iron oxide nanostructures using iron(III) chloride as the precursor and hexamethylenetetramine (HMTA) as the key auxiliary. A range of iron oxide (alkoxide) nanostructures including nanosheets, hierarchical flowers (assembled by thin nanosheets), mesoporous hollow nanospheres and solid nanospheres were obtained only by altering the reaction temperature from 180 °C to 240 °C in a single synthetic protocol. Supplementary experiments driven by reaction time were designed in order to further clarify the morphological evolution behaviors of these nanostructures, which discovered that the spherical morphology with the size of about 150–200 nm formed from the inside of micro-scaled flower-like clusters gradually by the condensing and weaving of curled nanosheets, suggesting that the hollow nanospheres were obtained consequently by the further condensation of incompact nanospheres with the assistance of the rearrangement of surfactant micelles, followed by the oriented attachment assembly and Ostwald ripening.
1. Introduction
The controlled fabrication of iron oxide (e.g. Fe2O3, Fe3O4, FeOOH, Fe(OH)3) nanostructures in different morphologies has attracted increasing attention in recent years due to their potential applications in optical, electrical, magnetic, biological, catalytic, mechanical and chemical fields.1–15 From an application perspective two of the most promising morphologies are flower-like nanosheet assemblies and hollow nano-spheres. Due to their large specific surface areas, iron oxide nanosheets and flower-like assemblies have been reported as high performance anode materials for lithium-ion batteries and dye-sensitized solar cells.3,4 In addition mesoporous iron oxide hollow micro/nano-spheres have been investigated as vehicles for controlled drug delivery,5,6 microwave absorption,7,8 sensing platforms9 and waste water treatment.10,11 Synthesis of iron oxide nanomaterials typically follows one of two synthetic pathways resulting in different nanostructure morphologies, namely nanosheets and flower-like assemblies3,4,7,13,14,17 and hollow nanospheres and solid nanospheres.2,9,11,15,16 Differing synthetic routes are obtained by adjusting experimental parameters such as type of precursor, nucleator, surfactant and solvent ratios in addition to reaction time and temperature. Therefore the ability to synthesize multiple iron oxide nanostructures in one synthetic procedure only by altering reaction time and temperature is clearly advantageous. To date, the synthesis of iron oxide flower like assemblies and hollow nanospheres utilizing the same synthetic route has not been reported due to their different structural properties. Iron oxide nanoflower structures are approximately 10 times larger in size than hollow iron oxide nanospheres, thereby presenting significant challenges in obtaining both structures using the same precursor and reactant ratios.4,6,7,10,13,14Mild alkali media such as hexamethylenetetramine (HMTA) has previously been used in the synthesis of porous ZnO hollow spheres,18 flower-like NiO19 and CuO20 assemblies, highlighting HMTA as a more suitable media for the synthesis of unique morphologies in the same synthetic route, relative to urea and aqueous ammonia.4,6,7,17 Hence, in this work we highlight the benefits of using HMTA as the key reactant in the synthesis of multiple iron oxide (alkoxide) nanostructures. Iron alkoxide nanosheets, iron alkoxide nanoflowers (assembled by nanosheets), mesoporous Fe3O4 hollow nanospheres, Fe3O4 hollow nanospheres and solid Fe3O4 spheres can be obtained in the same experimental system by simply tuning the overall reaction temperature from 160 to 240 °C. The resulting structures are characterized by XRD, SEM, TEM and HRTEM and the effect of altering reaction temperatures on subsequent nanostructure morphology is investigated.
2. Experimental section
2.1 Materials
FeCl3·6H2O and ethylene glycol (EG) were purchased from Fisher Scientific. Hexamethylenetetramine (HMTA) and cetyltrimethylammonium bromide (CTAB) were purchased from Sigma Aldrich. All chemicals were of analytical grade and were used without further purification.2.2 Synthesis
In a typical synthetic procedure, 0.006 mol CTAB and 0.0214 mol HMTA were dissolved in 60 mL ethylene glycol (EG) with ultrasonic assistance. 0.016 mol FeCl3·6H2O was then added under continuous stirring until fully dissolved. The solution was transferred to a 100 ml Teflon-lined autoclave and sealed. Separate treatments were carried out at 160, 180, 200, 220, and 240 °C for 12 h. Once cooled to room temperature, the precipitate was washed with deionized water and absolute ethanol. A brown powder like product was obtained from the 160 and 180 °C reactions and it was possible to separate this by centrifugation. A black powder like product was obtained at 200, 220 or 240 °C and this was separated by magnetic decantation. Products were dried at 80 °C for 12 h in a vacuum oven. In addition, the brown powder like product obtained at 160 or 180 °C was further calcined at 400 °C for 1 h.2.3 Characterizations
X-ray diffraction (XRD) analysis was conducted using a PANalytical X'Pert PRO MRD instrument with a Cu Kα radiation source (λ = 1.5418 Å) and an X'celerator detector. The size and morphology of iron oxide samples were characterized using field emission scanning electron microscopy (FESEM, Hitachi SU-70 system) at accelerating voltages of 10–20 kV. Powders of samples were mounted onto conductive copper tapes, which were then attached onto the surfaces of SEM brass stubs. Samples were coated with gold by a sputtering method to minimize charging effects under FESEM imaging conditions.Both transmission electron microscopy (TEM) and high-resolution transmission electron microscopy (HRTEM) characterizations were performed using a JEOL JEM 2100F field emission microscope equipped with EDX for performing Selected Area Diffraction (SAED). To prepare the TEM specimens, the powder samples were dispersed ultrasonically in anhydrous ethanol. One drop of the suspension was placed on a carbon film supported on a copper grid and allowed to dry in air before the specimens were transferred into the microscope.
Specific surface areas were measured by nitrogen adsorption–desorption method using an ASAP 2010 Micromeritics apparatus following the BET analysis. Adsorption and desorption of N2 was performed at −196 °C. Samples had been previously outgassed by heating at 100 °C under vacuum (3 mm Hg). The corresponding desorption isotherm was used to determine the pore size distribution using the Barret–Joyner–Halender (BJH) method.
3. Results and discussion
Table 1 presents an overview of the iron oxide nanostructures synthesized in HMTA media at varying temperatures. Iron alkoxide nanosheets, iron alkoxide hierarchical flowers (assembled by thin nanosheets), Fe3O4 hollow nanospheres with mesoporous shells, Fe3O4 hollow nanospheres and Fe3O4 solid nanospheres were obtained in the same experimental system by tuning the solvothermal temperature from 160 to 240 °C. Interestingly, the iron alkoxide flower assemblies and Fe3O4 mesoporous hollow nanospheres differed significantly in size (∼2.5 micrometers and ∼250 nm respectively), however both nanostructures were obtained by varying the solvothermal temperature from 180 to 200 °C. Additionally, Fe2O3 nanoparticles and flowers were obtained by calcining the iron alkoxide nanosheets and flowers at 400 °C for 1 h, indicating that the flower-like morphology is maintained at high temperatures.3.1 Crystalline and morphological results
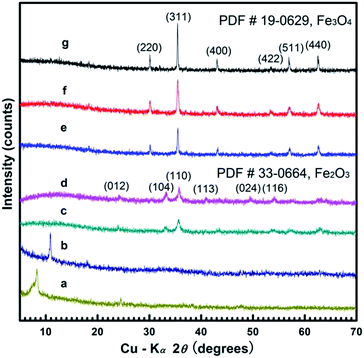
Fig. 1a and b shows the XRD patterns of the alkoxide nanosheets and nanoflowers obtained at 160 and 180 °C respectively. The diffraction peak located in the low-angle region (ca. 8.5° in Fig. 1a, or ca. 11° in Fig. 1b) can be attributed to the iron alkoxide species as previously reported,3,7 the formula for which can be written as Fe(OCH2CH2O)x. The corresponding d-values at 8.5° and 11° are 1.039 and 0.804 nm, suggesting a reduction in d-value when reaction temperature is increased from 160 to 180 °C. Fig. 1c and d show the nanosheet and nanoflowers products after calcination at 400 °C for 1 h. The XRD patterns of these samples correspond well with the hematite Fe2O3 polymorph (JCPDS 33-0664) based on the characteristic peaks at 24.1° (012), 33.2° (104), 35.6° (110), 40.9° (113), 49.5° (024) and 54.1° (116).This is further confirmed by the disappearance of the diffraction peak at about 10 ± 2° indicating the complete phase transition from iron alkoxide intermediate to the hematite Fe2O3 structure. Fig. 1e–g show the XRD patterns of the Fe3O4 hollow and solid nanospheres obtained at 200, 220 and 240 °C, respectively. The diffraction peaks at 30.1°, 35.4°, 43.1°, 56.9° and 62.5° correspond well with the (220), (311), (400), (511) and (440) lattice planes of magnetite Fe3O4 (JCPDS 19-0629) without any other impurities. The diffraction intensities of XRD patterns are enhanced and the corresponding FWHMs of main peaks narrow with increasing temperature, thereby signifying that the crystalline grain size of product grows larger at higher temperatures, in accordance with the Scherrer equation.2,6,21
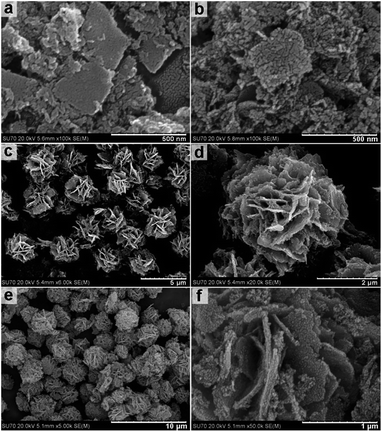
Fig. 2a shows an FESEM image of the uncalcined scattered nanosheets obtained at a solvothermal reaction temperature of 160 °C resulting in nanosheets with a length/width of approximately 200–400 nm. Fig. 2b shows the same nanosheets post calcination at 400 °C for 1 h. Imaging suggests that while overall sheet-like morphology is maintained the calcination process results in nanosheet fracturing and the formation of a granular morphology with grain sizes of approximately 10–20 nm. This is also supported by high-resolution TEM imaging (Fig. S1, ESI†).
Fig. 2c shows the flower like clusters obtained by solvothermal treatment at 180 °C for 12 h prior to calcination. FESEM images indicate a uniform size of approximately 2.5 μm. FESEM images in Fig. 2d indicate flower-like clusters are formed by aggregating branches of nanosheets with an approximate thickness of 50 nm. Fig. 2e and f indicate that the flower like clusters maintain their morphologies post calcination.
This observation is further supported by TEM imaging (Fig. S2, ESI†). FESEM and TEM imaging demonstrates that the structures obtained by solvothermal treatment between 200 and 240 °C have significantly different morphologies from those obtained at lower temperatures. Fig. 3a and b show the hollow nanospheres (HNSs) obtained when the solvothermal temperature is increased to 200 °C. The resulting nanospheres have an outer diameter of approximately 250 nm, and a shell thickness of 30–50 nm (Fig. 3c) and are approximately 10 times smaller in size than the flower like structures obtained at 180 °C. SEM imaging in Fig. 3b indicates that the shells of spheres are assembled from crystalline grains approximately 20 nm in size (Fig. S3, ESI†). Fig. 3d shows the HRTEM imaging of the indexed lattice fringes and corresponds well with the (111) and (![[2 with combining macron]](https://www.rsc.org/images/entities/char_0032_0304.gif) 20) planes of magnetite Fe3O4 polymorph. The ordered diffraction lattice shown in the corresponding SAED pattern (inset of Fig. 3d) confirms the single crystallinity of Fe3O4 HNSs, suggesting that the Fe3O4 HNSs are composed of smaller primary crystalline grains.
20) planes of magnetite Fe3O4 polymorph. The ordered diffraction lattice shown in the corresponding SAED pattern (inset of Fig. 3d) confirms the single crystallinity of Fe3O4 HNSs, suggesting that the Fe3O4 HNSs are composed of smaller primary crystalline grains.
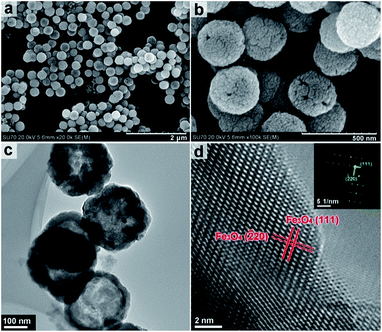 | ||
| Fig. 3 FESEM (a & b) and TEM (c) and HRTEM (d) images of the sample obtained under solvothermal treatment at 200 °C. Inset in (d) the corresponding SAED pattern. | ||
Increasing the overall reaction temperature to 220 °C results in hollow nanospheres of approximately 250 nm in diameter. Fig. 4a and c show the TEM imaging of the hollow nanospheres and highlight the hollow spherical construction with a shell thickness of 50–60 nm. Increasing the solvothermal temperature from 200 to 220 °C increases the overall shell thickness and in some cases causes partial breaking of the spheres to form a cup-like morphology or hollow hemispheres. Fig. 4b and d demonstrate that increasing the reaction temperature to 240 °C results in solid spheres with a uniform size of approximately 250 nm. HRTEM images and corresponding SAED patterns (Fig. S4, ESI†) confirm that both the hollow and solid nanospheres are magnetite Fe3O4 polymorphs with well-defined lattice fringes.
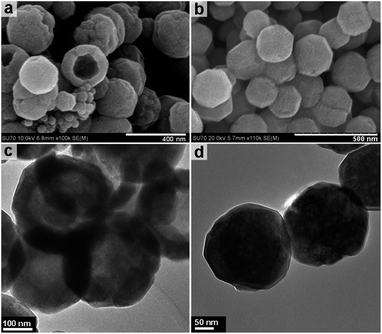 | ||
| Fig. 4 FESEM and TEM images of the sample obtained under solvothermal treatment at 220 °C (a & c) and 240 °C (b & d). | ||
3.2 Porosity results
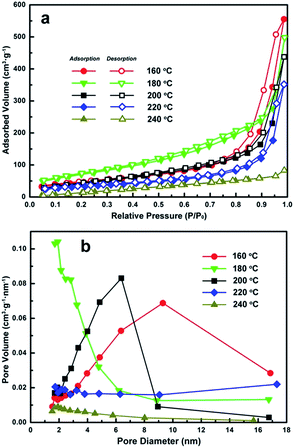
Fig. 5 shows the N2 adsorption–desorption isotherms and Barret–Joyner–Halenda (BJH) pore size distribution plots for each of the different morphologies. The nitrogen adsorption isotherms in Fig. 5a should be of type III,22,23 but most of them present high absorbed volume (>300 cm3 g−1) and obvious hysteresis loops at higher-pressure region. Specifically, a distinct hysteresis loop for the products obtained at 160 °C was observed in the range of 0.7–1.0 P/P0, which belonged to the H3 type.24,25 The red curve (nanosheets formed at 160 °C) shown in Fig. 5b exhibited a relatively broad porous distribution below 20 nm. One possible reason for this may be due to the effect of pores on overlapping plate like nanosheets as observed in SEM and TEM imaging. A hysteresis loop of the H4 type was observed for the flower-like iron alkoxide product and the corresponding pore distribution shifted below 6 nm indicating that the product consists of slit pores accumulated by laminar sheets with decreased spacing.3,4,24 This phenomenon further confirms the formation of flower-like clusters assembled by aggregating nanosheets.The Fe3O4 hollow nanospheres obtained at 200 °C also demonstrated a typical hysteresis loop of the H3 type in the range of 0.5–1.0 P/P0. Absorption/Desorption isotherms for the hollow nanospheres obtained at 200 °C (Fig. 5b black curve) show a sharp peak at 6.5 nm indicating an increase in mesoporous characteristics. This can be attributed to the formation of the primary crystalline grains that in turn constitute the shells of Fe3O4 hollow nanospheres as highlighted in Fig. 3. The hollow nanospheres obtained at 220 °C did not demonstrate any porous characteristics. The pore volume of the solid nanospheres obtained at 240 °C is further lower than that of the porous spheres obtained at 220 °C, which is consistent with the morphologies observed in the SEM and TEM images of Fig. 4.
Meanwhile, the SBET specific surface areas of the products obtained under solvothermal treatment at 160, 180, 200, 220 and 240 °C are 182.68, 208.99, 148.07, 96.42 and 62.54 m2 g−1, respectively. The product obtained at 160 °C has the second largest specific surface areas among all products probably because of the disordered accumulation of nanosheets with considerable thin thickness. The product obtained at 180 °C has the largest SBET value (208.99 m2 g−1) probably due to the hierarchical flower-like morphologies assembled by 2D nanosheets, which optimizes its accumulation status better than the nanosheets products. Then the SBET specific surface areas decrease severely after the formation of Fe3O4 nanostructures. This is most likely due to the collapse of the alkoxide based flower-like assemblies and the formation of Fe3O4 crystalline structures. The Fe3O4 product obtained at 200 °C still has comparatively large specific surface areas (SBET = 148.07 m2 g−1), which should be contributed from its mesoporous feature and hollow spherical morphology together. The SBET specific surface areas decrease severely from 200 to 240 °C, which should be resulted by the disappearances of mesoporous feature and hollow spherical morphology progressively.
3.3 Formation mechanism
To further investigate the formation mechanism and investigate the effect of reaction time on subsequent structure morphology a series of synthetic experiments were performed whereby the temperature was maintained at 200 °C for 3, 6 and 9 h, respectively.Fig. 6 shows the XRD results for the structures obtained after 3, 6, 9, and 12 h solvothermal treatment and indicate that crystal growth occurs from metastable iron alkoxides to more stable polymorphs of magnetite Fe3O4 as per Ostwald's step rule.21,26–29 Fig. 6a shows an amorphous product is obtained after 3 h of reaction time. The diffraction peak at about 8.5° in Fig. 6b (marked as “Δ”) corresponds well with the XRD pattern of the iron alkoxide nanosheets in Fig. 1a, indicating that the iron alkoxide intermediates are formed after an overall reaction time of 6 h. The product obtained at 9 h (Fig. 6c) exhibits the standard Fe3O4 polymorph with low crystallinity co-existing with a weak diffraction peak at about 11° (marked as “Φ”). This corresponds well with the iron alkoxide flower-like assemblies in Fig. 1b. Finally, the product obtained after 12 h (Fig. 6d) displays a typical pattern consistent with magnetite Fe3O4.
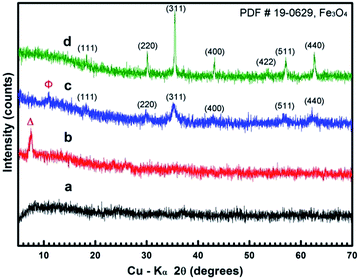 | ||
| Fig. 6 XRD patterns of samples obtained in the typical solvothermal procedure at 200 °C for 3 (a), 6 (b), 9 (c) and 12 h (d). | ||
Similar to the reported layered sodium titanate,21,28,29 the iron alkoxides herein with a diffraction peak close to 10° should contain wide lattice spacing (ca. 1 nm), in which iron atoms are responsible for the basic units of each layer and the glycolates of differing chain length are responsible for the interlayer spacing. Iron alkoxides with a diffraction peak at 11° should have higher condensation than that at about 8.5°. Results indicate that the condensation process from Fe(OCH2CH2O)x to iron oxide can be performed thermodynamically (e.g. increasing temperature from 180 to 200 °C), or time dependently (e.g. prolonging the duration time from 6 to 9 h at 200 °C), resulting in the shift of diffraction peak to higher angles and corresponding growth of nanosheets.
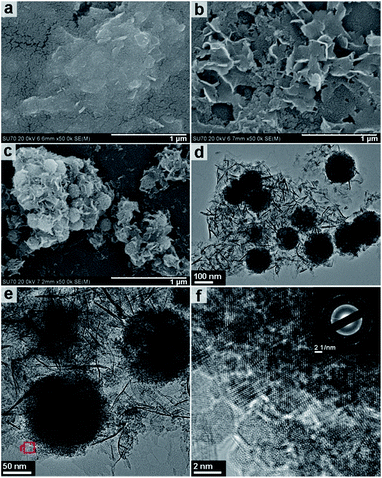
Fig. 7 shows the FESEM and HRTEM images of the structures obtained after 3, 6 and 9 h of solvothermal treatment at 200 °C. The FESEM image of the product obtained after a reaction time of 3 h (Fig. 7a) displays only a sheet-like morphology and is consistent with amorphous XRD pattern obtained in Fig. 6a. Fig. 6b shows that nanosheets with a thickness of approximately 10–20 nm are obtained after 6 h of reaction time. It is upon increasing the reaction time from 6 to 9 h that the most significant changes in morphology are observed. Fig. 7c shows the FESEM images of the product obtained after 9 h of solvothermal treatment at 200 °C. The images show sheet and spherical shaped structures of approximately 150–200 nm in size. The image suggests that the spheres have grown from within the nanosheet assemblies. This is further confirmed by the TEM and HRTEM imaging shown in Fig. 7d–f. Fig. 7f shows that the incompact nanospheres consist of aggregated nano-grains ranging in size from 2–3 nm in imperfect oriented attachment; this is also confirmed by HRTEM imaging (Fig. S5, ESI†). The corresponding SAED pattern (inset Fig. 7f) highlights that the nanocrystalline nature of Fe3O4 exists in random orientation. The formation status of the spheres inside the nanosheet assemblies is further observed by supplementary SEM results (Fig. S6, ESI†).
Based on SEM and HRTEM imaging a schematic of the proposed morphological evolution herein is presented in Scheme 1. Self-assembly, oriented attachment and Ostwald ripening were commonly employed in previous works to elucidate the formation mechanism of either flower-like or hollow spherical morphologies, which were suitable for not only iron oxide1–3,7–14,24,27,30–33 but also various kinds of metal oxide, metal alloys or non-metal SiO2 nanostructures.28,29,34–36 These theories/mechanisms are mostly based on the same intrinsic assumption that the crystal growth and morphological evolution tend towards a thermodynamic equilibrium regime in the reaction process. In general, the crystalline/morphological transition is driven by the reduction of overall lattice/surface energy.34,35
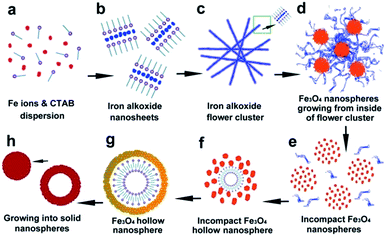 | ||
| Scheme 1 Schematic illustrations of the morphological evolution process between tailored iron oxide (alkoxide) nanostructures. | ||
Our observations suggest that during the initial period of solvothermal treatment Fe3+ ions react with the solvent EG (Scheme 1a) to form the primary nuclei Fe(OCH2CH2O)x.3,7,13,14,17,33 The reduction of the overall surface energy by elimination of the interface drives the oriented attachment, thus the lattice planes with higher surface energy are preferentially eliminated in the process of crystal growth.31,37,38 This is followed by self-assembly to form the 2D nanosheets with the assistance of surfactant CTAB (Scheme 1b). During this process it is possible the CTAB effectively reduces the surface energy toward the vertical axis of the sheet plane, resulting in an Fe(OCH2CH2O)x intermediate with a layered crystalline structure and XRD peak at 8–8.5°.
When the highest energy interface was eliminated by oriented attachment, the subordinate high-energy interface became the highest energy interface; thus, the oriented attachment would take place sequentially on these subordinate interfaces.38 When the 2D nanosheets reached a certain size, the iron alkoxide nanosheets would spontaneously crimp into curled self-assemblies (Scheme 1c and d). This curling phenomenon has also been observed in the case of layered titanate nanosheets.39 This behavior is possibly due to continued oriented attachment and also the upheaval of internal stress during further condensation of iron alkoxide layers (XRD peak shifts from ca. 8–8.5° to ca. 11°). If this process were maintained at suitable reaction conditions, (e.g. 180 °C, 12 h) the thickness would change from approximately 10–20 nm to ca. 50 nm due to the subordinate oriented attachment and the sheet assemblies would further grow into the flower-like clusters such as those presented in Fig. 2.
It is likely that the incompact nanospheres grow from the inside flower-like clusters (Scheme 1d) as a result of condensing and weaving of the nanosheets. Based on the images observed in Fig. 7, the iron oxide primary nucleus with a grain size of approximately 2–3 nm are initially generated by the condensation of iron alkoxides inside the flower-like assemblies. Subsequent aggregation of the nuclei leads to the formation of several incompact spheres at numerous locations on the flower like assemblies, followed by Ostwald ripening.2,10,27,30,33 Continued condensation results in the formation of larger crystalline grains, during which the surfactant micelles located on the surface of Fe3O4 primary nuclei rearrange. Rearrangement of these free surfactant micelles occurs between 9 h and 12 h at 200 °C reaction temperature resulting in the formation of the hollow spherical morphology as shown in Scheme 1g. Further condensation results in thickening of the nanosphere shells and the formation of solid spheres (Scheme 1h).
4. Conclusions
In conclusion, we have demonstrated a facile procedure for the synthesis of a variety of iron oxide (alkoxide) nanostructures using a single experiment approach that only needs to change the temperature. Morphologies including nanosheets, nanoflowers, hollow and solid nanospheres can be reproducibly obtained simply by varying the reaction temperature between 160 and 240 °C. SEM and HRTEM imaging demonstrated that the morphological evolution of the nanostructures follows previously reported oriented attachment assembly and Ostwald ripening mechanisms. Hollow and solid nanospheres were subsequently obtained by further condensation of incompact nanospheres. Facile approaches to the synthesis of iron alkoxide nanostructures such as those presented in this work can underpin the use of these materials in high performance applications such as magnetic data storage, biosensing and drug delivery.Acknowledgements
This work was supported by Science Foundation Ireland (SFI) under Investigators Project (IvP) 13/IA/1833, “Fastener-less Joining Technologies for High Performance Hybrid Composites-Metal Structures”.Notes and references
- Q. L. He, T. T. Yuan, S. Y. Wei, N. Haldolaarachchige, Z. P. Luo, D. P. Young, A. Khasanov and Z. H. Guo, Angew. Chem., Int. Ed., 2012, 51, 8842–8845 CrossRef CAS PubMed.
- J. B. Lian, X. C. Duan, J. M. Ma, P. Peng, T. Kim and W. J. Zheng, ACS Nano, 2009, 3, 3749–3761 CrossRef CAS PubMed.
- X. H. Ma, X. Y. Feng, C. Song, B. K. Zou, C. X. Ding, Y. Yu and C. H. Chen, Electrochim. Acta, 2013, 93, 131–136 CrossRef CAS.
- H. H. Niu, S. W. Zhang, Q. Ma, S. X. Qin, L. Wan, J. Z. Xu and S. D. Miao, RSC Adv., 2013, 3, 17228–17235 RSC.
- K. Cheng, S. Peng, C. J. Xu and S. H. Sun, J. Am. Chem. Soc., 2009, 131, 10637–10644 CrossRef CAS PubMed.
- K. Cheng, Z. Y. Sun, Y. M. Zhou, H. Zhong, X. K. Kong, P. Xia, Z. Guo and Q. W. Chen, Biomater. Sci., 2013, 1, 965–974 RSC.
- X. A. Li, B. Zhang, C. H. Ju, X. J. Han, Y. C. Du and P. Xu, J. Phys. Chem. C, 2011, 115, 12350–12357 CAS.
- B. Zhao, M. Hardiman, K. M. Ryan, E. O'Reilly and C. McCarthy, CrystEngComm, 2016, 18, 6096–6101 RSC.
- W. Yan, H. Q. Fan, Y. C. Zhai, C. Yang, P. R. Ren and L. M. Huang, Sens. Actuators, B, 2011, 160, 1372–1379 CrossRef CAS.
- X. Zhang, M. Lin, X. Y. Lin, C. T. Zhang, H. T. Wei, H. Zhang and B. Yang, ACS Appl. Mater. Interfaces, 2014, 6, 450–458 CAS.
- Y. B. Liu, Y. Q. Wang, S. M. Zhou, S. Y. Lou, L. Yuan, T. Gao, X. P. Wu, X. J. Shi and K. Wang, ACS Appl. Mater. Interfaces, 2012, 4, 4913–4920 CAS.
- B. Karagoz, J. Yeow, L. Esser, S. M. Prakash, R. P. Kuchel, T. P. Davis and C. Boyer, Langmuir, 2014, 30, 10493–10502 CrossRef CAS PubMed.
- J. J. Zhang, Y. L. Chen, Y. F. Sun, T. Huang and A. S. Yu, RSC Adv., 2013, 3, 20639–20646 RSC.
- X. Y. Li, Z. J. Si, Y. Q. Lei, X. N. Li, J. K. Tang, S. Y. Song and H. J. Zhang, CrystEngComm, 2011, 13, 642–648 RSC.
- S. W. Cao, Y. J. Zhu, M. Y. Ma, L. Li and L. Zhang, J. Phys. Chem. C, 2008, 112, 1851–1856 CAS.
- B. L. Lv, Y. Xu, D. Wu and Y. H. Sun, CrystEngComm, 2011, 13, 7293–7298 RSC.
- M. Khosravi and S. Azizian, Adv. Powder Technol., 2014, 25, 1578–1584 CrossRef CAS.
- N. Tripathy, R. Ahmad, H.-S. Jeong and Y.-B. Hahn, Inorg. Chem., 2012, 51, 1104–1110 CrossRef CAS PubMed.
- S.-I. Kim, J.-S. Lee, H.-J. Ahn, H.-K. Song and J.-H. Jang, ACS Appl. Mater. Interfaces, 2013, 5, 1596–1603 CAS.
- M. Vaseem, A. Umar, S. H. Kim and Y.-B. Hahn, J. Phys. Chem. C, 2008, 112, 5729–5735 CAS.
- B. Zhao, F. Chen, Y. C. Jiao and J. L. Zhang, J. Mater. Chem., 2010, 20, 7990–7997 RSC.
- S. Brunauer, L. S. Deming, W. E. Deming and E. Teller, J. Am. Chem. Soc., 1940, 62, 1723–1732 CrossRef CAS.
- K. S. W. Sing, D. H. Everett, R. A. W. Haul, L. Moscou, R. A. Pierotti, J. Rouquerol and T. Siemieniewska, Pure Appl. Chem., 1985, 57, 603–619 CrossRef CAS.
- Z. Li, H.-F. Fei, Y. Tan, X. Z. Zhang, Z. Xie and Z. Zhang, RSC Adv., 2015, 5, 38093–38099 RSC.
- Z. Ali, L. Tian, P. Zhao, B. Zhang, A. Nisar, X. Li, H. Zhang and Q. Zhang, RSC Adv., 2015, 5, 92449–92455 RSC.
- R. A. V. Santen, J. Phys. Chem., 1984, 88, 5768–5769 CrossRef.
- W. Ostwald, Z. Phys. Chem., 1897, 22, 289–330 CAS.
- B. Zhao, F. Chen, Q. W. Huang and J. L. Zhang, Chem. Commun., 2009, 34, 5115–5117 RSC.
- B. Zhao, L. Lin and D. He, J. Mater. Chem. A, 2013, 1, 1659–1668 CAS.
- J. F. Banfield, S. A. Welch, H. Z. Zhang, T. T. Ebert and R. L. Penn, Science, 2000, 289, 751–754 CrossRef CAS PubMed.
- X. F. Yang, J. X. Fu, C. J. Jin, J. Chen, C. L. Liang, M. M. Wu and W. Z. Zhou, J. Am. Chem. Soc., 2010, 132, 14279–14287 CrossRef CAS PubMed.
- V. M. Yuwono, N. D. Burrows, J. A. Soltis and R. L. Penn, J. Am. Chem. Soc., 2010, 132, 2163–2165 CrossRef CAS PubMed.
- B. X. Wang, Y. C. Yin, C. J. Liu, S. S. Yu and K. Z. Chen, Dalton Trans., 2013, 42, 10042–10055 RSC.
- J. W. Mullin, Crystallization, Butterworth-Heinemann, Oxford, UK, 4th edn, 2001 Search PubMed.
- M. Wang, B. Zhao, S. Xu, L. Lin, S. Liu and D. He, Chem. Commun., 2014, 50, 930–932 RSC.
- M. Wang, Q. Zeng, B. Zhao and D. He, J. Mater. Chem. A, 2013, 1, 11465–11472 CAS.
- R. L. Penn and J. F. Banfield, Science, 1998, 281, 969–971 CrossRef CAS PubMed.
- H. L. Xu, W. Z. Wang, W. Zhu, L. Zhou and M. L. Ruan, Cryst. Growth Des., 2007, 7, 2720–2724 CAS.
- B. Zhao, F. Chen, X. Gu and J. Zhang, Chem.–Asian J., 2010, 5, 1546–1549 CrossRef CAS PubMed.
Footnotes |
| † Electronic supplementary information (ESI) available: XRD patterns, SEM and TEM images. See DOI: 10.1039/c7ra03603e |
| ‡ Present address: Chair of Materials Science, Otto Schott Institute of Materials Research, Friedrich Schiller University Jena, Löbdergraben 32, 07743 Jena, Germany. |
| This journal is © The Royal Society of Chemistry 2017 |


