 Open Access Article
Gasochromic properties of novel tungsten oxide thin films compounded with methyltrimethoxysilane (MTMS)
Zenghai Zhanga,
Dayong Guanb,
Guohua Gao *a,
Guangming Wuac and
Haoran Wanga
aShanghai Key Laboratory of Special Artificial Microstructure, Tongji University, Shanghai 200092, P. R. China. E-mail: gao@tongji.edu.cn
bCollege of Electronic and Information Engineering, Tongji University, Shanghai 200092, P. R. China
cKey Laboratory of Advanced Civil Engineering Materials, Ministry of Education, Tongji University, Shanghai 200092, P. R. China
First published on 23rd August 2017
Abstract
Herein, thick tungsten–silicon films with long-term gasochromic performance were synthesized from methyltrimethoxysilane (MTMS) and tungsten oxide sols. Via the addition of MTMS, the thickness of WO3/SiO2 films was largely increased to nearly 3 μm without any cracks. Moreover, the transmittance difference between coloring and bleaching status reached over 97% in the near-infrared region. Different ratios of WO3–MTMS compound films were prepared to confirm that the proper proportion of WO3![[thin space (1/6-em)]](https://www.rsc.org/images/entities/char_2009.gif) :
:![[thin space (1/6-em)]](https://www.rsc.org/images/entities/char_2009.gif) MTMS was 1
MTMS was 1![[thin space (1/6-em)]](https://www.rsc.org/images/entities/char_2009.gif) :
:![[thin space (1/6-em)]](https://www.rsc.org/images/entities/char_2009.gif) 2, and WO3–TEOS films were also prepared for comparisons. FT-IR and Raman spectra were obtained to characterize the structure of W–O and the existence of –CH3 bonds. SEM and TEM images revealed the thickness of compound films and cross-links of the microstructure. The results showed that the WO3–MTMS films exhibited a stable network with tungsten and silicon bonds, and the methyl group derived from MTMS hydrolysate played a positive role in gel and drying processes.
2, and WO3–TEOS films were also prepared for comparisons. FT-IR and Raman spectra were obtained to characterize the structure of W–O and the existence of –CH3 bonds. SEM and TEM images revealed the thickness of compound films and cross-links of the microstructure. The results showed that the WO3–MTMS films exhibited a stable network with tungsten and silicon bonds, and the methyl group derived from MTMS hydrolysate played a positive role in gel and drying processes.
1 Introduction
Tungsten oxide is an important multifunctional material belonging to the n-type oxide semiconductor family and has photocatalytic, photochromic, gasochromic, thermochromic, and electrochromic properties; therefore, tungsten oxide is employed in various applications such as in gas-sensing, information display devices, smart windows, gas sensors, erasable high density storage devices, organic reaction catalysts, and battery cathode materials.1–8For its application in smart windows, the sol–gel method is a very economical way to synthesize large films. Various elements, such as molybdenum,9–12 titanium,13,14 vanadium,15 silicon,16–18 and CTAB, are added to tungsten oxide to prepare films.19 WO3 compound films with silicon dioxide were mostly fabricated via tetraethoxysilane (TEOS). The structure of the compound exhibited a stable network, and SiO2 (derived from TEOS) restrained the evolution of edge-sharing to corner-sharing of W–O–W. This compound film had high gas-sensing properties, a rapid coloring-bleaching speed, an excellent transmittance gap, and stable recycling under hydrogen gas in a hydrogen and argon environment. An ordinary glass slide was a relatively good substrate to make films from a WO3–TEOS mixed sol. However, to promote the coloring-transmittance depth, thicker films always cracked after many coloring-bleaching cycles.17,18 Hence, studies are being conducted to solve the issues related with their practical application in smart widows via a sol–gel method.
MTMS has always been used to prepare aerogels with low density and favorable properties of hydrophobicity,20 drag reduction, lipophilicity, and good acoustic performances.21 It was thought to be one of general silicon sources, which acted as precursor in aerogel technique filed.
In this study, MTMS was used to provide silicon as the novel precursor to mix tungsten oxide sol in a series of mole ratios. The results showed that compound films had a deep coloring-depth with thicker and non-cracking films. WO3–TEOS compound films were also obtained for comparison. FT-IR and Raman spectra were obtained to characterize the organic and inorganic bonds. SEM and TEM images were obtained to determine the surface morphology and the internal structure. UV-visible spectra were obtained to determine the gasochromic properties of the compound films.
2 Experimental
2.1. Preparation of gasochromic films
WO3 sols were prepared according to the traditional method. About 5 g of metallic W powder (99.8%) was added to 20 mL of H2O2 (30%) in EtOH under slow stirring at room temperature under a normal atmosphere. After centrifugation, the solution was subjected to the reflux process (80 °C) until the sol became transparent orange. Under a water cooling system, MTMS was added to the WO3 sol under stirring in a mole ratio of 2![[thin space (1/6-em)]](https://www.rsc.org/images/entities/char_2009.gif) :
:![[thin space (1/6-em)]](https://www.rsc.org/images/entities/char_2009.gif) 1, 1
1, 1![[thin space (1/6-em)]](https://www.rsc.org/images/entities/char_2009.gif) :
:![[thin space (1/6-em)]](https://www.rsc.org/images/entities/char_2009.gif) 1, 0.9
1, 0.9![[thin space (1/6-em)]](https://www.rsc.org/images/entities/char_2009.gif) :
:![[thin space (1/6-em)]](https://www.rsc.org/images/entities/char_2009.gif) 1, 0.8
1, 0.8![[thin space (1/6-em)]](https://www.rsc.org/images/entities/char_2009.gif) :
:![[thin space (1/6-em)]](https://www.rsc.org/images/entities/char_2009.gif) 1, 0.7
1, 0.7![[thin space (1/6-em)]](https://www.rsc.org/images/entities/char_2009.gif) :
:![[thin space (1/6-em)]](https://www.rsc.org/images/entities/char_2009.gif) 1, 0.6
1, 0.6![[thin space (1/6-em)]](https://www.rsc.org/images/entities/char_2009.gif) :
:![[thin space (1/6-em)]](https://www.rsc.org/images/entities/char_2009.gif) 1, 0.5
1, 0.5![[thin space (1/6-em)]](https://www.rsc.org/images/entities/char_2009.gif) :
:![[thin space (1/6-em)]](https://www.rsc.org/images/entities/char_2009.gif) 1, 0.4
1, 0.4![[thin space (1/6-em)]](https://www.rsc.org/images/entities/char_2009.gif) :
:![[thin space (1/6-em)]](https://www.rsc.org/images/entities/char_2009.gif) 1, 0.3
1, 0.3![[thin space (1/6-em)]](https://www.rsc.org/images/entities/char_2009.gif) :
:![[thin space (1/6-em)]](https://www.rsc.org/images/entities/char_2009.gif) 1, 0.2
1, 0.2![[thin space (1/6-em)]](https://www.rsc.org/images/entities/char_2009.gif) :
:![[thin space (1/6-em)]](https://www.rsc.org/images/entities/char_2009.gif) 1, and 0.1
1, and 0.1![[thin space (1/6-em)]](https://www.rsc.org/images/entities/char_2009.gif) :
:![[thin space (1/6-em)]](https://www.rsc.org/images/entities/char_2009.gif) 1. Then, PdCl2 was added to the mixed sols (WO3, 0.3 mol L−1) as a catalyst in the Pd
1. Then, PdCl2 was added to the mixed sols (WO3, 0.3 mol L−1) as a catalyst in the Pd![[thin space (1/6-em)]](https://www.rsc.org/images/entities/char_2009.gif) :
:![[thin space (1/6-em)]](https://www.rsc.org/images/entities/char_2009.gif) W mole ratios of 1
W mole ratios of 1![[thin space (1/6-em)]](https://www.rsc.org/images/entities/char_2009.gif) :
:![[thin space (1/6-em)]](https://www.rsc.org/images/entities/char_2009.gif) 50. All films were deposited onto glass slides and polished silicon slides via the dip-coating technique. Samples were kept at 50 °C for a few minutes to accelerate the volatility of ethanol. UVI was carried out under a high-pressure Hg lamp (1 kW) for different minutes to make the films stable. The samples were kept under a flow of air during irradiation, and the distance between the films and the light source was 10 cm. Then, the thermal treatment process was carried out in an incubator. Thus, the compound films of WO3–MTMS were synthesized. The compound films of WO3–TEOS were prepared via the similar abovementioned process.
50. All films were deposited onto glass slides and polished silicon slides via the dip-coating technique. Samples were kept at 50 °C for a few minutes to accelerate the volatility of ethanol. UVI was carried out under a high-pressure Hg lamp (1 kW) for different minutes to make the films stable. The samples were kept under a flow of air during irradiation, and the distance between the films and the light source was 10 cm. Then, the thermal treatment process was carried out in an incubator. Thus, the compound films of WO3–MTMS were synthesized. The compound films of WO3–TEOS were prepared via the similar abovementioned process.
2.2. Instruments
All the chemicals used herein were of analytical grade and used without further purification. Tungsten powder (99.9%), hydrogen peroxide (30%), EtOH (99.9%), and TEOS were purchased from the Sinopharm Chemical Reagent Co., Ltd. MTMS was bought from Beijing InnoChem Science & Technology Co., Ltd.The structures of the hydrothermal product were characterized by Fourier transform infrared spectroscopy (FT-IR, Tensor27, Bruker Optik Gmbh) and Raman spectroscopy (HORIBA JOBIN YVON HR800). The surface morphology of the nanostructure was obtained by field emission scanning electron microscopy (FESEM, S-4800), transmission electron microscopy (TEM, JEOL-2100), and high-resolution transmission electron microscopy (HRTEM, field emission JEOL-2100). To test the gasochromic properties of the compound films, UV-visible spectra were obtained to determine the properties under hydrogen gas (mixed with argon in a content of 95%). The transmission measurements of the films at the colored and bleached states were carried out using UV-vis V-570 (Jasco Inc. series spectrometer) at 1000 nm.
3 Characterization
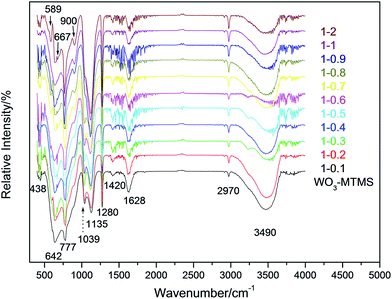
FT-IR spectra were obtained to characterize the bond structures of the compound films. Fig. 1 shows the FT-IR spectra of WO3/MTMS with serial ratios. The absorption peak at 3490 cm−1 was caused by the stretching vibration of –OH, and this peak existed in each sample. The peak at 2970 cm−1 represented the stretching vibration of –CH3 (ref. 22–24) and became sharper as the MTMS content increased. The peaks at 1628 and 1420 were attributed to the bending vibration of –OH in H2O and the –W– group, respectively.25 The band at 1280 cm−1, belonging to methyl deformation, was observed as Si–CH3.20,24 The peak at 1135 cm−1 was considered to be the –CH3 rocking modes of the methoxy group and represented the Si–O–Si bond.24,26 Peaks at 1039, 900, and 667 cm−1 were assigned as the C–O stretching mixed with a small contribution of the Si–O stretching,20,24,27 originating from non-hydrolyzed CH3Si(OCH3)3. The peak at 777 cm−1 was the absorption peak of joint action resulting from the stretching vibration of Si–C and the rocking vibration of –CH3.24 The peak at 642 cm−1 was defined as the stretching vibration of the O–W–O in corner-sharing in WO3. The peak at 589 cm−1 corresponded to the stretching vibration of W–O–W in an edge-sharing structure of W3O13. The peak at 438 cm−1 was considered to be water vibrations in the tungsten oxide structure.7,25,28 Traditional references reported that peaks at 960 and 1005 cm−1 were defined as W![[double bond, length as m-dash]](https://www.rsc.org/images/entities/char_e001.gif) O terminal stretching,29 and 809 and 874 cm−1 corresponded to stretching vibrations of W–O–W in an edge-sharing structure of W3O13. However, these peaks did not obviously exist. It was speculated that the peak for silicon at 960 cm−1 was covered by the C–O stretching mixed with a contribution of the Si–O stretching due to the wide range of silicon bonds. Moreover, silicon bonds showed stronger and sharper absorptions with the increasing quantities of silicon in WO3–MTMS compound films. In addition, the peaks at 809 and 874 cm−1 were relatively weaker and submerged between the range 777 and 900 cm−1.7
O terminal stretching,29 and 809 and 874 cm−1 corresponded to stretching vibrations of W–O–W in an edge-sharing structure of W3O13. However, these peaks did not obviously exist. It was speculated that the peak for silicon at 960 cm−1 was covered by the C–O stretching mixed with a contribution of the Si–O stretching due to the wide range of silicon bonds. Moreover, silicon bonds showed stronger and sharper absorptions with the increasing quantities of silicon in WO3–MTMS compound films. In addition, the peaks at 809 and 874 cm−1 were relatively weaker and submerged between the range 777 and 900 cm−1.7
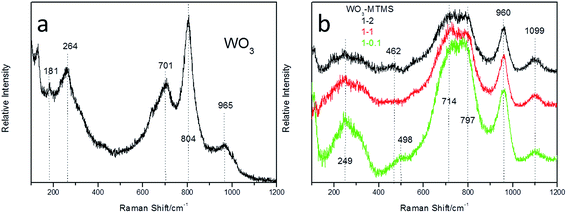
Fig. 2 shows the Raman shifts of WO3 and WO3–MTMS. From Fig. 2(a), basic characteristic peaks of tungsten oxide are shown. The peak at 965 cm−1 was defined as W![[double bond, length as m-dash]](https://www.rsc.org/images/entities/char_e001.gif) O terminal stretching, 804 cm−1 belonged to the W–O stretching mode, 701 and 264 cm−1 were due to vibrational bonds of O–W–O, and a weak peak at 181 cm−1 was considered as the lattice mode of tungsten oxide. As shown in Fig. 2(b), the peak at 1099 cm−1 and the peaks in the range between 714 and 797 cm−1 were considered to be the combined result of stretching and rocking vibrations of Si–C. The peak near the 960 cm−1 band was defined as a W
O terminal stretching, 804 cm−1 belonged to the W–O stretching mode, 701 and 264 cm−1 were due to vibrational bonds of O–W–O, and a weak peak at 181 cm−1 was considered as the lattice mode of tungsten oxide. As shown in Fig. 2(b), the peak at 1099 cm−1 and the peaks in the range between 714 and 797 cm−1 were considered to be the combined result of stretching and rocking vibrations of Si–C. The peak near the 960 cm−1 band was defined as a W![[double bond, length as m-dash]](https://www.rsc.org/images/entities/char_e001.gif) O terminal stretching peak. The peak at 498 cm−1 was reported as the vibration of O–W–O, 462 cm−1 was due to water vibration in the WO3·2H2O structure, and 249 cm−1 represented the stretching vibration of W–O–W. The Pd–Cl characteristic bond was covered by a range of strong peaks for the stretching vibration of W–O–W, according to previous studies.7,28,30
O terminal stretching peak. The peak at 498 cm−1 was reported as the vibration of O–W–O, 462 cm−1 was due to water vibration in the WO3·2H2O structure, and 249 cm−1 represented the stretching vibration of W–O–W. The Pd–Cl characteristic bond was covered by a range of strong peaks for the stretching vibration of W–O–W, according to previous studies.7,28,30
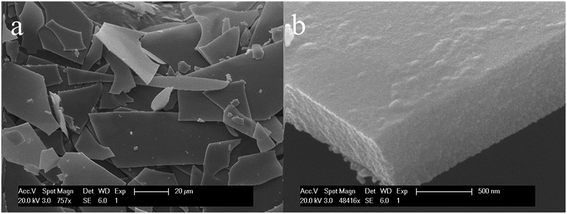
Fig. 3 shows the fragments of the compound film of WO3–TEOS. The fragments originated from the cracks of WO3–TEOS compound films after coloring-bleaching cycles. On the other hand, Fig. 3(b) shows that the fragment films of WO3–TEOS have a relative flat surface and compact composition, and the thickness of the film is nearly 500 nm. The cross-section of the WO3–TEOS film was very smooth and the cut was tidy. In the dip-coating process, WO3–TEOS mixed sols were diluted, and the coating solution was placed on an upward moving glass slide (size of 15 mm × 80 mm and thickness of 1.2 mm) as the substrate, being withdrawn above the top surface of the coating solution. The solvent evaporation concentrated the inorganic species in the entrained solution, and a homogeneous gel film was formed. In this study, the solvent mixture of the coating solution consisted of WO3, TEOS hydrolysate products, ethanol, and a small amount of water. It was expected that most volatile ethanol preferentially evaporated, and then, water evaporated from the entrained solution upon dipping, leaving WO3 and TEOS hydrolysate products. Thus, thin compound films of WO3–TEOS were formed.
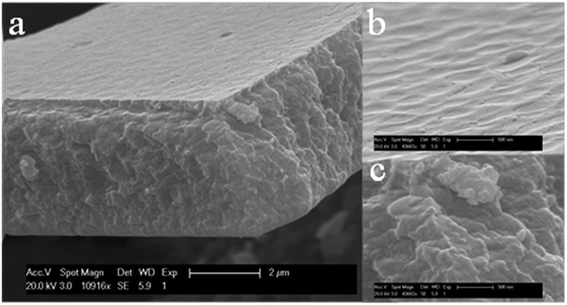
The compound film of WO3–MTMS had a bumpy surface and a thickness of nearly 3 μm, as shown in Fig. 4(a) and (b). The concave range was about 300–400 nm in length. Raised points were linked as shown in Fig. 4(b). In the cross section of Fig. 4(c), it was obviously seen that the small composed grains were reunited to be larger. The concave range was similar to the grain's range. During the stirring time, after MTMS was added to WO3 sol, ice-cooling was necessary to slow down the gel process because MTMS hydrolysis was sensitive to temperature. The mixed sols became sticky even at low temperatures. Sols became stickier as the temperature increased and even gelled to a certain extent. In the dip-coating process, a sticky mixed solution was slowly withdrawn above the top surface of the coating solution. Thus, sticky extent was one possible reason to form thicker films. The temperature requirement of the WO3–TEOS mixed sol was not as strict as that of WO3–MTMS during stirring, which depended on the hydrolysis process and products. The different treatment ways always existed in silicon aerogel preparation.
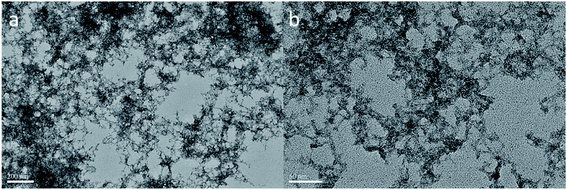
The morphology of the WO3–TEOS compound sol was determined by TEM. Images showed that an obvious network was chained in the sols, as shown in Fig. 5. The micro-shape of pure the WO3 sol was network-like with thin skeleton structures, and this was basic the requirement to meet hydrogen molecular transmission in gasochromic process. TEOS hydrolyzed under the acidic conditions of WO3, and a cross-linked structure formed with a thicker skeleton than that of WO3. Thus, tungsten and silicon structures crossed each other via bonding. Intersecting gaps of networks came into micro holes to satisfy the diffusion of gas. Layers of networks overlapped and formed the entire film, as shown in Fig. 5(a). A similar network was found on a smaller scale, as shown in Fig. 5(b). These results showed that added silicon source dispersed WO3 well and provided a stable structure to WO3.
Silicon and tungsten elements were also uniformly distributed in a network structure (Fig. 6). A selected area of the WO3–TEOS structure was linked and gathered. Mapping images showed that the compositions of tungsten and silicon were uniformly distributed, which was in agreement with the results shown in Fig. 5.
 | ||
| Fig. 6 The TEM image of WO3–TEOS and corresponding elemental mapping images of silicon and tungsten. | ||
Fig. 7 shows the TEM image of the WO3![[thin space (1/6-em)]](https://www.rsc.org/images/entities/char_2009.gif) :
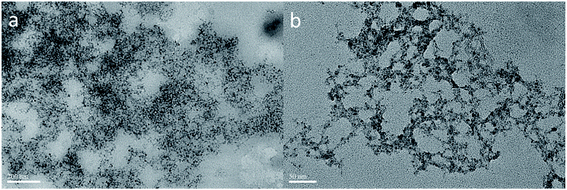
:![[thin space (1/6-em)]](https://www.rsc.org/images/entities/char_2009.gif) MTMS compound sol. An obvious network was also formed on a gray area in the sols with a scale of 200 nm. The hydrolysis speed of MTMS under the acid conditions of WO3 was faster, and the reaction was more violent than that of TEOS in WO3. Therefore, ice-cooling was needed, and sticky sols were obtained. A cross-linked structure formed with a thicker skeleton than that of WO3–TEOS, as shown in Fig. 7(a). The network was attached to the gray area, and the thickness of gray substrates was inhomogeneous. Fig. 7(b) shows a thinner network skeleton on a smaller scale. Compared to Fig. 5(b), herein, the micro-skeleton structure of WO3–MTMS was more uniform than that of WO3–TEOS. As one kind of silicon precursor, MTMS hydrolysis products maintained well-linked silicon shapes. Thus, tungsten and silicon links crossed each other and formed more stable structures.
MTMS compound sol. An obvious network was also formed on a gray area in the sols with a scale of 200 nm. The hydrolysis speed of MTMS under the acid conditions of WO3 was faster, and the reaction was more violent than that of TEOS in WO3. Therefore, ice-cooling was needed, and sticky sols were obtained. A cross-linked structure formed with a thicker skeleton than that of WO3–TEOS, as shown in Fig. 7(a). The network was attached to the gray area, and the thickness of gray substrates was inhomogeneous. Fig. 7(b) shows a thinner network skeleton on a smaller scale. Compared to Fig. 5(b), herein, the micro-skeleton structure of WO3–MTMS was more uniform than that of WO3–TEOS. As one kind of silicon precursor, MTMS hydrolysis products maintained well-linked silicon shapes. Thus, tungsten and silicon links crossed each other and formed more stable structures.
To identify the elements of the network, mapping images, as shown in Fig. 8, were obtained for the circular area shown in Fig. 7. Silicon and tungsten elements were uniformly distributed in the network structures and also in dispersed surroundings. Besides the circular area, silicon and tungsten compositions were also seen, which demonstrated that there were silicon elements in the abovementioned gray area.
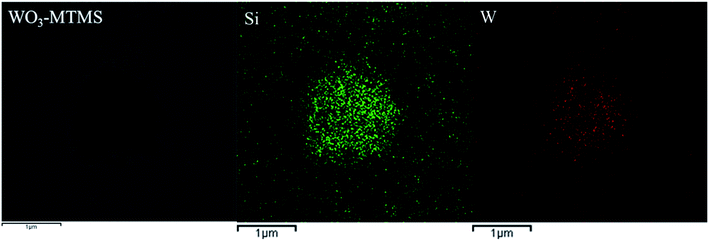 | ||
| Fig. 8 The TEM image of WO3–MTMS and corresponding elemental mapping images of silicon and tungsten. | ||
4 Gasochromic properties
WO3, with a catalyst film, had a good performance in gasochromics as an excellent semiconductor material. However, gasochromic properties require a coloring-bleaching response, coloring transmittance depth, and cycle durability. Fig. 9 shows the gasochromic properties of WO3 with a catalyst under the wavelength of 1000 nm via the UV spectra. The coloring-bleaching response time depended on the catalyst, microstructure, bonding structure, and so on.4,7,9,18 The significant property index was coloring transmittance depth, and thicken the film was a solution to increase the depth gap. However, the durability of coloring-bleaching cycles was not good, as shown in Fig. 9(a). It was seen that the coloring and bleaching speed (transmittance change) became lower over time, as shown in Fig. 9(b). As abovementioned, pure WO3 films were thin skeleton structures, and the path of hydrogen gas was always blocked. In recent years, WO3-based compound films have been studied.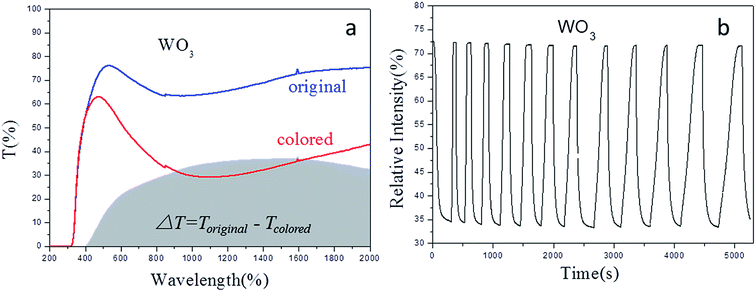 | ||
| Fig. 9 Gasochromic properties of compound films of WO3 (a) full wavelength transmission in original and colored states; (b) cycles of coloring-bleaching. | ||
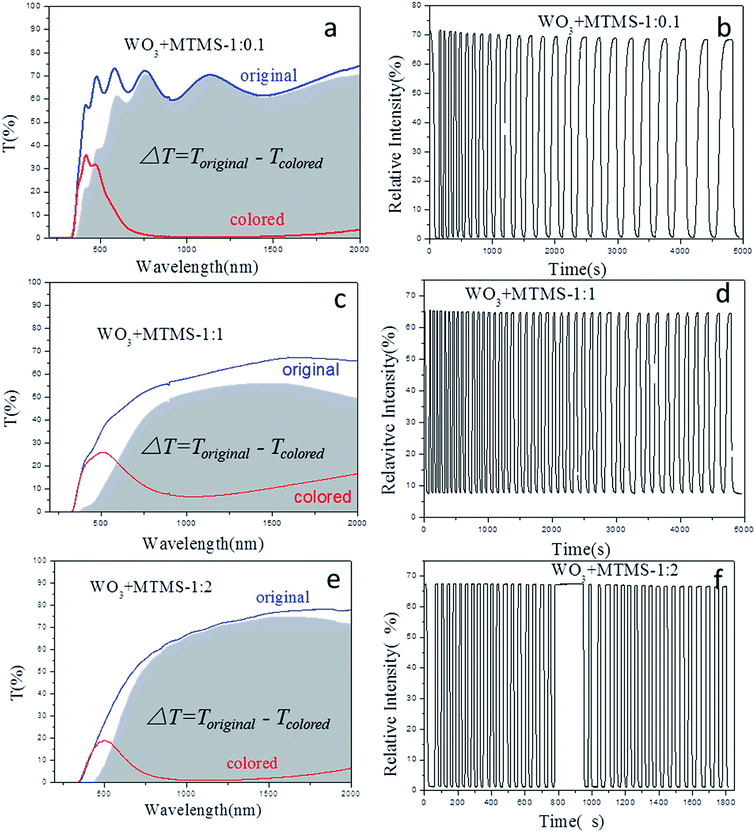
Fig. 10 shows the gasochromic properties of the compound films with series ratio under the same conditions as those of the WO3 film. As Fig. 10(a) and (b) showed, they were the full length transmittance and time-responding properties of WO3–MTMS compound film with the ratio 1![[thin space (1/6-em)]](https://www.rsc.org/images/entities/char_2009.gif) :
:![[thin space (1/6-em)]](https://www.rsc.org/images/entities/char_2009.gif) 0.1. The transmittance in the original state was about 60% with the light source at 1000 nm (the baseline correction was 100% in air). However, the colored state was nearly 0%. It was caused by the addition of MTMS to increase the film depth. The cycling was not stable, and the coloring-bleaching speed obviously reduced. Fig. 10(c) and (d) show the gasochromic property of the WO3–MTMS compound film with the ratio 1
0.1. The transmittance in the original state was about 60% with the light source at 1000 nm (the baseline correction was 100% in air). However, the colored state was nearly 0%. It was caused by the addition of MTMS to increase the film depth. The cycling was not stable, and the coloring-bleaching speed obviously reduced. Fig. 10(c) and (d) show the gasochromic property of the WO3–MTMS compound film with the ratio 1![[thin space (1/6-em)]](https://www.rsc.org/images/entities/char_2009.gif) :
:![[thin space (1/6-em)]](https://www.rsc.org/images/entities/char_2009.gif) 1. Transmittance states were different from the ratio of 1
1. Transmittance states were different from the ratio of 1![[thin space (1/6-em)]](https://www.rsc.org/images/entities/char_2009.gif) :
:![[thin space (1/6-em)]](https://www.rsc.org/images/entities/char_2009.gif) 0.1 as shown in Fig. 10(c). The transmittance of the original state increased as the wavelength increased, but the colored state maintained a peak at nearly 500 nm. The transmittance between 900 and 1200 nm was lower than 2%. Fig. 10(d) shows the time-response of the coloring-bleaching process for the WO3–MTMS compound film with the ratio 1
0.1 as shown in Fig. 10(c). The transmittance of the original state increased as the wavelength increased, but the colored state maintained a peak at nearly 500 nm. The transmittance between 900 and 1200 nm was lower than 2%. Fig. 10(d) shows the time-response of the coloring-bleaching process for the WO3–MTMS compound film with the ratio 1![[thin space (1/6-em)]](https://www.rsc.org/images/entities/char_2009.gif) :
:![[thin space (1/6-em)]](https://www.rsc.org/images/entities/char_2009.gif) 1. The original and bleaching transmittance was about 65%. The stable colored state transmittance reached 8%. The number of cycles was 24 in 5000 s. The latter part in Fig. 10(d) shows the reduction of coloring-bleaching speed. Fig. 10(e) and (f) show the properties of WO3–MTMS at a ratio of 1
1. The original and bleaching transmittance was about 65%. The stable colored state transmittance reached 8%. The number of cycles was 24 in 5000 s. The latter part in Fig. 10(d) shows the reduction of coloring-bleaching speed. Fig. 10(e) and (f) show the properties of WO3–MTMS at a ratio of 1![[thin space (1/6-em)]](https://www.rsc.org/images/entities/char_2009.gif) :
:![[thin space (1/6-em)]](https://www.rsc.org/images/entities/char_2009.gif) 2. The original transmittance was about 67.5%. The first hydrogen-sensing reaction was fast in 2–5 s with the transmittance reaching 2%. The bleaching transmittance change was 65% up in 1–2 s, and the state showed a static recycle. The coloring depth was nearly 97%, compared the original state to coloring state of the film. The increase of MTMS amount acted more advanced properties of gasochromics including stable coloring-bleaching cycles and coloring depth.
2. The original transmittance was about 67.5%. The first hydrogen-sensing reaction was fast in 2–5 s with the transmittance reaching 2%. The bleaching transmittance change was 65% up in 1–2 s, and the state showed a static recycle. The coloring depth was nearly 97%, compared the original state to coloring state of the film. The increase of MTMS amount acted more advanced properties of gasochromics including stable coloring-bleaching cycles and coloring depth.
As a comparison, the WO3–TEOS compound film was synthesized to determine the gasochromic property, as shown in Fig. 11. The transmittance gap achieved was 45%, and the coloring-bleaching cycle number was more than 30 in 5000 s. There was no obvious reduction in the coloring-bleaching speed and circulation stability; this showed that the addition of TEOS provided effective SiO2 constituent and strengthen gasochromic property of WO3-based films.
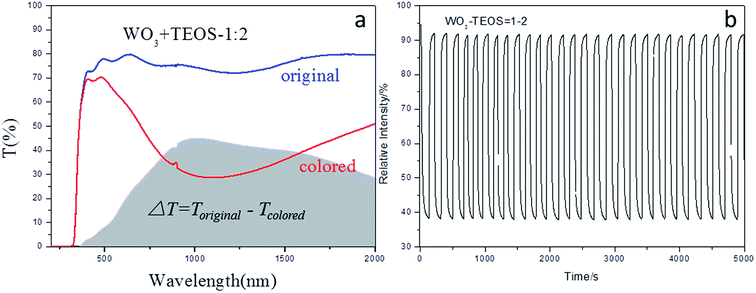 | ||
| Fig. 11 Gasochromic properties of compound films of WO3–TEOS (a) full wavelength transmission in original and colored states; (b) cycles of coloring-bleaching. | ||
5 Discussion
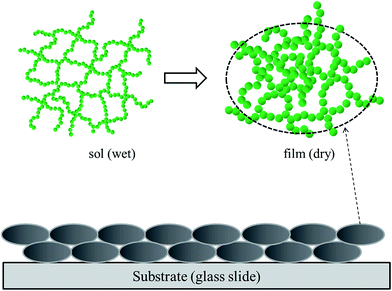
At room temperature, hydrolysis of MTMS can lead to the quick formation of its gel. Thus, MTMS was kept at low temperatures, as stated in part 2.1. MTMS is an outstanding precursor to synthesize, but it is not conductive to form a uniform film. The WO3–MTMS compound films were thicker, based on several evidences. The raw solution of MTMS was oil-like and hydrolyzed violently. Then, the viscosity of sol was increased. After the general dip-coating process, a thick homogeneous gel film was synthesized. As shown in Fig. 12, the schematic explains the formation of WO3–MTMS. Cross-linked structures of WO3–MTMS were dispersed by ethanol, and the widths could be kept between 20 and 30 nm. Links of WO3–MTMS became clusters during drying. Thus, stable, thick films were synthesized.The significant difference between WO3–MTMS and WO3–TEOS was the presence of a methyl group. Anti-reflective membranes are usually made using TEOS as a precursor. The ammonization process was needed to increase methyl groups to enhance the hydrophobic properties.
TEOS was a silicon source that supported the microstructure to promote the WO3-based film in coloring-bleaching response and cycles. Hundreds of cycles were achieved, and the colored transmittance reached more than 50%, but with serious cracking. Due to the nanoscale size and large specific surface area, nanochains contained many polarized hydroxyls on their surfaces and exhibited high activity for the TEOS hydrolysis. In addition, these active polarized hydroxyls and ethanol vapor molecules would incorporate easily, thus producing a highly compressive capillary stress within the nanochains. During the drying process, ethanol volatized and caused the film to shrink. Heating accelerated the reduction of hydroxyls, and shrinkage became evident. Moreover, heat treatment would produce considerable thermal expansion from the solid substrate, and the expansion would supply sol–gel coating a gradient strain, which gradually decreased from the substrate to the coating surface.31 The gasochromic process is a redox reaction to produce H2O. MTMS provided a methyl group to balance –OH in the film structures and restrain the shrinkage of the film. The films without any cracking were formed.
MTMS and TEOS were precursor choices to prepare a silicon aerogel. The structure of the silicon skeleton assisted WO3 to form a special network, and provided fluent paths to hydrogen gas. Water produced via the coloring-bleaching process could be driven from internal. Hence, the compound films of WO3–MTMS acted as well as WO3–TEOS.
During the experiments, it was found that the mixed sol of WO3–MTMS had a good film-forming ability on B270, which was one kind of silicon substrate, but the latter could only form a film on ordinary glass slides. The organic bonds existing on Si–CH3, which is non-hydrolyzable, and raiment could stick on the surface of B270, but the WO3–TEOS could not act well. Because of the methyl group, the films were thicker, and the transmittance of bleaching status was lower than that of WO3–TEOS.
6 Conclusions
The study introduced a novel silicon source to mix WO3 sols, and the compound films displayed excellent gasochromic properties in coloring-bleaching recycling with a deep coloring-depth rate of 97%. The compound films were thick (3 μm) with no-cracking. FT-IR showed the existence of –CH3, which was derived from the MTMS-hydrolyzed products. Raman spectra demonstrated the intrinsic peaks of tungsten oxide and silicon oxide. Element analysis revealed that tungsten and silicon were homogeneously distributed. Due to the reaction conditions and hydrolysis properties of MTMS, the film was thicker and lower original transmittance difference than WO3–TEOS. Existence of methyl groups restricted the film shrinkage caused by –OH, and the films acted no-cracking. The outstanding properties of WO3–MTMS broadened the attacking substrate choices such as B270.Acknowledgements
The authors gratefully acknowledge the financial support received from the Fundamental Research Funds for the Central Universities, the Shanghai Committee of Science and Technology (13JC1408700) and the National Natural Science Foundation of China (51472182, 51272179, 11404213 and U1503292).References
- H. Yuping and W. Zhenyu, et al., Chem. Mater., 2003, 15, 4039 CrossRef.
- S. M. A. Durrani and E. E. Khawaja, Sol. Energy Mater. Sol. Cells, 2002, 71, 313 CrossRef CAS.
- M. A. Habib and S. P. Maheswarf, J. Appl. Electrochem., 1993, 23, 44 CrossRef CAS.
- A. Georg, W. Graf and R. Neumann, et al., Sol. Energy Mater. Sol. Cells, 2000, 63, 165 CrossRef CAS.
- S. J. Ippolito and S. Kandasamy, Sens. Actuators, B, 2005, 108, 154 CrossRef CAS.
- Y. Miseki and H. Kusama, J. Phys. Chem. Lett., 2010, 1, 1196 CrossRef CAS.
- A. Georg, W. Graf, R. Neumann and V. Wittwer, Solid State Ionics, 2000, 127, 319–328 CrossRef CAS.
- H. A. Therese, J. Li, U. Kolbb and W. Tremel, Solid State Sci., 2005, 7, 67 CrossRef CAS.
- K. A. Gesheva, T. Ivanova, B. Marsen, B. Cole, E. L. Miller and F. Hamelmann, Surf. Coat. Technol., 2007, 201, 9378 CrossRef CAS.
- F. Paraguay-Delgado, Y. Verde, E. Cizniega, J. A. Lumbreras and G. Alonso-Nuñez, J. Nanosci. Nanotechnol., 2008, 8, 6445 CrossRef CAS PubMed.
- T. Ivanova, K. A. Gesheva, M. Kalitzova, F. Hamelmann, F. Luekermann and U. Heinzmann, J. Optoelectron. Adv. M., 2009, 11, 1513 CAS.
- Z. Zhang, G. Wu, G. Gao, J. Wu and W. Feng, Proc. SPIE, 2010, 7995, 79951O CrossRef.
- B. Orel, U. Lavrencicstangar and M. G. Hutchins, et al., J. Non-Cryst. Solids, 1994, 175, 251 CrossRef CAS.
- F. Wei, G. M. Wu, G. H. Gao, Z. H. Zhang, J. D. Wu and X. W. Zhou, Rare Met. Mater. Eng., 2012, 41(S3), 627 Search PubMed.
- C. Zhao, H. Tao, F. Peng, R. Pan and X. Zhao, J. Sol-Gel Sci. Technol., 2016, 78, 582 CrossRef CAS.
- D. Saygin-Hinczewski, M. Hinczewski, I. Sorar, F. Z. Tepehan and G. G. Tepehan, Sol. Energy Mater. Sol. Cells, 2008, 92, 821 CrossRef CAS.
- F. Wei, Wu G. ming, G. Guohua and Z. Zenghai, Chin. J. Vac. Sci. Technol., 2012, 8, 688 Search PubMed.
- G. Gao, J. Wu, G. Wu, Z. Zhang, W. Feng, J. Shen and B. Zhou, Sens. Actuators, B, 2012, 171–172, 1288 CrossRef CAS.
- H. Kaper, I. Djerdj, S. Gross, H. Amenitsch, M. Antoniettia and B. M. Smarsly, Phys. Chem. Chem. Phys., 2015, 17, 18138 RSC.
- S. Yun, H. Luo and Y. Gao, RSC Adv., 2014, 4, 4535 RSC.
- P. Yan, B. Zhou and A. Du, RSC Adv., 2014, 4, 58252 RSC.
- T. F. Tenisheva, A. N. Lazarevl and R. I. Uspenskaya, J. Mol. Struct., 1977, 37, 173 CrossRef CAS.
- B. Orel, U. Opara Krasovec and N. Groselj, J. Sol-Gel Sci. Technol., 1999, 14, 291 CrossRef CAS.
- M. Montejo, F. Partal Urena, F. Márquez, I. S. Ignatyev and J. J. Lopez Gonzalez, J. Mol. Struct., 2005, 744–747, 331–338 CrossRef CAS.
- M. F. Daniel, B. Desbat and J. C. Lassegues, J. Solid State Chem., 1987, 67, 235–247 CrossRef CAS.
- S. D. Bhagat, C.-S. Oh, Y.-H. Kim, Y.-S. Ahn and J.-G. Yeo, Microporous Mesoporous Mater., 2007, 100, 350–355 CrossRef CAS.
- N. Boris Orel, U. Groselj, O. Krasovec and R. Jese, J. Sol-Gel Sci. Technol., 2002, 24, 5–22 CrossRef.
- U. Opara Krasovec, B. Orel, A. Georg and V. Wittwer, Sol. Energy, 2000, 68(6), 541–551 CrossRef.
- M. Zayat, R. Reisfeld and H. Minti, J. Sol-Gel Sci. Technol., 1998, 11, 161–168 CrossRef CAS.
- B. Orel, N. Groselj, U. Opara Krasovec, M. Gabrscek, P. Bukovec and R. Reisfeld, Sens. Actuators, B, 1998, 50, 234–245 CrossRef CAS.
- S. Kumon, K. Nakanishi and K. Hirao, J. Sol-Gel Sci. Technol., 2000, 19, 553–557 CrossRef CAS.
| This journal is © The Royal Society of Chemistry 2017 |

