 Open Access Article
Creative Commons Attribution 3.0 Unported Licence
Adsorption behavior of the copolymer AM/DMC/APEG/DMAAC-16 on a carbonate rock and its application for acidizing†
Hongping Quanab,
Zhonghao Chenab,
Yang Wu *ab and
Zhuoke Liab
aCollege of Chemistry and Chemical Engineering, Southwest Petroleum University, No. 8 Xindu Road, Chengdu 610500, P. R. China. E-mail: wuyang1119@hotmail.com; Fax: +86-28-83037305; Tel: +86-28-83037305
bOil & Gas Field Applied Chemistry Key Laboratory of Sichuan Province, Southwest Petroleum University, Chengdu, P. R. China
First published on 21st June 2017
Abstract
In this study, a quadripolymer of acrylamide (AM), [2-(methacryloyloxy)ethyl]-trimethylammonium chloride (DMC), allyl polyethylene glycol (APEG), and hexadecyl trimethyl allylammonium chloride (DMAAC-16) was designed and synthesized, which was named PADAD. The molecular structure of PADAD was characterized by Fourier transform infrared (FT-IR) and nuclear magnetic resonance (1H-NMR) spectroscopy. The molecular weight and the dispersion exponent of PADAD were determined by gel permeation chromatography (GPC). The adsorption behavior of PADAD on a carbonate rock surface was investigated. The kinetic model of PADAD on a carbonate rock surface was found to fit the pseudo-second-order kinetic model. The adsorption isotherm model of PADAD on the surface of a carbonate rock fitted with the Freundlich model. Addition of PADAD into 20% HCl obviously reduced the rate of the acid rock reaction. We analyzed the microstructure of the rock surface by scanning electron microscopy (SEM) and found that an adsorption film appeared on the rock surface due to PADAD, which could reduce the contact of acid with the rock surface.
Introduction
Due to the fact that long chain alkyl and other lipophilic groups can associate in water, introduction of hydrophobic groups into hydrophilic polymers will change the adsorption behavior of the original polymers.1–3 Commonly, water-soluble polymers, such as polyacrylamide, can form a monolayer upon adsorption.However, polymers with a hydrophobic group could present adsorption of a multilayer. Since hydrophobic association existed between molecules, the polymer could be adsorbed on the already formed adsorption layer.4–6 Recently, hydrophobic associating polymers have been widely used in oilfield applications, such as acidizing treatments,7,8 drilling and completion fluids, and polymer flooding.9–12 In oilfield applications, the hydrophobic associating polymer is adsorbed on the reservoir for the interaction of the polymer and the reservoir, which may have some effect on the reservoir. The adsorption behavior of hydrophobic associating polymers has attracted significant attention from many researchers. Some researchers have researched the adsorption behavior of these polymers on clay particles and silica sand.5,13 However, the study on the adsorption behavior between hydrophobic associative polymers and carbonates has not yet been perfected, especially the study of the adsorption capacity and adsorption rate. Therefore, the study on the adsorption behavior of hydrophobic associative polymers on carbonate rocks was very important, which could provide a theoretical basis for the practical application of hydrophobic associative polymers in oil and gas exploration.
In our study, a quadripolymer, PADAD, was synthesized using acrylamide (AM), [2-(methacryloyloxy) ethyl]-trimethylammonium chloride (DMC), allyl polyethylene glycol (APEG), and hexadecyl trimethyl allylammonium chloride (DMAAC-16) through free radical polymerization. The aim of this study was to research the adsorption behavior, including the effect of external factors, the adsorption isotherm model, and the kinetic model, of PADAD on a carbonate rock. Through this research, we could provide theoretical support for PADAD applications in the future.
Experimental
Materials
Chemically pure AM, DMC, and 2,2′-azobis[2-methylpropionamidine]dihydrochloride (AIBA) were produced by Chengdu Chang-zheng Glass Co., Ltd. (China). Industrial grade APEG-1000 was produced by Jiangsu Hai-an Petrochemical Factory (China). Industrial grade DMAAC-16 was produced by Jiangsu Fu-Miao Technology Co., Ltd. (China).Synthesis
In this experiment, the n(AM)![[thin space (1/6-em)]](https://www.rsc.org/images/entities/char_2009.gif) :
:![[thin space (1/6-em)]](https://www.rsc.org/images/entities/char_2009.gif) n(APEG)
n(APEG)![[thin space (1/6-em)]](https://www.rsc.org/images/entities/char_2009.gif) :
:![[thin space (1/6-em)]](https://www.rsc.org/images/entities/char_2009.gif) n(DMC)
n(DMC)![[thin space (1/6-em)]](https://www.rsc.org/images/entities/char_2009.gif) :
:![[thin space (1/6-em)]](https://www.rsc.org/images/entities/char_2009.gif) n(DMAAC-16) ratio was 20.00
n(DMAAC-16) ratio was 20.00![[thin space (1/6-em)]](https://www.rsc.org/images/entities/char_2009.gif) :
:![[thin space (1/6-em)]](https://www.rsc.org/images/entities/char_2009.gif) 1.00
1.00![[thin space (1/6-em)]](https://www.rsc.org/images/entities/char_2009.gif) :
:![[thin space (1/6-em)]](https://www.rsc.org/images/entities/char_2009.gif) 4.00
4.00![[thin space (1/6-em)]](https://www.rsc.org/images/entities/char_2009.gif) :
:![[thin space (1/6-em)]](https://www.rsc.org/images/entities/char_2009.gif) 0.14.
0.14.
First, 5 g (0.07 mol) AM was dissolved in 27.18 g (1.51 mol) deionized water in a three-necked flask. Second, 0.16 g (0.0005 mol) DMAAC-16, 3.52 g (0.0035 mol) APEG, and 2.92 g (0.014 mol) DMC were transferred into the previous solution and stirred until the mixed solution was completely dissolved. Third, the solution was bubbled with N2 for 30 minutes, and then, 0.0223 g of initiator (AIBA) was added into the solution. The reaction lasted 6 h at 60 °C, and a crude product was obtained.
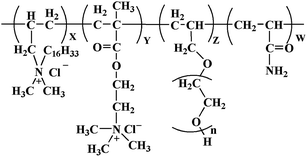
The crude product was purified by ethanol and then dried in a vacuum drying oven at 40 °C. The molecular structure of PADAD is displayed in Scheme 1.
Characterization
The determination of the molecular weight and the distribution of PADAD were tested by GPC (Waters e2695, USA). PADAD was dissolved into a sodium nitrate solution (0.1 mol L−1), and the concentration of PADAD was 2 mg mL−1.Through mixing the PADAD and KBr powder together and squashing by a tablet machine, the samples were obtained and then measured via FTIR (WQF-520, Beijing Beifen-Ruili Analytical Instrument (Group) Co., Ltd, China) in the range between 4000 and 500 cm−1.
PADAD was dissolved in D2O, and then, the structural characterization of the PADAD was carried out by 1H-NMR (Bruker-400, Bruker, Germany).
The change in micro-morphology of a carbonate rock was observed during the process of acid treatment via scanning electron microscopy (JSM7500F, Japan).
Adsorption measurements
The depletion method was used to determine the adsorption of PADAD on a carbonate rock.13 Rock particles were added to different concentrations of PADAD solution and oscillated by a constant temperature oscillator under different experimental conditions until adsorption equilibrium was reached. Through the difference in the concentrations of PADAD in the initial and final solutions, the adsorption of PADAD was obtained. The concentration of PADAD in different solutions was measured by a total organic carbon analyzer (TOC-VCPH, Shimadzu Corporation, Japan). During the measurement of adsorption, the solid/liquid weight ratio (S/L) was 0.1.In the adsorption isotherm experiments, we researched the adsorption state and strength of PADAD on a carbonate rock. The volume of the PADAD solution was 20 mL, and the mass of the carbonate particles was 2 g. We determined the equilibrium adsorption capacity of PADAD of different initial concentrations at the same temperature. The initial concentration of PADAD ranged from 1000 mg L−1 to 12![[thin space (1/6-em)]](https://www.rsc.org/images/entities/char_2009.gif) 000 mg L−1, and the experimental temperature was 30 °C, 50 °C, and 70 °C.
000 mg L−1, and the experimental temperature was 30 °C, 50 °C, and 70 °C.
In the adsorption kinetics experiments, we first researched the effect of oscillating time on the adsorption of PADAD. The volume of the PADAD solution was 20 mL, and the mass of the carbonate particles was 2 g. We calculated the adsorption of PADAD every 5 minutes until the adsorption reached equilibrium; the initial concentrations of PADAD were 3000 mg L−1, 5000 mg L−1, 7000 mg L−1, and 9000 mg L−1 at 30 °C.
Moreover, we also researched the effect of temperature on the adsorption of PADAD. The volume of the PADAD solution was 20 mL, and the mass of the carbonate particles was 2 g. We calculated the adsorption of PADAD every 5 minutes until the adsorption reached equilibrium. The initial concentration of PADAD was 7000 mg L−1 and the experimental temperatures were 30 °C, 50 °C, and 70 °C.
Retarding capability test of PADAD
Different masses of PADAD were added to 20% HCl, and the resulting solution was named PADAD acid. The retarding capability of PADAD was determined by the reaction rate of carbonate and PADAD acid. The experimental temperature was 30 °C, and the reaction area was 5 cm2. The reaction rate was tested and calculated according to literature.8Results and discussion
Characterization of PADAD
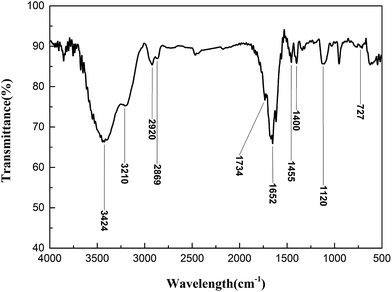
The synthesized sample was analyzed by FT-IR after purification, and the result is displayed in Fig. 1.As shown in Fig. 1, there is a peak at 3424 cm−1 attributed to the stretching vibration peak of N–H. The peak at 3210 cm−1 illustrated that a hydroxyl group existed in PADAD. The peaks at 2920 cm−1 and 2869 cm−1 are the stretching vibrations of C–H from methyl and methylene, respectively. The peak at 1734 cm−1 indicates that the carbonyl group from DMC exists in PADAD. The peak at 1652 cm−1 indicates that the carbonyl group from AM exists in PADAD. The peak at 1455 cm−1 is the bending vibration peaks of C–H. The peak at 1400 cm−1 illustrates that C–N from the amide group exists in PADAD. The peak at 1120 cm−1 illustrates that the ether bond from APEG exists in PADAD. The peak at 727 cm−1 illustrates that (CH2)15 from DMAAC-16 exists in PADAD.
The molecular weight of PADAD and its distribution were tested, and the result is shown in Table 1.
| Mn | Mw | Polydispersity |
|---|---|---|
| 6.58 × 10⁴ | 1.22 × 10⁵ | 1.85 |
Table 1 shows that the weight average molecular weight (Mw) was 1.22 × 10⁵, and the number average molecular weight (Mn) was 6.58 × 10⁴. Thus, the molecular weight distribution coefficient is 1.85. These all meet the technical requirements for oilfield application.
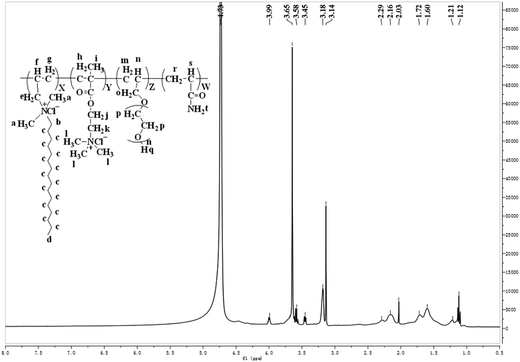
1H-NMR spectrum of PADAD is shown in Fig. 2.
1H-NMR (400 MHz, D2O): δ = 1.12(d, –CH3), δ = 1.21(g, h, i, m, r, –CH2–, –CH2–, –CH3, –CH2–, –CH2–), δ = 1.60(c, –(CH2)14–), δ = 1.72(n, –CH–CH2–O–), δ = 2.03(q, –OH), δ = 2.16(f, –N+–CH2–CH), δ = 2.29(s, –CH–(C![[double bond, length as m-dash]](https://www.rsc.org/images/entities/char_e001.gif) O)–NH2), δ = 3.14(e, –N+–CH2), δ = 3.18(b, –N+–CH2–C15H31), δ = 3.45(a, l, –N+–CH3), δ = 3.58(o, –CH2–O–(CH2–CH2–O)n–H), δ = 3.65(k, p, –N+–CH2–CH2–O–, –(CH2–CH2–O)n–H), δ = 3.99(j, (C
O)–NH2), δ = 3.14(e, –N+–CH2), δ = 3.18(b, –N+–CH2–C15H31), δ = 3.45(a, l, –N+–CH3), δ = 3.58(o, –CH2–O–(CH2–CH2–O)n–H), δ = 3.65(k, p, –N+–CH2–CH2–O–, –(CH2–CH2–O)n–H), δ = 3.99(j, (C![[double bond, length as m-dash]](https://www.rsc.org/images/entities/char_e001.gif) O)–O–CH2–).
O)–O–CH2–).
These features indicated that the obtained product was basically consistent with the designed molecule, which suggested that PADAD was successfully synthesized.
Adsorption isotherms
In general, the adsorption process of a polymer on a rock is controlled by intermolecular forces such as van der Waals interactions and electrostatic forces.14 The amount of polymer adsorbed on the surface of the carbonate rock was affected by temperature, salinity, and other external conditions. The adsorption isotherms are displayed in Fig. 3a.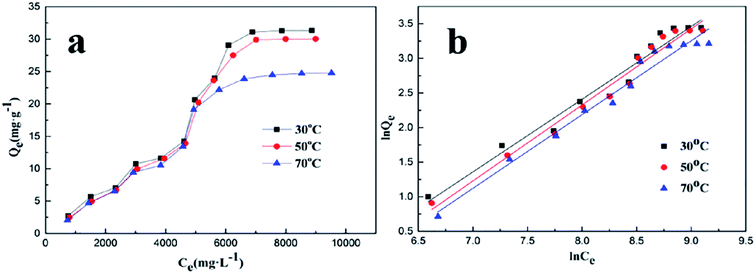 | ||
| Fig. 3 (a) The adsorption isotherms for PADAD adsorbed on a carbonate rock. (b) Freundlich isotherms for PADAD adsorbed on a carbonate rock. | ||
At present, there are many models that could be used to describe the adsorption isotherm model. The Langmuir model and Freundlich model are commonly used to fit the experimental data, which are beneficial to further understand the adsorption behavior.13,14 The saturated adsorption capacity was determined with an initial concentration of PADAD ranging from 1000 mg L−1 to 12![[thin space (1/6-em)]](https://www.rsc.org/images/entities/char_2009.gif) 000 mg L−1 at 30, 50, and 70 °C. The data obtained from the experiments were described by two models.
000 mg L−1 at 30, 50, and 70 °C. The data obtained from the experiments were described by two models.
Langmuir model:
In the abovementioned equation, Qe (mg g−1) and Ce (mg L−1) are the adsorption capacity and the residual concentrations of PADAD in the solution at equilibrium, respectively. Qm (mg g−1) is the maximum adsorption of PADAD in the solution at equilibrium; the Langmuir constant KL (L mg−1) can be used to describe a monolayer adsorption.15–17 Fig. S1† displays the Langmuir linear plots at 30, 50, and 70 °C. The parameters for the adsorption of PADAD onto a carbonate rock are shown in Table S1.†
Freundlich model:
In the abovementioned equation, Ce (mg L−1) and Qe (mg g−1) are the concentrations of PADAD in the liquid and solid phases, respectively, when the process of adsorption reaches equilibrium. The Freundlich constant KF is related to the adsorption state of the adsorbent, which can be used to describe a multilayer adsorption; n is the Freundlich constant, which is affected by temperature and can reflect the adsorption strength of the adsorbent.18 The Freundlich linear plots at different temperatures are displayed in Fig. 3b. The parameters for the adsorption of PADAD onto a carbonate rock are displayed in Table 2.
| Temperature (°C) | Freundlich equation | n | KF | R2 |
|---|---|---|---|---|
| 30 | y = 1.0507x − 5.9984 | 0.9517 | 0.0025 | 0.9664 |
| 50 | y = 1.0990x − 6.4638 | 0.9099 | 0.0016 | 0.9746 |
| 70 | y = 1.0660x − 6.3397 | 0.9381 | 0.0017 | 0.9734 |
As can be seen in Tables S1† and 2, the correlation of the curve (R2) of the Freundlich isotherm was obviously much better for PADAD than that of the Langmuir isotherm, which indicated that the process of PADAD adsorption on a carbonate rock could be described by the Freundlich model. During the process of adsorption, extension instead of globosity was observed for PADAD, which means that PADAD can adsorb onto the carbonate directly using many segments within its structure. Moreover, PADAD can be adsorbed onto the previous adsorption layer by intermolecular association; thus, the adsorption of PADAD on the carbonate rock is multilayer adsorption. Furthermore, the process of adsorption was also involved in the dynamic process, which means that adsorption and desorption occurred at the same time.18,19
Adsorption kinetics
The kinetics study of the adsorption process was carried out to investigate the rate and mechanism of adsorption. Currently, there are many kinetic models that have been applied to study the kinetics of the adsorption process, and the pseudo-first-order and pseudo-second-order equation models are widely used.18,20The equation for the pseudo-first-order kinetic model is displayed below:
In the abovementioned equation, Qe,1 (mg g−1) is the theoretical capacity of equilibrium adsorption, Qt (mg g−1) is the adsorption capacity at time t, and k1 is the constant of the pseudo-first-order adsorption kinetic model that can reflect the adsorption rate.
In this equation, Qe,2 (mg g−1) is the theoretical capacity of equilibrium adsorption, Qt (mg g−1) is the adsorption capacity at time t, and k2 is the constant of the pseudo-first-order adsorption kinetic model that can reflect the adsorption rate.17,18
The curves for the adsorption kinetics at different PADAD concentrations on a carbonate rock are illustrated in Fig. 4a.
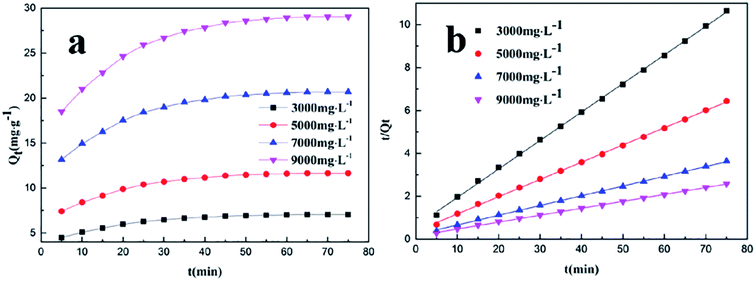 | ||
| Fig. 4 (a) Effect of the initial concentration on the adsorption of PADAD on a carbonate rock. (b) Pseudo-second-order equation for the adsorption kinetics of PADAD on a carbonate rock. | ||
As shown in Fig. 4a, the adsorption of PADAD on the surface of a carbonate rock increased with time, and the adsorption was saturated at 60 min. The adsorption process could be divided into the following two phases: fast adsorption and slow adsorption. Fast adsorption occurred during the first 60 min; then, the adsorption slowed down and reached saturation. The saturated adsorption capacity of PADAD on the carbonate rock increased with an increase in the initial concentration of PADAD.
The curves of the pseudo-first-order kinetic equations for the adsorption of PADAD on the carbonate rock at different concentrations are shown in Fig. S2,† and the parameters of the equations are illustrated in Table S2.† Moreover, the curves of the pseudo-second-order kinetic equation for the adsorption of PADAD on a carbonate rock at different concentrations are displayed in Fig. 4b, and the parameters of the equations are shown in Table 3.
| Initial concentration (mg L−1) | Qe (mg g−1) | Kinetic equation | R22 | Qe,2 (mg g−1) | k2 (mg g−1 min−1) |
|---|---|---|---|---|---|
| 3000 | 7.0494 | y = 0.1330x + 0.6107 | 0.9995 | 7.5188 | 0.0290 |
| 5000 | 11.6421 | y = 0.0805x + 0.3692 | 0.9995 | 12.4224 | 0.0176 |
| 7000 | 20.6587 | y = 0.0454x + 0.2050 | 0.9995 | 22.0264 | 0.0101 |
| 9000 | 29.0481 | y = 0.0323x + 0.1481 | 0.9995 | 30.9598 | 0.0070 |
From the parameters obtained through fitting of the kinetics data from Fig. S2† and 4b and the results displayed in Tables S2† and 3, it was observed that the pseudo-second-order kinetic model was obviously much fitter for the adsorption process than the pseudo-first-order kinetic mode according to the correlation coefficient (R2).
To further study the effect of temperature on the adsorption rate, the adsorption capacity of PADAD on the carbonate rock was investigated at various temperatures, with the results displayed in Fig. 5.
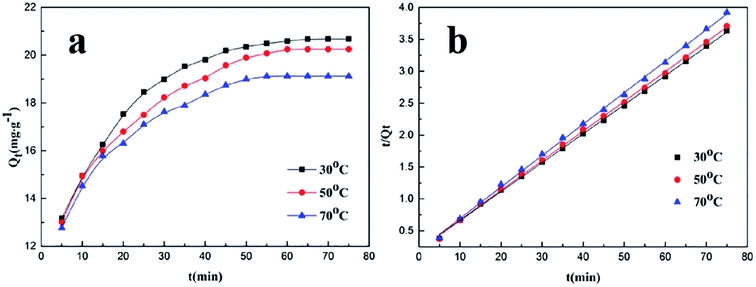 | ||
| Fig. 5 (a) Effect of temperature on the adsorption of PADAD on a carbonate rock. (b) Pseudo-second-order equation for the adsorption kinetics of PADAD on a carbonate rock at different temperatures. | ||
As seen in Fig. 5a, the adsorption capacity (Qt) decreased with the increasing adsorption temperature in the whole process. Moreover, along with the increasing adsorption temperature, the time to reach adsorption equilibrium was slightly shortened. The results indicate that temperature has a negative influence on the adsorption capacity and has a promoting effect on the adsorption rate.
The curves of the pseudo-first-order kinetic equation for the adsorption of PADAD on the carbonate rock at different temperatures are displayed in Fig. S3,† and the equation parameters are shown in Table S3.† Moreover, the curves of the pseudo-second-order kinetic equation for the adsorption of PADAD on the carbonate rock at different temperatures are shown in Fig. 5, and the parameters of the equations are illustrated in Table 4.
| Temperature (°C) | Qe (mg g−1) | Kinetic equation | R22 | Qe,2 (mg g−1) | k2 (mg g−1 min−1) |
|---|---|---|---|---|---|
| 30 | 20.6587 | y = 0.0454x + 0.2050 | 0.9995 | 22.03 | 1.01 × 10⁻² |
| 50 | 20.2566 | y = 0.0465x + 0.2043 | 0.9995 | 21.51 | 1.06 × 10⁻² |
| 70 | 19.1412 | y = 0.0493x + 0.2014 | 0.9994 | 20.28 | 1.21 × 10⁻² |
By analyzing the results of kinetic fitting shown in Fig S3† and 5b and the parameters displayed in Tables S3† and 4, it was found that the pseudo-second-order kinetic model was obviously much fitter for the adsorption process than the pseudo-first-order kinetic model at different temperatures according to the correlation coefficient (R2).
As can be seen in Table 4, with the increasing experimental temperature, the adsorption rate increased, but the capacity of equilibrium adsorption was obviously decreased. As abovementioned, the adsorption process of PADAD on the carbonate rock was dynamic, and the adsorption and desorption occurred at the same time. It means that temperature has a positive influence on both adsorption and desorption but the influence on desorption was larger than that on adsorption. All these results indicated that the adsorption of PADAD on the carbonate rock was a physical process, in which the time to reach equilibrium was shortened but the adsorption capacity was decreased.15
Retarding capability of PADAD
The retarding capability of PADAD was evaluated by the total volume of CO2 produced by the reaction of PADAD acid and carbonate and the reaction rate. The results are displayed in Fig. 6.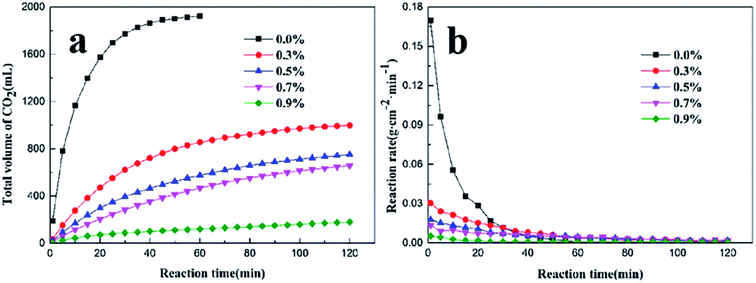 | ||
| Fig. 6 (a) The total volume of CO2 at different concentrations of PADAD in acid. (b) The reaction rate of PADAD acid and the carbonate rock with different concentration of PADAD. | ||
Fig. 6a shows that the total volume of CO2 decreased with the increasing PADAD concentration. Fig. 6b shows that the reaction rate decreased when PADAD was added into HCl. Moreover, as the concentration of PADAD added into the acid solution was increased, the reaction rate obviously decreased, which indicated that PADAD could retard the acid rock reaction.
The amide group and polyoxyethylene group of PADAD can adsorb onto the surface of the rock by hydrogen bonds.21,22 Moreover, the quaternary ammonium group with a positive charge in PADAD can adsorb onto the surface of the rock with a large negative charge. A film was formed on the carbonate rock due to the adsorption of PADAD, which could prevent hydrogen ion transfer from the solution to the carbonate rock; thus, the reaction rate was obviously reduced. It illustrates that PADAD has excellent performance in reducing the acid rock reaction rate.
Mechanism analysis
We treated the carbonate rock via different ways and observed its microstructure of via SEM. By this way, we could have a better understanding on how PADAD works. The results are displayed as follows.As shown in Fig. 7a, the surface of the unprocessed carbonate rock was very rough and had a little crack. The carbonate was treated by 20% HCl, and the surface of the carbonate rock was leveled and had many cracks and residues, as shown in Fig. 7b. The carbonate rock was treated by PADAD acid containing 0.7 wt% PADAD, as shown in Fig. 7c. Compared with the carbonate rock surface shown in Fig. 7b, a thin-layer adsorption film can be seen on the carbonate surface shown in Fig. 7c, which can prevent H+ transfer from the solution to the carbonate surface; furthermore, the reaction rate was reduced.
 | ||
| Fig. 7 (a) SEM of an unprocessed carbonate sample. (b) SEM of the carbonate sample treated by 20% HCl. (c) SEM of the carbonate sample treated by PADAD acid. | ||
Conclusion
In this study, a quadripolymer, PADAD, was synthesized by AM, APEGM, DMC, and DMAAC-16 through free radical polymerization. Through FT-IR and 1H-NMR, we analyzed the molecular structure of PADAD, and the results illustrated that the structure of PADAD was the same as that of the designed molecule. The weight average molecular weight (Mw) was 1.22 × 10⁵, the number average molecular weight (Mn) was 6.58 × 10⁴, and the molecular weight distribution coefficient was 1.85.The adsorption behavior of PADAD on a carbonate rock surface was researched. The kinetic model of PADAD on the carbonate rock surface was fitted by the pseudo-second-order kinetic model. The adsorption isotherm model of PADAD on the carbonate rock surface was fitted by the Freundlich model. PADAD can form a film on the carbonate rock surface, which can prevent H+ contact with carbonate and reduce the reaction rate. The excellent property of PADAD for reducing the reaction rate of HCl and carbonate illustrates its potential application for acidizing in oil and gas fields. We will do further research on other copolymer applications for acidizing in the future.
Abbreviations
| AM | Acrylamide |
| DMC | [2-(Methacryloyloxy)ethyl]-trimethylammonium chloride |
| APEG | Allyl polyethylene glycol |
| DMAAC-16 | Hexadecyl trimethyl allylammonium chloride |
| PADAD | Copolymer AM/DMC/APEG/DMAAC-16 |
| FT-IR | Fourier transform infrared |
| 1H-NMR | Nuclear magnetic resonance hydrogen spectrum |
| GPC | Gel permeation chromatography |
| SEM | Scanning electron microscopy |
| AIBA | 2,2′-Azobis[2-methylpropionamidine]dihydrochloride |
Acknowledgements
This work was supported by the National Natural Science Foundation of China (No. 51604229), the Scientific Research Starting Project of Southwest Petroleum University (No. 2015QHZ015), and the Opening Project of Oil &Gas Field Applied Chemistry Key Laboratory (YQKF201401).References
- P. Zhang, W. Huang, Z. Jia, C. Zhou, M. Guo and Y. Wang, J. Polym. Res., 2014, 21, 522 CrossRef.
- Y. A. Shashkina, Y. D. Zaroslov, V. A. Smirnov, O. E. Philippova, A. R. Khokhlov, T. A. Pryakhina and N. A. Churochkina, Polymer, 2003, 44, 2289 CrossRef CAS.
- P. Zhang, Y. Wang, W. Chen, H. Yu, Z. Qi and K. Li, J. Solution Chem., 2011, 40, 447 CrossRef CAS.
- L. Eoff, D. Dalrymple and B. R. Reddy, SPE Prod. Facil., 2005, 20, 250 CrossRef CAS.
- E. Volpert, J. Selb, F. Candau, N. Green, J. F. Argillier and A. Audibert, Langmuir, 1998, 14, 1870 CrossRef CAS.
- K. C. Taylor, and H. A. Nasr-El-Din, Canadian International Petroleum Conference, Calgary, June 12–14 2007 Search PubMed.
- K. C. Taylor and H. A. Nasr-El-Din, J. Pet. Sci. Eng., 1998, 19, 265 CrossRef CAS.
- H. Quan, H. Li, Z. Huang and T. Zhang, J. Appl. Polym. Sci., 2015, 132, 2259 Search PubMed.
- A. Audibert and J. F. Argillier, 1998, U.S. Pat., 5, 720 347.
- S. Gou, Y. He, Y. Ma, S. Luo, Q. Zhang, D. Jing and Q. Guo, RSC Adv., 2015, 5, 51549 RSC.
- S. Gou, Y. He, L. Zhou, P. Zhao, Q. Zhang, S. Li and Q. Guo, New J. Chem., 2015, 39, 9265 RSC.
- X. Li, C. Zou and C. Cui, Starch/Staerke, 2015, 67, 673 CrossRef CAS.
- J. F. Argillier, A. Audibert, J. Lecourtier, M. Moan and L. Rousseau, Colloids Surf., A, 1996, 113, 247 CrossRef CAS.
- H. Lu and Z. Huang, J. Macromol. Sci., Part A: Pure Appl.Chem., 2009, 46, 412 CrossRef CAS.
- Q. Li, Q. Y. Yue, Y. Su, B. Y. Gao and L. Fu, J. Hazard. Mater., 2007, 147, 370 CrossRef CAS PubMed.
- T. Zhang, F. Wu, Z. Xu, Z. Huang and C. Ouyang, J. Dispersion Sci. Technol., 2014, 150527103417002 CrossRef.
- Q. Y. Yue, Q. Li, B. Y. Gao, A. J. Yuan and Y. Wang, Appl. Clay Sci., 2007, 35, 268 CrossRef CAS.
- J. Febrianto, A. N. Kosasih, J. Sunarso, Y. H. Ju, N. Indraswati and S. Ismadji, J. Hazard. Mater., 2009, 162, 616 CrossRef CAS PubMed.
- R. Song, X. Hu, P. Guan, J. Li, L. Qian, C. Wang and Q. Wang, Appl. Surf., 2015, 332, 159 CrossRef CAS.
- C. J. Li, S. S. Zhang, J. N. Wang and T. Y. Liu, Catal. Today, 2014, 224, 94 CrossRef CAS.
- H. Quan, H. Li, Z. Huang, T. Zhang and S. Dai, Int. J. Polym. Sci., 2014, 2014, 1 CrossRef.
- G. Li, L. Zhou, C. Wang and E. Li, J. Polym. Res., 2014, 21, 523 CrossRef.
Footnote |
| † Electronic supplementary information (ESI) available. See DOI: 10.1039/c7ra04069e |
| This journal is © The Royal Society of Chemistry 2017 |

