 Open Access Article
Metal chloride-assisted synthesis of hierarchical porous carbons for high-rate-performance supercapacitor
Xuefeng Binga,
Xu Jianga,
Meng Tiana,
Jitong Wang *ac,
Wenming Qiaoab and
Licheng Ling*ab
aState Key Laboratory of Chemical Engineering, East China University of Science and Technology, Shanghai, 200237, P. R. China. E-mail: lchling@ecust.edu.cn; Fax: +86 21 64252914; Tel: +86 21 64252924
bKey Laboratory of Specially Functional Polymeric Materials and Related Technology, East China University of Science and Technology, Shanghai, 200237, P. R. China
cNational Engineering Research Center of Ultrafine Powder, East China University of Science and Technology, Shanghai, 200237, P. R. China. E-mail: wangjt@ecust.edu.cn; Fax: +86 21 64252914; Tel: +86 21 64252924
First published on 18th May 2017
Abstract
Hierarchical porous carbons with high surface area were prepared by direct carbonization of the polymers which were synthesized via a typical sol–gel method, using terephthalaldehyde and resorcinol as carbon precursors, and metal chloride as reaction assistant. All the metal chlorides could efficiently help to form 3-D porous network carbon with inter-linking irregular particles, and also successfully contribute to the developing of meso-macropores through the packing of grains. Such hierarchical porosity plays an important role for rapid ion diffusion, resulting in an excellent rate capability and low diffusion resistance. Moreover, it should be noted that ZnCl2 could also act as an in situ activation agent during the carbonization process to generate large surface area of 1106 m2 g−1 and pore volume of 1.2 cm3 g−1. In 3 mol L−1 H2SO4, high specific capacitance of 174.6 F g−1 by using the ZnCl2-assisted hierarchical porous carbon as electrode material is obtained and it could retain ca. 84% when the current density increases from 0.1 A g−1 to 20 A g−1. This superior rate capability is higher than that of many hierarchical porous carbons reported in previous literatures. The facile production and excellent electrochemical performance suggested a low cost and effective method to prepare hierarchical porous carbon for energy storage.
1 Introduction
Porous carbon materials have attracted widespread attention in modern technological applications, such as gas adsorption,1,2 catalyst supports,3,4 medicaments5,6 and energy storage,7,8 owing to their high surface area, excellent stability and high conductivity. Generally, the properties of porous carbons are determined by the pore size distribution, surface area, surface chemistry and architecture.9,10 As the electrode materials for supercapacitor, porous carbons should possess high specific surface area which could adsorb plenty of ions to achieve high specific capacitance, and developed porosity which could accelerate ion diffusion to improve power density and rate capability.11–15Previous researches suggested that hierarchical porous carbons with micro-meso-macroporous structures are among the most favorable porous carbons for electrochemical applications due to the synergetic effects of multi-scale pores. In such structure, the micropores could provide high surface area for large amounts of ions to be adsorbed, mesopores could accelerate ion diffusion, while the macropores could store electrolyte to shorten the distance of ion diffusion.16–20 Up to date, hierarchical porous carbons can be prepared by various methods, such as multi-template synthesis, bio-inspired methods and chlorination of titanium-carbide–carbon composites.21–26 Among them, the most applicable synthetic procedure is the templating approaches by sacrificial templates, such as P123, aluminosilicate, colloidal silica and zeolite.25–29 Hierarchical porous carbons with pore size ranging from 3 nm to 100 nm were synthesized using hierarchical silica capsules as the hard template and triblock copolymer Pluronic P123 as the soft template.18 Such porous carbon with specific surface area of 760 m2 g−1 had a high specific capacitance of 170 F g−1 and excellent cycling stability for 5000 cycles. Liu et al.19 prepared the hierarchical hollow porous carbon using multi-templates. The porous carbon with surface area of 669 m2 g−1 showed a high specific capacitance of 240 F g−1, and further activation process could improve the surface area to 1290 m2 g−1 and increase the specific capacitance to 304 F g−1. All the results suggested that the developed hierarchical porosity could enhance the electrochemical performance and the increase of micropores effectively contributed to the improvement of capacitance. Nevertheless, additional steps to remove templates cause long time chemical corrosion and energy consuming, meanwhile the destruction of expensive templates leads to high cost and low yield of scale-up. Therefore, such methods still remain the great challenge to exploit facile sustainable techniques to prepare hierarchical porous carbons.
Generally, to improve the specific surface area, the subsequent activation process is required. The common methods of activation include physical activation and chemical activation.30–37 The physical activation process involves carbonization of the raw materials and the subsequent activation at high temperature in a carbon dioxide or steam atmosphere.35–37 In the chemical activation process, a series of cross-linking and pyrolysis processes could happen quickly at lower temperature to create abundant pores.30–34 Recently, low melting point salts, such as ZnCl2, LiCl, KCl and NaCl, as activator, have been explored for the synthesis of porous materials with unique nanostructures.38–42 Nevertheless, the typical activation reaction mainly carried out on the surface of materials, making it difficult to create appropriate and accessible pores in the bulk for ion diffusion and adsorption. Therefore, it is still eagerly welcomed to develop simple and low cost techniques to prepare hierarchical porous carbons with high surface area and satisfied porosity.
Herein, we developed a facile metal chloride-assisted method for efficient synthesis of hierarchical porous carbons through a simple sol–gel polymerization process followed in situ chemical activation during carbonization. The metal chlorides (ZnCl2, NiCl2, FeCl3) were directly mixed with resorcinol and terephthaldehyde to form a homogeneous solution, and could act as reaction assistant to form 3D porous network particles. The hierarchical porous carbons could be obtained by direct carbonization and following acid washing, which inherit the 3D structure due to the rigidity of network. In the obtained carbons, the micropores are generated within the highly cross-linked network of polymer chains, while the mesopores and macropores are formed by the interconnected particles. The porous structure of the hierarchical porous carbons could be adjusted by adding different metal chlorides. Owing to the in situ chemical activation effect of ZnCl2, the as-prepared hierarchical porous carbon possesses relatively high specific surface area and excellent electrochemical performance as electrode material. The metal chloride-assisted method provides a new idea for the preparation of hierarchical porous carbons via the time-saving, recyclable, in situ chemical activation process, which could have great potential for the supercapacitor and other energy storage applications.
2 Experimental section
2.1 Preparation of the hierarchical porous carbon materials
All chemicals were purchased from Titanchem Co. and used without further treatment. The polymer precursors were synthesized via a solvent-thermal method, using resorcinol (R) and terephthalaldehyde (T) as the carbon sources, metal chloride as reaction assistant and ethyl alcohol as solvent. In a typical synthesis, 20 mmol R, 40 mmol T and 10 g metal chloride were added to 80 mL ethyl alcohol under stirring at 40 °C for 20 min. Subsequently, the mixed solution was transferred into a 100 mL sealed Teflon-lined autoclave and heated at 180 °C for 24 h. The polymeric gel was obtained after autoclave cooling down to ambient temperature naturally. Then, the gel was dried in an oven at 60 °C for 24 h, followed by thermal treatment at 800 °C with a heating rate of 1 °C min−1 for 2 h under nitrogen flow. Finally, the product was washed with hydrochloric acid and deionized water to remove all the metal chloride and dried at 80 °C for 24 h. The hierarchical porous carbon materials obtained were denoted as RT-X, where X represents the addition of metal chloride, and the blank sample that synthesized just from terephthalaldehyde and resorcinol was named as RT.2.2 Characterization
The scanning electron microscopy (SEM, JEOL JSM-7500F) and transmission electron microscopy (TEM, JEOL 2100F) were used to observe the morphology and microstructure of the samples, after grounding and drying.Nitrogen adsorption–desorption isotherms were measured on a Quadrasorb SI analyser at 77 K. Before measurements, the samples were degassed under vacuum at 473 K for 12 h. The specific surface area was calculated by utilizing the Brunauer–Emmett–Teller (BET) method and total pore volume was estimated from adsorbed amount at P/P0 = 0.985. The micropore specific surface area and volume were calculated by t-plot method. The mesopore volume and mesoporous pore size distribution were acquired from the desorption branch based on the Barrett–Joyner–Halenda (BJH) model, while the micropore pore size distribution were calculated by nonlocal density functional theory (NLDFT-cylindrical model).
The carbon (C) and oxygen (O) contents on the surface were measured by an Axis Ultra DLD X-ray photoelectron spectroscopy. The working voltage and current of X-ray source were 15 kV and 10 mA, respectively, and the operating pressure was lower than 2 × 10⁻⁸ Torr. The C 1s and O 1s XPS spectra were obtained at 0.1 eV step size. The multiple peak separation of O 1s were carried out by mixed Gaussian/Lorentzian curve fitting method, and the background was subtracted by Shirley function using a XPS peak processing software. The peak width was not fixed during the fit procedure.
The crystallographic structures were measured by the X-ray diffraction (XRD) patterns and Raman spectra. The XRD patterns were recorded by a Rigaku D/max 2550 diffractometer which working voltage and current were 40 kV and 20 mA and radiation is Cu Kα (λ = 1.5406 Å). Raman spectra were acquired on a Renishaw system 1000 with an argon-ion laser operating at 514 nm using a charged-coupling-device detector.
2.3 Electrochemical test
The electrode plates were composed of active material, acetylene black and polytetrafluoroethylene binder. Firstly, these materials were mixed in a mass ratio of 85![[thin space (1/6-em)]](https://www.rsc.org/images/entities/char_2009.gif) :
:![[thin space (1/6-em)]](https://www.rsc.org/images/entities/char_2009.gif) 10
10![[thin space (1/6-em)]](https://www.rsc.org/images/entities/char_2009.gif) :
:![[thin space (1/6-em)]](https://www.rsc.org/images/entities/char_2009.gif) 5 by adding a small amount of ethanol, and gradually ground in an agate mortar to form a homogeneous paste. Afterwards, the paste was turned into a film with a thickness of ∼0.09 mm by the aid of a roller press. The electrode plates were finally obtained through punching the film into small round with a diameter of ∼8 mm and each of the electrode plate contained approximately 3 mg activated material. The simulative device for experiment constructed with two same electrode plates separated with a membrane. 3 mol L−1 H2SO4 was used as electrolyte in all the electrochemical experiment.
5 by adding a small amount of ethanol, and gradually ground in an agate mortar to form a homogeneous paste. Afterwards, the paste was turned into a film with a thickness of ∼0.09 mm by the aid of a roller press. The electrode plates were finally obtained through punching the film into small round with a diameter of ∼8 mm and each of the electrode plate contained approximately 3 mg activated material. The simulative device for experiment constructed with two same electrode plates separated with a membrane. 3 mol L−1 H2SO4 was used as electrolyte in all the electrochemical experiment.
The cyclic voltammetry (CV) with voltage range from 0 V to 0.9 V and electrochemical impedance spectroscopy (EIS) analysis with frequency range of 0.01 Hz to 100 kHz were performed on a Gamry Instrument (Warminster, PA, USA). Galvanostatic charge–discharge at different current densities was carried out on an ARBIN BT2000 apparatus. The specific discharge capacitance of the sample was calculated from the following equation
| C = It/mdV | (1) |
3 Results and discussion
3.1 Characterization of the hierarchical porous carbon materials
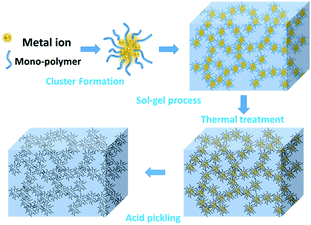
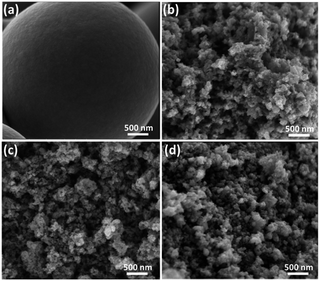
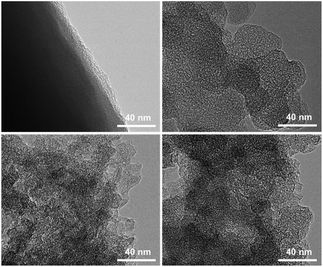
Scheme 1 demonstrates the possible synthesis process of the hierarchical porous carbon by the aid of metal ion. The resorcinol and terephthaldehyde could crosslink each other into small cluster around the metal ion which has the unoccupied molecular orbital to attract the oxygen atom of resorcinol and terephthaldehyde. The cluster grows further via polymerizing into colloid-like polymer particles, followed by microphase separation to form 3-D gels43,44. The hierarchical porous carbons could be obtained by following carbonization and acid washing. In this work, both the reactants possess the benzene skeleton to improve the rigidity of the polymer backbone, which leads to the formation of stable network. The metal chloride acts as the reaction assistant of polymerization to form 3-D porous network. Moreover, it could also be recycled effectively through collecting the liquid waste. The synthesis process is simple and low-cost, which is promising to be employed for industrial-scale production.The typical SEM and TEM images of the obtained RT and the RT-X carbons with different metal chlorides are shown in Fig. 1 and 2, respectively. From the SEM images, it could be observed that RT is normal carbon microsphere with smooth surface, while the RT-X carbons show typically 3-D porous networks formed by the inter-linking of irregular particles, and meso-macropores could also be clearly observed. The apparent difference between RT and RT-X of morphologies should be certainly ascribed to the addition of metal chloride, which could change the sol–gel reaction pathway to form the particles accumulation. The TEM images obviously show that the particle size gradually decreases with the increasing electronegativity of the different metal ions. It is because that the metal ion with higher electronegativity can help resorcinol and terephthalaldehyde polymerize with smaller space steric hindrance. Such result suggests that both the porous structure and particle size could be adjusted by different kind and amount of additives.
The N2 adsorption–desorption isotherms of the hierarchical porous carbons are presented in Fig. 3(a). The isotherm of RT is assigned to the typical type I responding to the single existence of abundant micropores. While the isotherms of RT-ZnCl2, RT-NiCl2 and RT-FeCl3 belong to the type IV with associated H1 hysteresis loops which indicate the presence of mesopores formed from the particles stacking. In addition, the high uptake of N2 adsorption at low relative pressures (0–0.1) and the slight increase at high relative pressure (0.9–1.0) indicate that micropores and macropores co-exist in the metal chloride-assisted samples. The pore size distributions calculated using BJH and DFT model are also shown in Fig. 3(b) and (c), respectively. It demonstrates that the addition of metal chloride leads to the formation of some mesopores. The calculated porosity parameters are listed in Table 1. The BET surface areas of RT, RT-NiCl2 and RT-FeCl3 are all ca. 550 m2 g−1, and it increases to 1106 m2 g−1 for RT-ZnCl2. In addition, the average pore diameter calculated by BJH model and total volume of RT-ZnCl2 are also the largest. This is because that the in situ ZnCl2 activation could homogeneously and continuously take place in the polymer framework to generate amounts of appropriate pores during the carbonization process. The result reveals that the addition of metal chloride could introduce large amount of mesopores and macropores into porous carbon, formed by the inter-linking of irregular particles. Meanwhile, the specific area increases significantly in the presence of ZnCl2 because of its unique in situ activation role which is different from the typical activation.
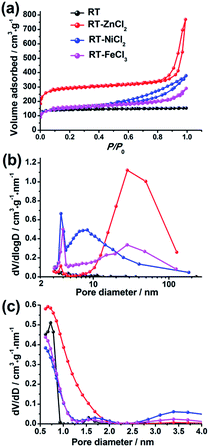 | ||
| Fig. 3 (a) The N2 adsorption–desorption isotherms, (b) the BJH and (c) NL-DFT pore size distributions. | ||
| Sample | SBETa (m2 g−1) | VTb (cm3 g−1) | Smicc (m2 g−1) | Vmicd (cm3 g−1) | DDFTe (nm) | Vmesof (cm3 g−1) | DBJHg (nm) |
|---|---|---|---|---|---|---|---|
| a BET specific surface area from N2 adsorption.b Total pore volume (P/P0 = 0.985).c DFT micropore surface area (<2 nm).d DFT micropore volume (<2 nm).e DFT pore diameter.f BJH mesopore volume.g BJH pore diameter. | |||||||
| RT | 558 | 0.24 | 523 | 0.21 | 0.67 | 0.02 | 3.2 |
| RT-ZnCl2 | 1106 | 1.19 | 960 | 0.39 | 0.67 | 0.78 | 28.3 |
| RT-NiCl2 | 591 | 0.59 | 375 | 0.15 | 0.67 | 0.42 | 3.8 |
| RT-FeCl3 | 572 | 0.45 | 434 | 0.18 | 0.67 | 0.22 | 7.4 |
The element composition and chemical state on the surface were measured by high-resolution X-ray photoelectron spectroscopy (XPS), as shown in Fig. 4. The XPS survey scan spectra with binding energy ranging from 0 to 1000 eV show that there are only C and O on the surface of all samples. All the high-resolution XPS spectra of C 1s show very similar unimodal peak shapes at 284.8 eV, which is related to the graphitic carbon, suggesting that most carbon atoms exist in conjugated honeycomb lattices.45 The O 1s peak could be curve-fitted into three peaks centered around 533.5, 532.3 and 530.8 eV which represent C–O–C, C–OH and C![[double bond, length as m-dash]](https://www.rsc.org/images/entities/char_e001.gif) O, respectively.46 The content of C
O, respectively.46 The content of C![[double bond, length as m-dash]](https://www.rsc.org/images/entities/char_e001.gif) O in RT-X increases with the increasing electronegativity of metal ion, while no C
O in RT-X increases with the increasing electronegativity of metal ion, while no C![[double bond, length as m-dash]](https://www.rsc.org/images/entities/char_e001.gif) O is resolved in RT, suggesting that the metal chloride could catalyze the C–OH dehydrogenation to form C
O is resolved in RT, suggesting that the metal chloride could catalyze the C–OH dehydrogenation to form C![[double bond, length as m-dash]](https://www.rsc.org/images/entities/char_e001.gif) O and the catalytic performance is related to the electronegativity.
O and the catalytic performance is related to the electronegativity.
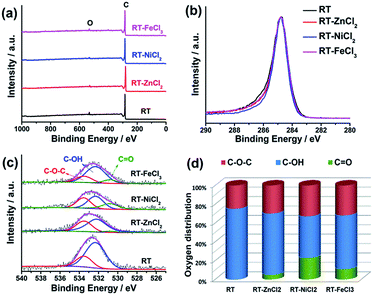 | ||
| Fig. 4 (a) XPS survey, (b) high-resolution C 1s, (c) high-resolution O 1s spectra, (d) the distribution of O species in the samples from resolving peaks of the O 1s spectra. | ||
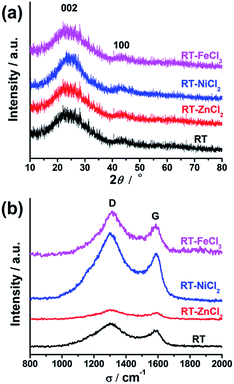
The crystallographic structures of all samples were demonstrated by XRD, as displayed in Fig. 5(a). All samples show two similar broadened diffraction peaks located at ca. 25.1° and 43.9°, corresponding to the reflections of the graphitic planes (002) and (100), respectively.47 The addition of metal chloride doesn't change the position of two peaks. However, RT-NiCl2 shows a little sharper peak suggesting that NiCl2 could promote graphitization somewhat at high temperature. As shown in Fig. 5(b), Raman spectroscopy was carried out to further characterize the microcrystalline structures of all samples. The peak at 1350 cm−1 (D-band) is associated with the amorphous carbon, while the peak at 1581 cm−1 (G-band) is attributed to ordered graphite in-plane vibrations with E2g symmetry.48 Therefore, the disordered degree of carbon materials could be characterized with the intensity ratios of the D-band to the G-band (ID/IG). The ID/IG ratios of RT, RT-ZnCl2, RT-NiCl2 and RT-FeCl3 calculated from the peak area are 2.95, 3.61, 2.40 and 2.62, respectively. The result suggests that all samples are amorphous carbon and the addition of ZnCl2 could introduce more defectiveness to the porous carbon because of its in situ activation, while the NiCl2 and FeCl3 could increase the degree of graphitization due to their catalytic graphitization.
3.2 The electrochemical performances
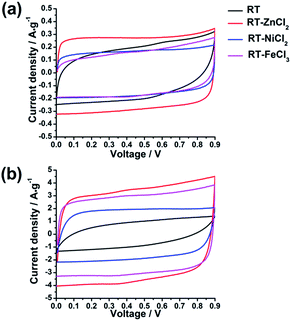
In the hierarchical porous structure, macropores provide a high volume to store electrolyte so as to shorten the diffusion distance of ion, while mesopores are necessary for fast ion transport, and micropores contribute high surface area to adsorb amounts of ions. Such unique properties indicate that the hierarchical porous carbons could be ideal electrode materials for high-performance supercapacitors. In order to examine the electrochemical properties of the as-prepared hierarchical porous carbons as supercapacitor electrode materials, various electrochemical measurements, such as galvanostatic charge–discharge (GCD), cyclic voltammetry (CV) and electrochemical impedance spectroscopy (EIS), were carried out in a two-electrode configuration using 3 mol L−1 H2SO4 as electrolyte.All the cyclic voltammetry curves tested in the voltage range of 0–0.9 V at the scan rates of 10 mV s−1 and 100 mV s−1 are illustrated in Fig. 6. It can be observed that all the CV curves present quasi-rectangular shapes at scan rate of 10 mV s−1, indicating the formation of electric double layer. Furthermore, the area of CV curve which reflects the specific capacitance increases with the increasing of micropore specific area. However, when the scan rate increases from 10 mV s−1 to 100 mV s−1, the CV curve of RT presents obvious deformation and minimum area due to high resistance for the ion diffusing into the narrow micropores. While the CV curves of RT-X carbons still maintain roughly rectangular shapes, suggesting that the electrolyte ions could more easily diffuse into the micropores of metal chloride-assisted samples to form electric double layer. The result indicates that the micro-meso-macroporous network formed by the inter-linking of irregular particles is quite adequate architecture for ion diffusion resulting in excellent rate capability.
The electrochemical behaviors of the samples were further investigated by galvanostatic charge–discharge measurements, which could be used to calculate the specific capacitance, power density and energy density. The charge–discharge curves at the current density of 1 A g−1 and 10 A g−1 are shown in Fig. 7(a) and (b), respectively. All the samples demonstrate symmetric charge–discharge curves at 1 A g−1, indicating the standard electric double layer behavior. But when the current density increases to 10 A g−1, the obvious warp and IR drop can be detected in the charge–discharge curve of RT due to the high diffusion resistance in narrow micropores, quite agreeing with the result of CV measurement. While those of the metal chloride-assisted samples still remain symmetrical isosceles triangle with negligible IR drop, clarifying that the hierarchical porous carbons have good capacitive behavior with little energy loss even at high current density. The rate capability of different samples calculated from galvanostatic discharge measurements is compared in Fig. 7(c). The specific capacitances of RT, RT-ZnCl2, RT-NiCl2 and RT-FeCl3 at the current density of 0.1 A g−1 are 156.1 F g−1, 174.6 F g−1, 104.5 F g−1 and 134.8 F g−1, respectively. The obtained capacitances of all samples are positively correlated with the micropore specific area because the ions are mainly adsorbed by micropores. When the current density reaches 20 A g−1, the capacitance of RT reduces to 18.7 F g−1, only 12% of the capacitance can be maintained. In addition, the capacitances of all the metal chloride-assisted samples could retain as high as ca. 84%, due to the fast ion diffusion. This rate capability is better than that of many hierarchical porous carbons reported in previous literatures, as listed in Table 2. Such excellent rate capability is much to be desired for the practical application of supercapacitor. These results suggest that the narrow micropores in RT are remarkably disadvantageous for ion diffusion and the addition of metal chloride could create approachable channels for ion rapidly diffusing into the micropores to achieve superior rate capability. In addition, highest capacitance of 174.6 F g−1 is acquired by adding zinc chloride with additional in situ activation role.
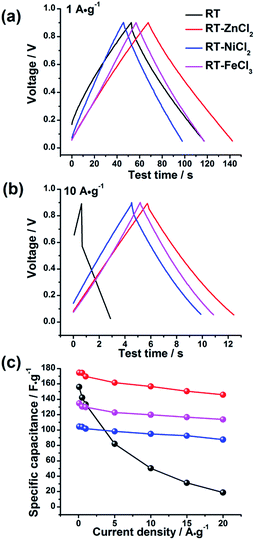 | ||
| Fig. 7 The galvanostatic charge–discharge curves of all samples at (a) 1 A g−1 and (b) 10 A g−1 and (c) the rate capability. | ||
| Precursor | Fabrication | Retention | Current density | Electrolyte | Ref. |
|---|---|---|---|---|---|
| Terephthalaldehyde, resorcinol | Dual roles of ZnCl2: Reaction assistant and in situ chemical activation | ca. 84% | 0.1–20 A g−1 | 3 M H2SO4 | This work |
| Resol | Silica and P123 as multi-templates | ca. 24% | 0.2–6 A g−1 | 5 M KOH | 18 |
| Furfuryl alcohol | Silica, PAA and CTAB as multi-templates, KOH as activation agent | ca. 68% | 0.5–10 A g−1 | 6 M KOH | 19 |
| Phenol, formaldehyde | Silica as template | ca. 71% | 1–10 A g−1 | 6 M KOH | 27 |
| Phenolic resin | F127 as template and KOH as activation agent | ca. 72% | 0.2–20 A g−1 | 6 M KOH | 32 |
| Terephthalaldehyde, melamine, pyrrolidine | ZnCl2 as activation agent | ca. 76% | 1–10 A g−1 | 1 M H2SO4 | 33 |
| Enteromorpha | ZnCl2 as activation agent | ca. 79% | 0.4–1 A g−1 | 6 M KOH | 38 |
| Resorcinol, formaldehyde | ZnCl2 as activation agent | ca. 62% | 0.5–20 A g−1 | 2 M KOH | 39 |
| Chitosan | ZnCl2 as activation agent | ca. 75% | 0.5–20 A g−1 | 6 M KOH | 41 |
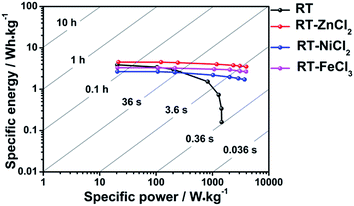
The Ragone plots which visually reflect the energy and power output capability of supercapacitor are shown in Fig. 8. The energy density and power density are calculated from discharge measurements based on the followed equation.
 | (2) |
| P = E/t | (3) |
All cells show maximum energy density at minimum current density because ions could be adsorbed by micropores as many as possible. The largest power density is achieved at maximum current density due to the fastest speed of charges transfer. It is obvious that the addition of metal chloride could improve the ability of power output and energy storage capacity at high current density. Among them, the cell used RT-ZnCl2 as electrode material possesses maximum energy density (4.5 W h kg−1 at 0.1 A g−1) and power density (3987.6 W kg−1 at 20 A g−1).
To detailedly reveal the charge–discharge kinetics inside the electrode, the electrochemical impedance spectroscopy (EIS) was measured with the frequency ranging from 0.01 Hz to 100 kHz. As displayed in Fig. 9a and b, the electrochemical impedance of supercapacitor could be divided into three parts in the Nyquist plots: electrolyte resistance (x-intercept at the highest frequency region), interfacial contact impedance of electrode material (semicircle at the middle frequency region), and the diffusion resistance which is associated with intra-particle pores (oblique line at the low frequency region).49,50 The values of interfacial contact impedance for RT, RT-ZnCl2, RT-NiCl2 and RT-FeCl3 are 0.27 Ω cm−2, 0.19 Ω cm−2, 0.17 Ω cm−2 and 0.18 Ω cm−2, respectively, suggesting the semicircles may be also partly associated with ionic dynamic dispersion within the pores.51 Different from the flexuous curve of RT, the vertical lines of all the metal chloride-assisted samples appear at the low frequency region. It is attributed to the satisfying channels in the metal chloride-assisted hierarchical porous carbons for ion diffusion, while the narrow micropores in RT are difficult for ion diffusing to form electric double layer.
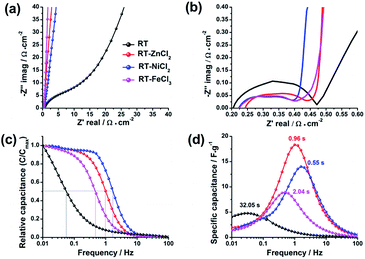 | ||
| Fig. 9 (a) Nyquist plots, (b) the enlargement of the high-frequency region, (c) evolution of the relative real capacitance and (d) imaginary capacitance with frequency of all samples. | ||
The Bode plots, which describe the evolution of the real capacitances (C′) and the imaginary capacitances (C″) with frequency changing, are adopted to further studying the ion diffusion kinetics in different samples, as shown in Fig. 9c and d. The capacitance of cell (C) is defined by Kronig–Kramers relational expression (C = C′ − jC″).51,52 The evolution of C′/Cmax′ with frequency corresponds to the process of cell changing from pure resistive behavior (C′/Cmax′ = 0) to pure capacitive behavior (C′/Cmax′ = 1). At the region of high frequency (>100 Hz), the time is too short for the ions to diffuse into the micropores of electrodes, so that the cell works as a pure resistance. In contrast, the ions could be adsorbed as many as possible at low frequency, therefore the cell could be regarded as a pure capacitor. Generally, when the value of real capacitance exceeds 50% of Cmax′, the device performs more like a capacitor rather than a resistance. Thus, the corresponding frequency (f0.5) could be used to evaluate the capability of rapid charging and discharging. The f0.5 for RT, RT-ZnCl2, RT-NiCl2 and RT-FeCl3 are 0.03 Hz, 1.04 Hz, 1.81 Hz and 0.49 Hz, respectively. According to the Kronig–Kramers relational expression, the imaginary capacitance could denote the energy dissipation in the process of pure resistive behavior changing to pure capacitive behavior. The maximum energy loss appeared at the frequency of f0.5 which reciprocal defines the relaxation time constant (τ0). The τ0 values for RT, RT-ZnCl2, RT-NiCl2 and RT-FeCl3 are 32.05 s, 0.96 s, 0.55 s and 2.04 s, respectively. These results give valuable insight into the role of developed meso-macropores on the acceleration of ion transport with the addition of metal chloride in synthesis.
4 Conclusions
With the addition of metal chloride, hierarchical porous carbons were successfully prepared through a typical sol–gel process and subsequent in situ activation during carbonization, using terephthalaldehyde and resorcinol as the carbon precursors. The presence of metal chloride could efficiently help to form the developed micro-meso-macroporous structure by particles stacking. Such hierarchical porosity plays an important role for rapid ion diffusion, resulting in excellent rate capability and low diffusion resistance. All the metal chloride-assisted hierarchical porous carbons maintain excellent rate capability of ca. 84% retention from 0.1 A g−1 to 20 A g−1, higher than that of many hierarchical porous carbons reported in previous literatures. ZnCl2 could also act as the in situ activation agent during the thermal treatment process to develop high surface area of 1106 m2 g−1, and large pore volume of 1.2 cm3 g−1. Therefore, the RT-ZnCl2 could serve as the ideal electrode material with the highest specific capacitance of 174.6 F g−1, maximum energy output capability (4.5 W h kg−1 at 0.1 A g−1) and outstanding power output capability (3987.6 W kg−1 at 20 A g−1) in 3 mol L−1 H2SO4. These results illustrate that the metal chloride-assisted hierarchical porous carbons with developed 3-D networks have great potential in the application of electrochemical energy storage.Acknowledgements
This work was financially supported by MOST (2014CB239702), National Natural Science Foundation of China (No. 21506061, 21576090, 51302083, 51272077), Shanghai Municipal Natural Science Foundation (No. 14ZR1410400), Shanghai Rising-Star Program (17QB1401700), Petro China Innovation Foundation and Fundamental Research Funds for the Central Universities.References
- G. P. Hao, Z. Y. Jin and Q. Sun, et al., Energy Environ. Sci., 2013, 6, 3740–3747 CAS.
- M. E. Casco, M. Martínez-Escandell and J. Silvestre-Albero, et al., Carbon, 2014, 67, 230–235 CrossRef CAS.
- C. Zhu, H. Li and S. Fu, et al., Chem. Soc. Rev., 2016, 45, 517–531 RSC.
- E. Lam and J. H. T. Luong, ACS Catal., 2014, 4, 3393–3410 CrossRef CAS.
- S. K. Gordeev, Met. Sci. Heat Treat., 2015, 56, 559–563 CrossRef CAS.
- S. W. Ryter and L. E. Otterbein, BioEssays, 2004, 26, 270–280 CrossRef CAS PubMed.
- S. Han, D. Wu and S. Li, et al., Adv. Mater., 2014, 26, 849–864 CrossRef CAS PubMed.
- M. Zeiger, N. Jäckel and V. N. Mochalin, et al., J. Mater. Chem. A, 2016, 4, 3172–3196 CAS.
- L. L. Zhang and X. S. Zhao, Chem. Soc. Rev., 2009, 38, 2520–2531 RSC.
- C. Liang, Z. Li and S. Dai, Angew. Chem., Int. Ed., 2008, 47, 3696–3717 CrossRef CAS PubMed.
- M. Zhi, C. Xiang and J. Li, et al., Nanoscale, 2013, 5, 72–88 RSC.
- M. M. Sk, C. Y. Yue and K. Ghosh, et al., J. Power Sources, 2016, 308, 121–140 CrossRef CAS.
- P. Simon and Y. Gogotsi, Nat. Mater., 2008, 7, 845–854 CrossRef CAS PubMed.
- E. Frackowiak, Phys. Chem. Chem. Phys., 2007, 9, 1774–1785 RSC.
- G. Wang, L. Zhang and J. Zhang, Chem. Soc. Rev., 2012, 41, 797–828 RSC.
- A. González, E. Goikolea and J. A. Barrena, et al., Renewable Sustainable Energy Rev., 2016, 58, 1189–1206 CrossRef.
- Q. Wang, J. Yan and Y. Wang, et al., Carbon, 2014, 67, 119–127 CrossRef CAS.
- W. Zhou, Z. Lin and G. Tong, et al., RSC Adv., 2016, 6, 111406–111414 RSC.
- J. Liu, X. Wang and J. Gao, et al., Electrochim. Acta, 2016, 211, 183–192 CrossRef CAS.
- Q. Zhao, X. Wang and J. Liu, et al., Electrochim. Acta, 2015, 154, 110–118 CrossRef CAS.
- W. Tian, Q. Gao and Y. Tan, et al., J. Mater. Chem. A, 2015, 3, 5656–5664 CAS.
- Y. Wang, S. Tao and Y. An, et al., J. Mater. Chem. A, 2013, 1, 8876–8887 CAS.
- H. J. Liu, J. Wang and C. X. Wang, et al., Adv. Energy Mater., 2011, 1, 1101–1108 CrossRef CAS.
- D. D. Zhou, H. J. Liu and Y. G. Wang, et al., J. Mater. Chem., 2012, 22, 1937–1943 RSC.
- R. Ruiz-Rosas, M. J. Valero-Romero and D. Salinas-Torres, et al., ChemSusChem, 2014, 7, 1458–1467 CrossRef CAS PubMed.
- D. Xu, S. Che and O. Terasaki, New J. Chem., 2016, 40, 3982–3992 RSC.
- Y. Han, S. Liu and D. Li, et al., Electrochim. Acta, 2014, 138, 193–199 CrossRef CAS.
- M. J. Valero-Romero, E. M. Márquez-Franco and J. Bedia, et al., Microporous Mesoporous Mater., 2014, 196, 68–78 CrossRef CAS.
- S. Wang, T. Wang and P. Liu, et al., Mater. Res. Bull., 2017, 88, 62–68 CrossRef CAS.
- P. Hao, Z. Zhao and J. Tian, et al., Nanoscale, 2014, 6, 12120–12129 RSC.
- L. Qie, W. Chen and H. Xu, et al., Energy Environ. Sci., 2013, 6, 2497–2504 Search PubMed.
- X. Yu, J. Lu and C. Zhan, et al., Electrochim. Acta, 2015, 182, 908–916 CrossRef CAS.
- J. S. Wei, H. Ding and Y. G. Wang, et al., ACS Appl. Mater. Interfaces, 2015, 7, 5811–5819 CAS.
- M. Sevilla and R. Mokaya, Energy Environ. Sci., 2014, 7, 1250–1280 CAS.
- T. Tooming, T. Thomberg and H. Kurig, et al., J. Power Sources, 2015, 280, 667–677 CrossRef CAS.
- K. Xia, Q. Gao and J. Jiang, et al., Carbon, 2008, 46, 1718–1726 CrossRef CAS.
- Z. Y. Sui, Q. H. Meng and J. T. Li, et al., J. Mater. Chem. A, 2014, 2, 9891–9898 CAS.
- M. Wu, P. Li and Y. Li, et al., RSC Adv., 2015, 5, 16575–16581 RSC.
- Y. Wang, B. Chang and D. Guan, et al., J. Solid State Electrochem., 2015, 19, 1783–1791 CrossRef CAS.
- X. Liu and M. Antonietti, Carbon, 2014, 69, 460–466 CrossRef CAS.
- X. Deng, B. Zhao and L. Zhu, et al., Carbon, 2015, 93, 48–58 CrossRef CAS.
- T. Ouyang, K. Cheng and Y. Gao, et al., J. Mater. Chem. A, 2016, 4, 9832–9843 CAS.
- J. Wang, S. Xu and Y. Wang, et al., RSC Adv., 2014, 4, 16224–16232 RSC.
- X. Bing, Y. Wei and M. Wang, et al., J. Colloid Interface Sci., 2017, 488, 207–217 CrossRef CAS PubMed.
- M. Wang, J. Wang and W. Qiao, et al., RSC Adv., 2014, 4, 61456–61464 RSC.
- D. Hulicova-Jurcakova, M. Seredych and G. Q. Lu, et al., Adv. Funct. Mater., 2009, 19, 438–447 CrossRef CAS.
- H. Chen, F. Sun and J. Wang, et al., J. Phys. Chem. C, 2013, 117, 8318–8328 CAS.
- K. Mcguire, N. Gothard and P. Gai, et al., Carbon, 2005, 43, 219–227 CrossRef CAS.
- H. K. Song, H. Y. Hwang and K. H. Lee, et al., Electrochim. Acta, 2000, 45, 2241–2257 CrossRef CAS.
- Z. Hu, X. Xiao and C. Chen, et al., Nano Energy, 2015, 11, 226–234 CrossRef CAS.
- H. Wu, X. Wang and L. Jiang, et al., J. Power Sources, 2013, 226, 202–209 CrossRef CAS.
- P. L. Taberna, P. Simon and J. F. Fauvarque, J. Electrochem. Soc., 2003, 150, A292–A300 CrossRef CAS.
| This journal is © The Royal Society of Chemistry 2017 |

