 Open Access Article
Creative Commons Attribution 3.0 Unported Licence
Core–shell structured nanospheres for photothermal ablation and pH-triggered drug delivery toward synergistic cancer therapy
Tian Zhonga,
Jia Fua,
Ran Huang*b and
Lianjiang Tan *c
*c
aDepartment of Chemistry and Pharmacy, Zhuhai College of Jilin University, Zhuhai 519041, Guangdong, China
bState Key Laboratory of Microbial Metabolism, School of Life Sciences and Biotechnology, Shanghai Jiao Tong University, Shanghai 200240, China. E-mail: ranhuang84@outlook.com
cKey Laboratory of Systems Biomedicine (Ministry of Education), Shanghai Center for Systems Biomedicine, Shanghai Jiao Tong University, Shanghai 200240, China. E-mail: ljtan@sjtu.edu.cn; Tel: +86-21-34204561
First published on 18th May 2017
Abstract
CuS nanoparticles capped with a long-chain carboxylic acid were synthesized and conjugated with chitosan (CS) via N-hydroxysuccinimide. The anticancer drug doxorubicin (DOX) was then encapsulated by hydrophobic interaction, producing pH-responsive CuS(DOX)@CS nanospheres with photothermal conversion properties for controllable drug release and photothermal ablation (PTA). On the one hand, the encapsulated CuS nanoparticles can absorb NIR photons and be heated efficiently. On the other hand, the entrapped DOX can be released from the swollen CuS(DOX)@CS nanospheres caused by stretched oleoyl-CS chains at lowered pH. Combining chemotherapy and PTA, the biocompatible CuS(DOX)@CS nanospheres can provide synergistic cancer treatment, as evidenced by both in vitro and in vivo experiments. This study gives new insights into developing multifunctional drug delivery agents for cancer nanotherapeutics.
1. Introduction
In recent years, near-infrared (NIR) laser-induced photothermal ablation (PTA) therapy against cancerous tumor has been developed rapidly for its minimal invasion and remarkable resolution.1–3 A variety of photothermal conversion agents have been investigated in order to promote the photothermal conversion efficiency and thus improve efficacy and efficiency of PTA therapy. Copper sulfide (CuS) nanostructured materials are a class of photothermal agents that provide a promising platform for PTA tumor therapy.4–7 Due to their intrinsic NIR-window absorption and low cytotoxicity, CuS nanoparticles,8 nanorods9 and flower-like superstructures10 have attracted great interest in photothermal ablation applications. These CuS nanomaterials will be readily heated under NIR irradiation, which originates from the d–d energy band transition of Cu2+ ions.11 Compared with gold nanomaterials that usually generate heat under 808 nm laser irradiation, photothermal conversion of CuS nanomaterials can be achieved using a 980 nm laser, which has deeper tissue penetration depth12 and enhanced PTA efficiency.13On the other hand, chitosan (CS) has been widely used for biomedical applications.14–16 The pKa of CS is 6.0–6.5 in aqueous media,17 and the charged state and physiochemical properties of CS are significantly influenced by the ambient environmental pH.18 CS was found to form dissociated precipitates in aqueous phase at physiological pH of 7.4 due to rapid local aggregation of CS polymeric chains.19 Sung's group fabricated a comblike associating polyelectrolyte by conjugating a hydrophobic palmitoyl group onto the free amine groups of CS.20 Through balancing charge repulsion and hydrophobic interaction, the chain conformation of the associating polyelectrolyte can be controlled simply by adjusting the environmental pH within a narrow range.
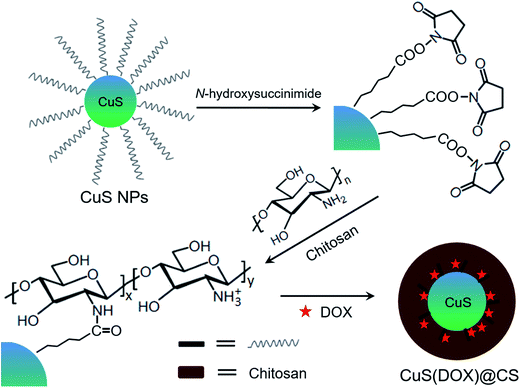
Various polymeric nanoparticles have been developed for drug delivery.21–23 To core–shell structures are frequently adopted for fabricating multifunctional nanomaterials.24,25 In the present work, core–shell structured nanospheres composed of a photothermal CuS nanoparticle and pH-sensitive oleoyl-CS chains with entrapped doxorubicin (DOX) for synergistic cancer therapy. Oleic acid-capping CuS nanoparticles were synthesized, reacted with N-hydroxysuccinimide and conjugated with CS. Coexisting with DOX in aqueous solution, the hydrophobic oleoyl groups tended to form local aggregates and entrap DOX by hydrophobic interaction, constructing CuS(DOX)@CS nanospheres spontaneously (Fig. 1). At pH ≥ 7.0, the DOX is entrapped in the nanospheres owing to the strong hydrophobic interaction between the oleoyl groups. At low pH values, the protonated amine groups increase the charge repulsion between the oleoyl-CS chains, which triggers the release of the entrapped DOX. Moreover, the encapsulated CuS nanoparticles will be heated under irradiation of a 980 nm-laser, which can kill cancer cells by PTA. The developed CuS(DOX)@CS nanospheres are aimed at chemo-photothermal synergistic cancer therapy with a lower drug dose and mild irradiation conditions.
2. Experimental
2.1. Materials
Copper chloride (CuCl2·H2O, ≥99%), sodium sulfide (Na2S, ≥99%) and chitosan (CS, weight-average molecular weight Mw = 21![[thin space (1/6-em)]](https://www.rsc.org/images/entities/char_2009.gif) 000, degree of acetylation ≥ 95%) were provided by Sinopharm Chemical Reagent Co., Ltd, China. 1-Octadecene (98%), oleic acid (99%), N-hydroxysuccinimide (NHS, 99%), dicyclohexylcarbodiimide (DCC, 99%), fetal bovine serum (FBS), dulbecco's modified Eagle's medium (DMEM), 3-(4,5-dimethyl-thiazol-2-yl)-2,5-diphenyl tetrazolium bromide (MTT), and doxorubicin (DOX) hydrochloride (>98%) were all purchased from Sigma-Aldrich. Phosphate buffered saline buffer (PBS, pH = 7.4) was prepared in our own lab. All other chemicals and solvents of analytical grade were provided by Sinopharm Chemical Reagent Co., Ltd and used as received without further purification. Millipore water was used throughout.
000, degree of acetylation ≥ 95%) were provided by Sinopharm Chemical Reagent Co., Ltd, China. 1-Octadecene (98%), oleic acid (99%), N-hydroxysuccinimide (NHS, 99%), dicyclohexylcarbodiimide (DCC, 99%), fetal bovine serum (FBS), dulbecco's modified Eagle's medium (DMEM), 3-(4,5-dimethyl-thiazol-2-yl)-2,5-diphenyl tetrazolium bromide (MTT), and doxorubicin (DOX) hydrochloride (>98%) were all purchased from Sigma-Aldrich. Phosphate buffered saline buffer (PBS, pH = 7.4) was prepared in our own lab. All other chemicals and solvents of analytical grade were provided by Sinopharm Chemical Reagent Co., Ltd and used as received without further purification. Millipore water was used throughout.
2.2. Synthesis of CuS nanoparticles
0.2 mmol of CuCl2·2H2O, 0.5 mmol of Na2S and 10 mmol of oleic acid were mixed in 35 mL of 1-octadecene in a three-neck flask at room temperature under vigorous stirring 10 min. The mixture was heated to 50 °C in vacuum to remove residual water and oxygen. Then the mixture was further heated to 170 °C and reacted for 5 h under nitrogen atmosphere. After cooling down to room temperature naturally, precipitates (CuS nanoparticles) were collected by centrifugation at 7260g for 30 min and washed with ethanol several times. Subsequently, a mixture of as-synthesized CuS nanoparticles, 15 mmol of thiolated oleic acid, 40 mmol of 1-octadecene and 40 mmol of ethanol were stirred for 48 h at room temperature for ligand exchange. The oleic acid-capping CuS nanoparticles were obtained by centrifugation at 20![[thin space (1/6-em)]](https://www.rsc.org/images/entities/char_2009.gif) 490g for 30 min and washing repeatedly with deionized water.
490g for 30 min and washing repeatedly with deionized water.
2.3. Preparation of CuS(DOX)@CS nanospheres
As-synthesized CuS nanoparticles were mixed with 20 mmol of NHS in 25 mL of anhydrous dimethyl formamide (DMF), to which 100 mmol of DCC was added slowly and the mixture was allowed to react under stirring for 24 h at room temperature in nitrogen atmosphere. Thereafter, the mixture was filtered, thoroughly washed by ethyl ether and rotation-evaporated to obtain CuS nanoparticles capped by oleic acid N-hydroxysuccinimide ester. The modified CuS nanoparticles were dispersed in ethanol, which was then added drop-wise to 25 mL of a CS (0.2 g)/aqueous acetic acid (1 wt%) solution at 95 °C to react for 36 h under stirring. The resultant mixture was cooled down to room temperature and precipitated by adding acetone and adjusting pH to 9.0. The precipitates were filtered, washed with acetone three times, air-dried and redispersed in aqueous acetic acid. The degree of substitution on CS was 11.4 ± 0.3% (n = 5) based on ninhydrin assay.20 DOX·HCl was then added into the above aqueous acetic acid solution of CuS@CS at room temperature. The predetermined weight ratio of DOX to CuS@CS was 1![[thin space (1/6-em)]](https://www.rsc.org/images/entities/char_2009.gif) :
:![[thin space (1/6-em)]](https://www.rsc.org/images/entities/char_2009.gif) 10. The resultant solution was stirred in the open air for 10 min, whose pH was then adjusted to 7.4. After stirring for another 30 min, the solution was dialyzed against water to remove free DOX.
10. The resultant solution was stirred in the open air for 10 min, whose pH was then adjusted to 7.4. After stirring for another 30 min, the solution was dialyzed against water to remove free DOX.
2.4. Determination of DOX loading
Loading content (LC) and loading efficiency (LE) of DOX in the CuS(DOX)@CS nanospheres were calculated by the following equations:| LCDOX = (weight of loaded DOX/weight of nanospheres) × 100% |
| LEDOX = (weight of loaded DOX/weight of DOX in feed) × 100% |
The amount of DOX left in the supernatant after centrifugation was determined by measuring the UV-vis absorbance at 485 nm, and the loading of DOX was obtained accordingly.
2.5. Characterization
Morphology observation and energy dispersive X-ray (EDX) analysis were performed using a JEM-2100 transmission electron microscope equipped with EDX spectrometry (TEM, JEOL, Japan). A small amount of sample solution was dropped on a carbon-coated copper grid, which was then freeze-dried in vacuum at −50 °C before testing. Size distribution and zeta potential were determined by a Nano ZS90 particle size and zeta potential analyzer (Malvern, UK) based on dynamic light scattering (DLS). Fourier transform infrared (FTIR) spectroscopy was performed on a NEXUS 670 FT-IR&Raman spectrometer (Thermo Nicolet, US). Thermogravimetry analysis (TGA) was conducted on a Q5000IR thermogravimetric analyzer (TA, US), with the samples heated under nitrogen flow from room temperature to 800 °C at a rate of 20 °C min−1. Absorption spectra were recorded by a Lambda 35 UV-vis spectrophotometer (PerkinElmer, US).2.6. Measurement of DOX release
2 mL of CuS(DOX)@CS/PBS solutions (1 mg mL−1) was transferred into a dialysis tube with a molecular weight cut off of 1000 Da, which was then immersed in a beaker filled with 50 mL of PBS buffer at varied pH values (5, 6 and 7.4) to be measured at 37 °C. At preset time intervals, 5 mL of external solution was withdrawn and analyzed using a Synergy 2 Multi-Mode Reader (BioTek, US). The beaker was immediately refilled with 5 mL of fresh PBS of the same composition and pH for the next sampling. The cumulative release of DOX was determined by measuring the fluorescence intensity at 580 nm under excitation at 485 nm. The experiments were performed in triplicate.2.7. Photothermal heating experiment
Different concentrations of CuS(DOX)@CS nanospheres dispersed in water by ultrasonication were filled in a 1 mL-quartz cuvettes, irradiated by a 0–1 W adjustable 980 nm semiconductor laser with 5 mm diameter laser module (Xi'an Minghui Optoelectronic Technology, China) for 5 min. The output power was independently calibrated using a hand-held optical power meter (Newport model 1918-C, CA, USA) and the power density was calculated based on the power and the light spot size. The temperature of the nanosphere dispersions was measured by a digital thermometer with a thermocouple (±0.1 °C) inserted into the nanosphere dispersions every 20 s. Pure water was irradiated by the same NIR laser, the temperature change of which was also recorded as control. An infrared thermal imager (GX-A300, Zhuhai, China) was used for observing the temperature changes of the nanosphere dispersions.2.8. Cell imaging
HeLa cells and NIH 3T3 cells provided by Institute of Biochemistry and Cell Biology, Chinese Academy of Science (CAS), were cultured according to the protocols reported in our previous work.26 0.5 mL of HeLa cell suspension was transferred to an eight-well Lab-Tek II chamber slide (Nalge Nunc, Napevillem, IL), followed by removing the culture medium and addition of a CuS (DOX)@CS/PBS solution (10 µg mL−1). The cells were incubated with the nanospheres for 4 h to allow internalization. Then the medium was aspirated from the wells, and the cells were further incubated for 12 h. Thereafter, the cells were rinsed with ice-cold PBS and fixed with 4% paraformaldehyde for 20 min. The nuclei were counterstained with 4′,6-diamidino-2-phenylindole (DAPI). The cell fluorescence excited at 358 nm or 488 nm was observed by using a confocal laser scanning microscope (Zeiss LSM 710, Germany).2.9. Cellular uptake study
HeLa cells were seeded in 96-well culture plates at a density of ∼5000 cells per well and incubated at 37 °C for 24 h. To study the endocytosis mechanism of CuS (DOX)@CS nanospheres, the cells were pre-incubated with an RPMI-1640 medium containing one of the following specific endocytotic inhibitors for 2 h: 10 µg mL−1 chlorpromazine, 6 µg mL−1 indomethacin, and 8 µg mL−1 colchicine. The cells were then rinsed three times with fresh culture medium and treated with 10 µg mL−1 CuS (DOX)@CS nanospheres for 4 h. Internalization of the nanospheres was evaluated using an Image Xpress® Micro instrument (Molecular Devices, Metaxpress, US).2.10. MTT assay
Cytotoxicity of free DOX, CuS nanoparticles, and CuS(DOX)@CS nanospheres under different conditions was evaluated by MTT viability assay. HeLa cells and NIH 3T3 cells were seeded in 96-well culture plates at a density of ∼5000 cells per well and incubated at 37 °C for 24 h to attach the cells. The culture medium in each well was then replaced by a fresh medium containing DOX, CuS nanoparticles, or CuS(DOX)@CS nanospheres at different concentrations. At 4 h after incubation, one group of cells containing CuS nanoparticles and one group of cells containing CuS(DOX)@CS nanospheres were exposed to 980 nm laser at a power density of 0.7 W cm−2 for 5 min for photothermal treatment. After further incubation for 24 h, the culture plates were rinsed with a PBS buffer (0.01 M, pH 7.4) to remove unattached cells and the remaining cells were treated with 5 mg mL−1 MTT stock solution in PBS for 4 h. The medium containing unreacted MTT was then carefully removed. The obtained formazan was dissolved in DMSO, and the absorbance of individual wells was recorded at 570 nm using a Multiskan MK3 Enzyme-labeled Instrument (Thermo Scientific, US). Cytotoxicity of CuS@CS to the HeLa cells and the NIH 3T3 cells for an incubation time of 24 h or 48 h was also evaluated.2.11. Cell cycle assay
HeLa cells were seeded in 6-well plates at a density of 5.8 × 10⁵ cells per well in 1.5 mL of complete DMEM and cultured for 24 h for attachment. The cells were respectively treated with PBS, DOX, CuS(DOX)@CS nanospheres, CuS nanoparticles exposed to 980 nm-laser irradiation and CuS(DOX)@CS nanospheres exposed to 980 nm-laser irradiation (0.7 W cm−2, 5 min) at the same concentration of 0.5 mg mL−1 for 4 h. Then the cells were further incubated for 24 h. Untreated HeLa cells were used as a control. For cell cycle analysis, treated cells were washed with ice-cold PBS three times, fixed with 75% ethanol at 4 °C overnight and treated with Rnase A for 45 min at 37 °C, followed by PI staining for 30 min in the dark. The cell cycle experiment was conducted on the flow cytometry (BD FACS Calibur, US).2.12. Animal tumor model
A mouse HeLa tumor model was used to evaluate in vivo tumor inhibition by CuS(DOX)@CS nanospheres. All experiments were carried out in strict accordance with the NIH guidelines for the care and use of laboratory animals (NIH publication no. 85-23 Rev. 1985) and were approved by the Animal Ethics Committee of Shanghai Jiao Tong University (Shanghai, China). Seven weeks old female BALB/c mice (∼18–19 g) were provided by Institute of Biochemistry and Cell Biology, CAS. HeLa cells were washed twice in PBS and re-suspended in sterile normal saline. The cell suspension containing 1 × 10⁵ HeLa cells was injected subcutaneously in the flank region of the mice to achieve tumor inoculation. The tumors were allowed to grow to a volume of ∼100 mm3. The HeLa tumor-bearing mice were randomly divided into five groups. The mice in groups 1 to 3 were treated with tail vein injections of PBS, DOX (dose of 0.44 mg kg−1 body weight) and CuS(DOX)@CS nanospheres (19.4 mg kg−1), respectively. The mice in groups 4 and 5 were injected intravenously with CuS nanoparticles (19.2 mg kg−1) and CuS(DOX)@CS nanospheres (20 mg kg−1), followed by 980 nm-laser irradiation (0.7 W cm−2, for 5 min) at 24 h post-injection. The treatments for the five groups of mice were repeated every other day for a total of 18 days.3. Results and discussion
3.1. Morphology and structure
The morphology and size distribution of CuS nanoparticles are shown in Fig. 2a and b. The CuS nanoparticles had spherical profiles with a narrow size distribution, with an average diameter of 13.3 ± 2.4 nm. EDX analysis confirmed the chemical composition of the CuS nanoparticles (Fig. 2c). The TEM image in Fig. 2d shows the morphology of CuS(DOX)@CS nanospheres. It can be seen that the CuS(DOX)@CS nanospheres possessed core–shell structure, with the CuS nanoparticle encapsulated by an oleyl-CS shell. The size distribution of the CuS(DOX)@CS nanospheres determined based on DLS is shown in Fig. 2e. The nanospheres had an average diameter of 31.8 ± 6.2 nm and a polydispersity index (PDI) of 0.175.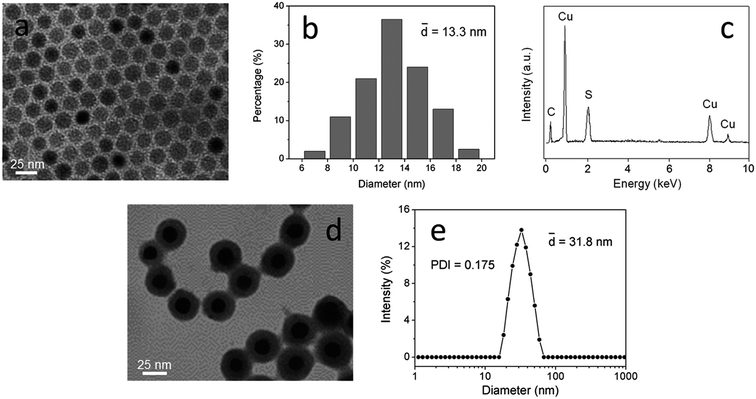 | ||
| Fig. 2 (a) TEM image and (b) size distribution histograms of CuS nanoparticles. (c) EDX spectrum of CuS nanoparticles. (d) TEM image and (e) size distribution of CuS(DOX)@CS nanospheres at pH 7.4. | ||
FTIR spectroscopy was used to confirm the conjugation of the oleic acid-capping CuS nanoparticles with the CS. In the FTIR spectra (Fig. 3a), CuS@CS exhibited increasing absorption peaks at 1665 cm−1 and 1572 cm−1 compared with CS, attributable to C![[double bond, length as m-dash]](https://www.rsc.org/images/entities/char_e001.gif) O stretching vibration (amide I band) and N–H bending vibration (amide II band) of amide groups, respectively. The absorption band at 2870–2935 cm−1 corresponding to –(CH2)– of the CuS@CS increased dramatically compared with the CS. Besides, the absorption at 1430 cm−1 assigned to bending vibration of the –(CH2)– increased slightly. These results demonstrate that the CuS nanoparticles were successfully conjugated with the CS. TG analysis was employed to determine the CuS content in the CuS@CS nanospheres. As shown in Fig. 3b, the mass of CuS@CS nanospheres decreased with the increase of temperature and leveled off beyond 700 °C. The remaining mass at 800 °C was 8.36% of the total, which was considered as the content of CuS nanoparticles in the CuS@CS nanospheres.
O stretching vibration (amide I band) and N–H bending vibration (amide II band) of amide groups, respectively. The absorption band at 2870–2935 cm−1 corresponding to –(CH2)– of the CuS@CS increased dramatically compared with the CS. Besides, the absorption at 1430 cm−1 assigned to bending vibration of the –(CH2)– increased slightly. These results demonstrate that the CuS nanoparticles were successfully conjugated with the CS. TG analysis was employed to determine the CuS content in the CuS@CS nanospheres. As shown in Fig. 3b, the mass of CuS@CS nanospheres decreased with the increase of temperature and leveled off beyond 700 °C. The remaining mass at 800 °C was 8.36% of the total, which was considered as the content of CuS nanoparticles in the CuS@CS nanospheres.
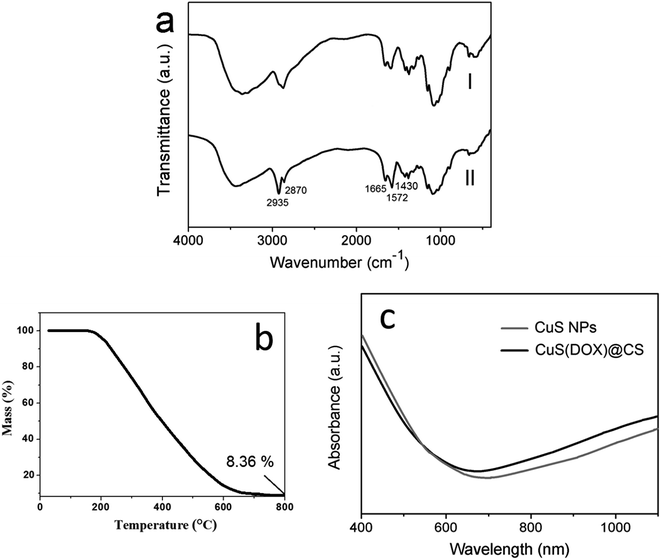 | ||
| Fig. 3 (a) FTIR spectra of CS(I) and CuS@CS(II). (b) TG curve of CuS@CS nanospheres. (c) Absorption spectra of CuS nanoparticles and CuS@CS nanospheres. | ||
The absorption spectra of CuS nanoparticles and CuS@CS nanospheres are shown in Fig. 3c. An absorption band edged at ∼600 nm appeared in both spectra, which corresponds to a band gap of 2.07 eV. In addition, a significant absorption increase in the NIR region was observed, ascribed to inter band transitions from valence states to the unoccupied states (indirect band gap).27 It can be seen that the absorption intensity of the CuS@CS nanospheres was similar to that of the CuS nanoparticles in the NIR region, indicating that the NIR energy absorption of the CuS nanoparticles is hardly changed by the conjugation with CS.
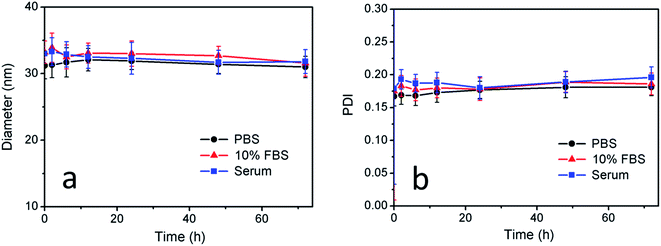
Furthermore, the size and PDI of CuS(DOX)@CS nanospheres in PBS buffer, 10% FBS and human serum at 37 °C were monitored over a period of 72 h to examine the stability of the nanospheres. The average diameter and PDI values at certain time points were determined by DLS tests. As can be seen in Fig. 4, both diameter and PDI changed slightly in the data range in all the three media, indicating that the CuS(DOX)@CS nanospheres will keep stable under physiological conditions.
3.2. Anticancer drug release
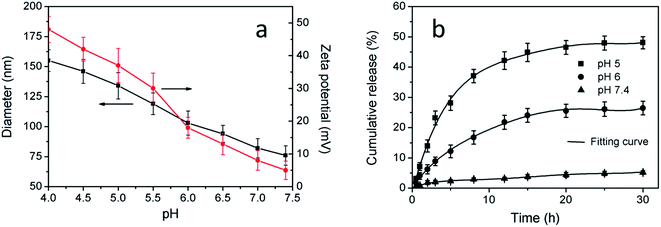
Influences of pH on the diameter and zeta potential of the CuS (DOX)@CS nanospheres were investigated to show their pH responsiveness (Fig. 5a). At pH values much lower than the pKa of CS, the amine groups on the CS shell were strongly protonated, as indicated by the high zeta potential. The charge repulsion between the protonated amine groups dominated, leading to polymer chain extension20 and thus a larger size of the nanospheres. As pH increased, the electrostatic repulsion between the CS polymeric chains was reduced along with the deprotonation tendency of the amine groups, which was reflected by reduced zeta potential. At pH values above the pKa, the hydrophobic interaction between the oleoyl chains dominated, giving rise to decreasing size of the nanospheres. This pH-triggered transition from a stretching structure to a contracting structure enables the nanospheres to act as an on–off switch in response to ambient pH changes.The release of DOX from the CuS(DOX)@CS nanospheres at three distinct pH values was measured based on the typical fluorescence emission of DOX. The DOX release profiles showed different release behaviors at varied pH values (Fig. 5b). Most of the DOX molecules were entrapped within the compact nanospheres under a neutral condition, leaving a small dose of DOX released. When the pH was lowered, the nanospheres were swollen as the molecular chains of the shell stretched, and thus more DOX molecules were released. It is known that the pH in endosomes and lysosomes of cancer cells is usually in the range of 4.5–5.5.28 The acidic environment will trigger the intracellular DOX release from the nanospheres. The rapidly released DOX will act on the nucleus of cancer cells and kill the cells efficiently.
3.3. Photothermal properties
To investigate their photothermal performance, aqueous dispersions of CuS(DOX)@CS nanospheres with different concentrations were prepared and exposed to continuous irradiation of the 980 nm laser at varied power densities. Fig. 6a shows the temperature changes of the 0.5 mg mL−1 nanosphere dispersion under irradiation of different power density over a period of 5 min. With increasing irradiation power density, the temperature elevation was more significant, as expected. Temperature changes of the nanosphere dispersions with different concentrations were also recorded under irradiation of the NIR laser at 0.7 W cm−2 (Fig. 6b), due to the collective heating effect of the nanospheres. It is noticed that the 0.5 mg mL−1 nanosphere dispersion was heated from 24.8 °C to 39.3 °C under the NIR irradiation of 0.7 W cm−2. The temperature increase in 5 min is sufficient for PTA. Therefore, the biologically safe power density of 0.7 W cm−2 was chosen in the following cell assay. Infrared thermographs can provide visualized information about the photothermal conversion of the CuS(DOX)@CS nanospheres. The infrared thermographs reveal the temperature increase of the nanospheres under the NIR irradiation, which was more obvious at higher concentrations (Fig. 6 inset).3.4. In vitro cell uptake and anticancer efficacy
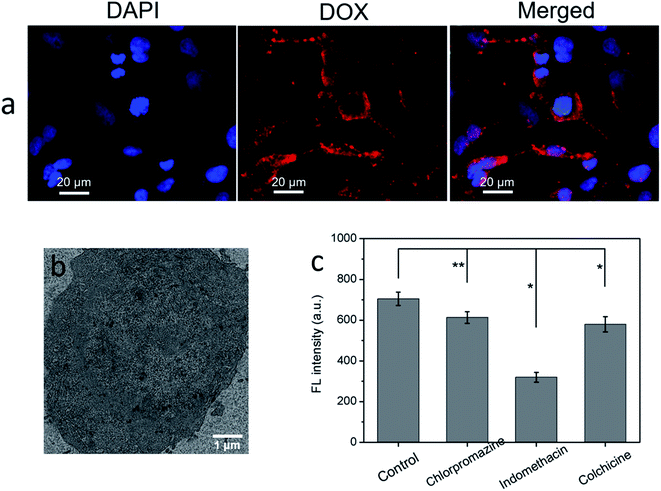
The HeLa cells containing CuS(DOX)@CS nanospheres were imaged by fluorescence microscopy to observe intracellular release of DOX. After internalization of the nanospheres, the cells were incubation for another 12 h for intracellular DOX release. Then the cells were stained by DAPI and observed under excitation at different wavelengths. The nanospheres entered endosomes/lysosomes and became swollen at lowered pH, which turned on the release of the entrapped DOX, as evidenced by the readily observable red emission characteristic of DOX (Fig. 7a). Therefore, the CuS(DOX)@CS nanospheres are capable of releasing DOX in response to the reduced pH in the cancer cells. Meanwhile, the uptake of CuS(DOX)@CS nanospheres by HeLa cells was investigated by TEM technique. The TEM image of a HeLa cell after 4 h incubation with the CuS(DOX)@CS nanospheres (Fig. 7b) reveals that the nanospheres were internalized into the cells.Furthermore, the effects of specific endocytotic inhibitors on cellular uptake of CuS(DOX)@CS nanospheres were examined to explore the endocytosis mechanism of the nanospheres (Fig. 7c). Compared with the control (no inhibitor), the cellular fluorescence intensity of DOX decreased significantly after treating with indomethacin (caveolae-mediated endocytosis inhibitor), suggesting that the caveolae-mediated endocytosis may dominate the cellular uptake of the nanospheres. Only slight cellular uptake inhibition of the nanospheres was observed after treatment with chlorpromazine (clathrin mediated endocytosis inhibitor) or with colchicine (macropinocytosis inhibitor), indicating the endocytosis processes were only slightly dependent of clathrin and macropinocytosis.
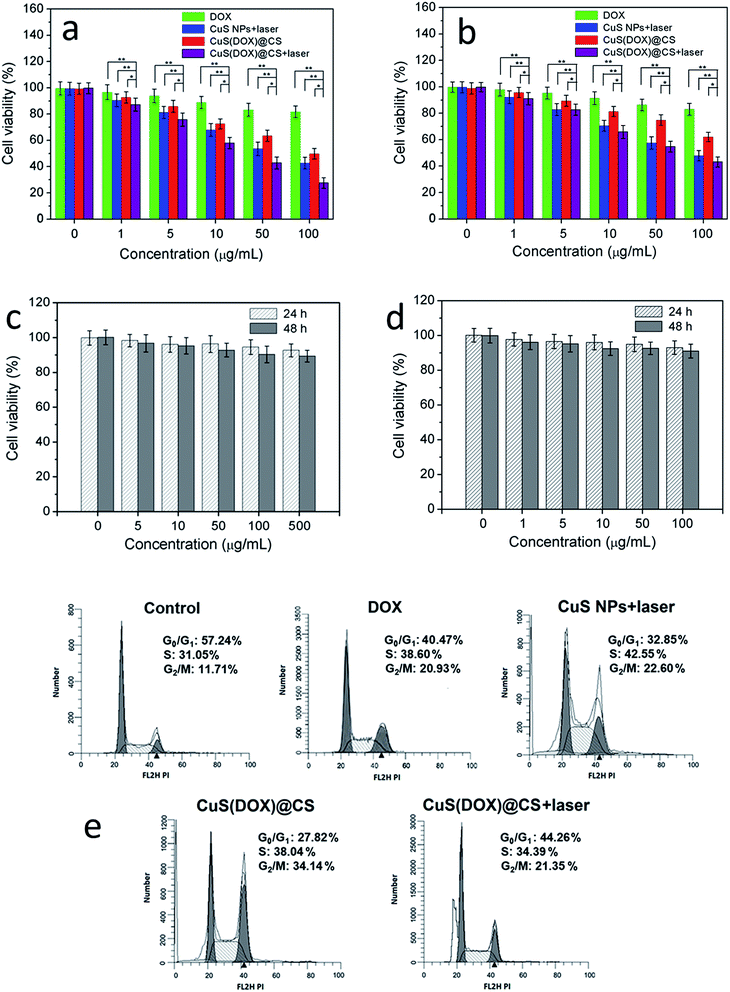
The proliferation of HeLa cells and non-cancerous NIH 3T3 cells inhibited by CuS(DOX)@CS nanospheres under NIR-laser irradiation was evaluated by MTT assay (Fig. 8a and b). The cells were incubated with free DOX, CuS nanoparticles and CuS(DOX)@CS nanospheres respectively at different concentrations for cell uptake. A group of cells containing CuS nanoparticles and a group of cells containing CuS(DOX)@CS nanospheres were subjected to 980 nm-laser irradiation at 0.7 W cm−2 for 5 min. The cells were further incubated for 24 h and analyzed by MTT assay. With the increase of concentration, the viability of HeLa cells treated with free DOX did not show significant decrease, due to the multidrug resistance (MDR) effect and thus insufficient intracellular DOX dose to kill the cancer cells. The cells treated with CuS nanoparticles plus NIR laser irradiation showed more significant proliferation inhibition, indicating the cell-killing ability of CuS nanoparticles by PTA. The viability of the cells treated with CuS(DOX)@CS nanospheres exhibited an obvious downward trend with the increase of concentration, as the MDR effect was reduced when the nanoscaled pH-responsive drug carriers were used. When treated with CuS(DOX)@CS nanospheres in combination with NIR laser irradiation, the cell proliferation inhibition increased dramatically with increasing concentration. The cell viability was lower than those treated with CuS nanoparticles plus NIR laser irradiation and CuS(DOX)@CS nanospheres alone, which was more obvious in the high-concentration range. To the NIH 3T3 cells, the CuS(DOX)@CS nanospheres with and without laser irradiation caused less toxicity than to the HeLa cells, confirming the anticancer effect of the CuS(DOX)@CS nanospheres. The toxicity of CuS@CS to both HeLa cells and NIH 3T3 cells without NIR laser irradiation was also examined (Fig. 8c and d). In the data range, the cell viability was above 90%, indicating low cytotoxicity of the drug carriers. These results demonstrate that the CuS(DOX)@CS nanospheres have enhanced cancer-cell killing efficacy by combined DOX release and PTA.
Moreover, the effects of CuS(DOX)@CS nanospheres on cell cycle were evaluated by measuring DNA content using flow cytometry. The HeLa cells were treated for 24 h with PBS (control), DOX, CuS nanoparticles plus 980 nm-laser irradiation, CuS(DOX)@CS nanospheres and CuS(DOX)@CS nanospheres plus 980 nm-laser irradiation and then stained with PI. The results of flow cytometry experiments show that the cells treated with free DOX, CuS nanoparticles plus NIR irradiation and CuS(DOX)@CS nanospheres exhibited different cell cycles from that of the control cells. The percentage of G0/G1 phase decreased to 42.47%, 32.85% and 27.82%, respectively. The percentage of S phase increased to 36.60%, 42.55% and 38.04%, whilst the percentage of G2/M increased to 20.93%, 22.60% and 34.14%, respectively. When the cells were treated with CuS(DOX)@CS nanospheres plus NIR irradiation, the percentage of G2/M phase was similar to those of the cells treated with DOX, CuS nanoparticles plus NIR irradiation and CuS(DOX)@CS nanospheres. However, a sub-G1 peak was clearly observed before the G1 phase, which denotes the emerging apoptotic phase.
3.5. In vivo antitumor efficacy
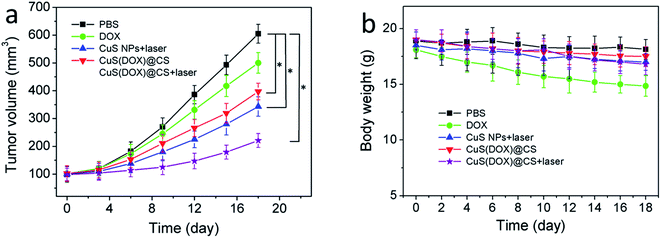
To examine whether the CuS(DOX)@CS nanospheres can be used for tumor therapy, free DOX, CuS nanoparticles, CuS(DOX)@CS nanospheres or PBS as a control was intravenously injected into BALB/c mice bearing a HeLa tumor via tail vein every other day. The tumor volume and body weight of the mice were monitored every other day for a total of 18 days (Fig. 9a and b). For two groups of mice treated with CuS nanoparticles and CuS(DOX)@CS nanospheres, respectively, the tumor site was irradiated by the 980 nm laser for 5 min (0.7 W cm−2) at 24 h postinjection. It is clear that the tumor growth was suppressed to a larger extent by CuS nanoparticles plus NIR irradiation and CuS(DOX)@CS nanospheres than by free DOX over 18 days. The CuS(DOX)@CS nanospheres plus NIR irradiation exhibited the highest tumor growth inhibitory efficacy, as implied by a 76% reduction in tumor volume after 18 days. The intracellular pH inside the tumor triggers the release of DOX from the CuS(DOX)@CS nanospheres, as demonstrated by the release curve at pH 5 in Fig. 5b. Large amounts of DOX molecules are released within 10 h and kill the cancer cells. Meanwhile, the nanospheres are heated by the NIR irradiation. According to Fig. 6, the nanospheres will be heated by ca. 15 °C at the power density of 0.7 W cm−2 for 5 min, and the tumor can thus be reduced by PTA. The synergistic treating effects are in good accordance with that found in cell experiments. Furthermore, the mice treated with DOX lost 17.9% of the body weight at the end of the 18 day period, showing side effects of DOX on the mice. The mice treated with other formulations did not show significant weight loss. The weight loss of the mice treated with CuS(DOX)@CS nanospheres was below 5%, indicating that the CuS(DOX)@CS nanospheres were well-tolerated without severe side effects.4. Conclusions
In summary, CuS(DOX)@CS nanospheres with pH responsiveness and photothermal conversion property have been synthesized for synergistic cancer therapy. Exposed to 980 nm-laser irradiation, the CuS(DOX)@CS nanospheres can be heated efficiently for PTA. On the other hand, the entrapped anticancer drug DOX can be released from the CuS(DOX)@CS nanospheres triggered by reduced pH typical of endosomes and lysosomes in cancer cells. The experimental results display that combination of DOX delivery and PTA has more potent tumor inhibition ability. These dual functional nanospheres may be promising nanoscaled agents for synergistic cancer therapy.Acknowledgements
This work was financially supported by the National Natural Science Foundation (Grant No. 51403125 and 11505110).References
- H. Y. Liu, D. Chen, L. L. Li, T. L. Liu, L. F. Tan, X. L. Wu and F. Q. Tang, Angew. Chem., Int. Ed., 2011, 50, 891–895 CrossRef CAS PubMed.
- K. Yang, J. M. Wan, S. Zhang, B. Tian, Y. J. Zhang and Z. Liu, Biomaterials, 2012, 33, 2206–2214 CrossRef CAS PubMed.
- S. Lal, S. E. Clare and N. J. Halas, Acc. Chem. Res., 2008, 41, 1842–1851 CrossRef CAS PubMed.
- Z. B. Zha, S. H. Zhang, Z. J. Deng, Y. Y. Li, C. H. Li and Z. F. Dai, Chem. Commun., 2013, 49, 3455–3457 RSC.
- C. M. Hessel, V. P. Pattani, M. Rasch, M. G. Panthani, B. Koo, J. W. Tunnell and B. A. Korgel, Nano Lett., 2011, 11, 2560–2566 CrossRef CAS PubMed.
- Q. Xiao, X. Zheng, W. Bu, W. Ge, S. Zhang, F. Chen, H. Xing, Q. Ren, W. Fan, K. Zhao, Y. Hua and J. Shi, J. Am. Chem. Soc., 2013, 135, 13041–13048 CrossRef CAS PubMed.
- Z. Zha, S. Wang, S. Zhang, E. Qu, H. Ke, J. Wang and Z. Dai, Nanoscale, 2013, 5, 3216–3219 RSC.
- M. Zhou, R. Zhang, M. A. Huang, W. Lu, S. L. Song, M. P. Melancon, M. Tian, D. Liang and C. Li, J. Am. Chem. Soc., 2010, 132, 15351–15358 CrossRef CAS PubMed.
- X. Bu, D. Zhou, J. Li, X. Zhang, K. Zhang, H. Zhang and B. Yang, Langmuir, 2014, 30, 1416–1423 CrossRef CAS PubMed.
- Q. Tian, M. Tang, Y. Sun, R. Zou, Z. Chen, M. Zhu, S. Yang, J. Wang, J. Wang and J. Hu, Adv. Mater., 2011, 23, 3542–3547 CrossRef CAS PubMed.
- L. Tan, Z. Wu, X. Wang and J. Sun, RSC Adv., 2015, 5, 35317–35324 RSC.
- L. Tan, S. Liu, X. Li, I. S. Chronakis and Y. M. Shen, Colloids Surf., B, 2015, 125, 222–229 CrossRef CAS PubMed.
- J. T. Robinson, K. Welsher, S. M. Tabakman, S. P. Sherlock, H. L. Wang, R. Luong and H. J. Dai, Nano Res., 2010, 3, 779–793 CrossRef CAS PubMed.
- Q. Yang, C. He, Y. Xu, B. Liu, Z. Shao, Z. Zhu, Y. Hou, B. Gong and Y. M. Shen, Polym. Chem., 2015, 6, 1454–1464 RSC.
- L. Tan, A. Wan, H. Li and Q. Lu, Acta Biomater., 2012, 8, 3744–3753 CrossRef CAS PubMed.
- L. Tan, A. Wan and H. Li, ACS Appl. Mater. Interfaces, 2013, 5, 11163–11171 CAS.
- M. Rinaudo, Prog. Polym. Sci., 2006, 31, 603–632 CrossRef CAS.
- K. J. Chen, Y. L. Chiu, Y. M. Chen, Y. C. Ho and H. W. Sung, Biomaterials, 2011, 32, 2586–2592 CrossRef CAS PubMed.
- A. Montembault, C. Viton and A. Domard, Biomacromolecules, 2005, 6, 653–662 CrossRef CAS PubMed.
- Y. L. Chiu, S. C. Chen, C. J. Su, C. W. Hsiao, Y. M. Chen, H. L. Chen and H. W. Sung, Biomaterials, 2009, 30, 4877–4888 CrossRef CAS PubMed.
- M. Karimi, A. Ghasemi, P. Sahandi Zangabad, R. Rahighi, S. M. Moosavi Basri and H. Mirshekari, Chem. Soc. Rev., 2016, 45, 1457–1501 RSC.
- N. Kamaly, B. Yameen, J. Wu and O. C. Farokhzad, Chem. Rev., 2016, 116, 2602–2663 CrossRef CAS PubMed.
- E. Yamamoto and K. Kuroda, Bull. Chem. Soc. Jpn., 2016, 89, 501–539 CrossRef CAS.
- M. X. Zhao, E. Z. Zeng and B. J. Zhu, ChemNanoMat, 2015, 1, 82–91 CrossRef CAS.
- M. E. F. Brollo, R. López-Ruiz, D. Muraca, S. J. A. Figueroa, K. R. Pirota and M. Knobel, Sci. Rep., 2014, 4, 6839 CrossRef CAS PubMed.
- L. Tan, R. Huang, X. Li, S. Liu, Y. M. Shen and Z. Shao, Carbohydr. Polym., 2017, 157, 325–334 CrossRef CAS PubMed.
- L. F. Chen, W. Yu and Y. Li, Powder Technol., 2009, 191, 52–54 CrossRef CAS.
- H. Xu, D. Yang, C. Cai, J. Gou, Y. Zhang, L. Wang, H. Zhong and X. Tang, Acta Biomater., 2015, 16, 156–168 CrossRef CAS PubMed.
| This journal is © The Royal Society of Chemistry 2017 |

