 Open Access Article
Magnetic ZnFe2O4@chitosan encapsulated in graphene oxide for adsorptive removal of organic dye†
Xi-Lin Wu,
Peiyuan Xiao,
Shuxian Zhong,
Keming Fang,
Hongjun Lin and
Jianrong Chen *
*
College of Geography and Environmental Sciences, College of Chemistry and Life Science, Zhejiang Normal University, Jinhua, 321004, China. E-mail: cjr@zjnu.cn; Fax: +86 579 82282273; Tel: +86 579 82291275
First published on 26th May 2017
Abstract
Graphene-based multifunctional composites were prepared by encapsulating of magnetic ZnFe2O4@chitosan (ZnFe2O4@CS) particles into graphene oxide (GO) layers. The obtained ZnFe2O4@CS/GO were characterized using scanning electron microscopy, X-ray diffraction, Fourier transform infrared spectroscopy and X-ray photoelectron spectroscopy. Adsorption of basic fuchsin (BF) onto the ZnFe2O4@CS/GO was investigated using pH, adsorption time, initial BF concentration and temperature. Kinetic data and adsorption isotherms were better fitted by a pseudo-second-order kinetic model and Langmuir isotherm model, respectively. The values of activation parameters such as free energy (ΔG, −14.02 to −16.56 kJ mol−1), enthalpy (ΔH, 23.27 kJ mol−1) and entropy (ΔS, 127.75 J mol−1 K−1) were calculated, suggesting that the adsorption was a spontaneous, favorable and endothermic process in nature. The results demonstrated that the ZnFe2O4@CS/GO composites are potentially suitable materials for the removal of organic dyes from large volumes of wastewater.
Introduction
Dyes are a chemical product that are produced in large quantities, and are widely used in rubbers, pesticides, plastics, textiles, cosmetics, varnishes, dyestuffs and the food industry.1,2 Discharge of dyeing effluent into natural waters puts aquatic biota and humans at risk because of their potential mutagenic and carcinogenic effects.1 Various methods such as adsorption, oxidation, ion exchange, biological treatments, membrane filtration, and photocatalytic degradation have been used for removal of dyes from effluent.3–5 Among these methods, adsorption is one of the most studied methods because of its high efficiency, simplicity, and low cost.6,7 Traditional adsorbents such as activated carbon (AC) have excellent adsorption abilities for organic dyes, however, their high price and low efficiency cannot meet the needs of the rapid development of modern water supplies and water treatment systems.Graphene has been studied extensively over the past few years because of its unique properties such as large surface area, high mechanical strength and superior thermal conductivity.8 To date, chemically exfoliated graphene oxide (GO) obtained from graphite has been considered as a promising substrate for the preparation of all kinds of graphene-based nanocomposites.9 The high surface area and tunable surface functional groups make graphene composites very good candidates as adsorbents for the removal of organic pollutants. For example, Ai et al. fabricated graphene/Fe3O4 composites and studied their applications for removal of methylene blue (MB).10 Chen et al. studied the application of graphene oxide–chitosan (GO–CS) composite hydrogels for the removal of organic dyes and found that the GO–CS composites showed maximal adsorption capacities towards cationic MB and anionic eosin Y with values of both being higher than 300 mg g−1.11 Recently, magnetic nanoparticle loaded adsorbent materials have been the subject of extensive attention because of their gentle operating conditions, easily manipulated process and high separation efficiency.12 Decoration of graphene with magnetic nanoparticles can endow them with magnetic properties, making them promising candidates as excellent adsorbents.
Chitosan, one of the most abundant natural biopolymers, has attracted enormous interest because of its excellent properties such as biocompatibility, biodegradability and strong adhesion.13,14 In addition, CS it is easy to attach it chemically to other materials because of the presence of abundant amino groups and hydroxyl groups. As an environmental friendly and nontoxic material, CS has been studied extensively as an adsorbent for the removal of organic dyes and heavy metal ions.15 However, the low mechanical strength of CS hydrogel restricts its applications in adsorbents.16 A combination of CS with chemical and mechanically stable graphene may improve its mechanical properties, and at the same time increases the biocompatibility. Magnetic CS not only has the inherent very good candidates as adsorbents for the removal of organic advantages of CS but also exhibit its magnetic properties. Thus, the incorporation of magnetite CS with graphene sheets may lead to novel composite materials with multifunctional properties.
In this research, magnetite chitosan encapsulated into GO sheets were fabricated. The zinc iron oxide (ZnFe2O4)@CS/GO composites obtained were applied as a novel adsorbent for the removal of organic dyes. Basic fuchsin (BF), an organic dye which is widely used in many industries such as paper and leather printing and dyeing, paint and ink, was selected as a model pollutant to evaluate the adsorption characteristics of ZnFe2O4@CS/GO under laboratory conditions. The information obtained will be useful for further research and practical applications of the novel nano-adsorbents in dyeing wastewater treatment.
Experimental section
Materials and characterizations
Graphite powder (99.95%), 1-(3-dimethylaminopropyl)-3-ethylcarbodiimide hydrochloride, glutaraldehyde and N-hydroxylsuccinimide were purchased from the Sigma-Aldrich Corporation. Chitosan (90%, molecular weight = 125![[thin space (1/6-em)]](https://www.rsc.org/images/entities/char_2009.gif) 000 g mol−1) was supplied by the China National Pharmaceutical Group (Shanghai, China). The reagents, iron(III) chloride (FeCl3), zinc chloride (ZnCl2) were obtained from the Zhanyun Chemical Industry Ltd. (Shanghai, China). Basic Fuchsin was purchased from the Guangfu Fine Chemical Research Institute (Tianjin, China). All the reagents used in this study were of analytical grade, and ultrapure water was used in the preparation of all solutions.
000 g mol−1) was supplied by the China National Pharmaceutical Group (Shanghai, China). The reagents, iron(III) chloride (FeCl3), zinc chloride (ZnCl2) were obtained from the Zhanyun Chemical Industry Ltd. (Shanghai, China). Basic Fuchsin was purchased from the Guangfu Fine Chemical Research Institute (Tianjin, China). All the reagents used in this study were of analytical grade, and ultrapure water was used in the preparation of all solutions.
Ultraviolet-visible (UV-vis) absorption spectra of the samples were recorded on a Lambda 950 UV-vis spectrophotometer (PerkinElmer, USA). X-ray diffraction (XRD) analysis was performed on a PW3040/60 automatic powder diffractometer (Philips) using Cu Kα radiation. Fourier transform infrared spectroscopy (FT-IR) was performed using a Nicolet NEXUS 670 (ThermoFisher Scientific) FT-IR spectrometer with samples in the form of potassium bromide pellets. X-ray photoelectron spectroscopy (XPS) was conducted on an ESCALAB 250 thermoelectron instrument (ThermoFisher Scientific) with Al Kα X-ray radiation as the source for excitation (1486.8 eV, 500 μm). Scanning electron microscope (SEM) was performed on a S-4800 (Hitachi) scanning electron microscope.
Synthesis of ZnFe2O4@CS/GO composites
Graphene oxide was prepared from purified natural graphite using the modified Hummers' method.17 The preparation of the ZnFe2O4@CS/GO composite is illustrated in Scheme 1. For the preparation of ZnFe2O4, 0.52 g of ZnCl2 and 1.0 g of FeCl3 were dissolved in 25 mL of ultrapure water, and 5 mL of ammonia solution was added dropwise into the solution under vigorous stirring. The mixture obtained was stirred in a water bath at 90 °C for 3 h. The final product was centrifuged and dried in a vacuum at 60 °C overnight. The dry powder was then ground and calcined in a muffle furnace (Thermconcept, Germany) at 650 °C for 2 h. For the preparation of CS coated ZnFe2O4, 0.30 g of CS was dissolved in 30 mL acetic acid solution (v/v 3%) and 0.10 g of magnetic particles were added to the CS solution under constant stirring. Then, 2.0 mL of glutaraldehyde was added into the mixture and stirred at 60 °C for 2 h. The precipitate was washed three times with ethanol and then three times with ultrapure water. Then, the precipitate was separated using an external magnet and dried in a vacuum at 60 °C. The product obtained was denoted as ZnFe2O4@CS.For the preparation of ZnFe2O4@CS/GO composites, A solution of 0.05 M EDC and 0.05 M NHS was added to the GO dispersion with continuous stirring for 2 h in order to activate the carboxyl groups of GO. The pH of the resulting solution was maintained at 7.0 using dilute sodium hydroxide. 0.1 g of magnetic chitosan and the activated GO solution were added in a flask and dispersed in distilled water by ultrasonic dispersion for 10 min. After ultrasonic dispersion, the mixed solutions were stirred at 60 °C for 2 h. The precipitate was washed with 2% (w/v) NaOH and distilled water in turn until pH was about 7. Then, the obtained product was collected by using an external magnet and dried in vacuum over night at 60 °C.
Adsorption experiments
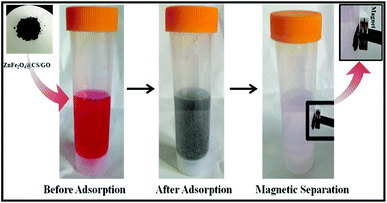
The black ZnFe2O4@CS/GO was used directly as an adsorbent for the removal of BF. As shown in Scheme 2, the ZnFe2O4@CS/GO powder can be easily dispersed in the dye solution. At the same time, the BF was adsorbed onto the ZnFe2O4@CS/GO. After the adsorption process, the dark red dye solution turned to very light red, indicating that most of the BF was absorbed by the adsorbent. All the adsorption experiments were performed on a SHA-C shaking water bath (Changzhou, China). For the water bath experiments, 25 mL of BF solution with a known concentration and 0.050 g of ZnFe2O4@CS/GO were added into a 50 mL poly(ethylene) tube. The mixture was shaken at 30 °C for different time intervals. After that, the solid in the suspension was separated immediately with the aid of a magnet and the concentration of the residual BF in the supernatant was determined using UV-vis spectrophotometry at a wavelength of 542 nm. For the adsorption isotherms, the concentrations of BF are in range of 10 to 200 mg L−1 and the suspensions were shaken for 24 h to achieve the adsorption equilibrium. It should be noted that the ZnFe2O4@CS/GO have good dispersion and can be easily separated from aqueous solution using a permanent magnet. There is no difference in the BF concentrations between the supernatant after centrifugation and the one after magnetic separation under the experimental uncertainties, suggesting that the ZnFe2O4@CS/GO can be separated by using magnetic separation technique in real applications. The adsorbed amount of BF on the ZnFe2O4@CS/GO was calculated using the difference of BF concentration in solution before and after adsorption, according to the following equation:where C0 and Ce are the initial and equilibrium concentrations of BF (mg L−1), respectively, V is the volume of the BF solution (L), and W is the weight of the ZnFe2O4@CS/GO used (g). The previous adsorption experiments were conducted in triplicate to obtain reproducible results with an error of <5%. For deviations larger than 5%, more experiments were carried out. The experimental data could be reproduced with an accuracy greater than 95%.
Results and discussions
Characterization of ZnFe2O4@CS/GO
Fig. 1A shows the typical SEM images of GO obtained using a modified Hummers' method. The GO presents the sheet-like structure with a smooth surface and wrinkled edge. Fig. 1B and C show the SEM images of the ZnFe2O4@CS/GO composites. It can be seen that a spherical protuberance appeared in the GO sheets with a wrinkled surface, revealing that the magnetic CS had been successfully encapsulated into the GO layers. The XRD patterns of pure ZnFe2O4 and ZnFe2O4@CS/GO are shown in Fig. 1D. Four characteristic peaks of ZnFe2O4 (2θ = 30.1°, 35.5°, 57.2° and 62.5°) were observed, corresponding to the four different crystal planes [(220), (311), (511), and (440)] of ZnFe2O4.18 The results of the XRD patterns also confirmed the successfully fabrication of the ZnFe2O4 encapsulated GO composites.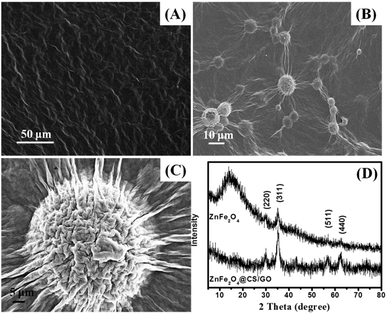 | ||
| Fig. 1 SEM images of GO (A) and ZnFe2O4@CS/GO (B and C), XRD pattern of ZnFe2O4 and ZnFe2O4@CS/GO (D). | ||
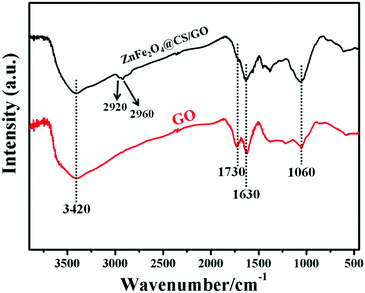
The FT-IR spectra of GO and ZnFe2O4@CS/GO are shown in Fig. 2. The peaks at 1060 and 1630 cm−1 correspond to the C–O–C stretching vibrations and the C![[double bond, length as m-dash]](https://www.rsc.org/images/entities/char_e001.gif) C stretching of the aromatic carbons. The C
C stretching of the aromatic carbons. The C![[double bond, length as m-dash]](https://www.rsc.org/images/entities/char_e001.gif) O stretching of COOH and O–H groups, at edges of GO sheets, are observed at 1730 and 3420 cm−1, respectively.19 In the FT-IR spectrum of ZnFe2O4@CS/GO, the characteristic absorbance bands centered at about 1630 cm−1 are attributed to the stretching vibration of C–O–C or –NHCO– (amide I).19,20 The in-plane N–H bending vibrations (at about 1530 and 1570 cm−1) cannot be observed in the FT-IR spectrum of ZnFe2O4@CS/GO,21 indicating that the –NH2 groups on the CS chains have reacted with the –COOH groups of GO. In addition, two small peaks are observed at 2920 and 2960 cm−1 which correspond to –CH2 vibration in the CS polymer chain.21 The results indicated that magnetic CS was successfully grafted on to GO.
O stretching of COOH and O–H groups, at edges of GO sheets, are observed at 1730 and 3420 cm−1, respectively.19 In the FT-IR spectrum of ZnFe2O4@CS/GO, the characteristic absorbance bands centered at about 1630 cm−1 are attributed to the stretching vibration of C–O–C or –NHCO– (amide I).19,20 The in-plane N–H bending vibrations (at about 1530 and 1570 cm−1) cannot be observed in the FT-IR spectrum of ZnFe2O4@CS/GO,21 indicating that the –NH2 groups on the CS chains have reacted with the –COOH groups of GO. In addition, two small peaks are observed at 2920 and 2960 cm−1 which correspond to –CH2 vibration in the CS polymer chain.21 The results indicated that magnetic CS was successfully grafted on to GO.
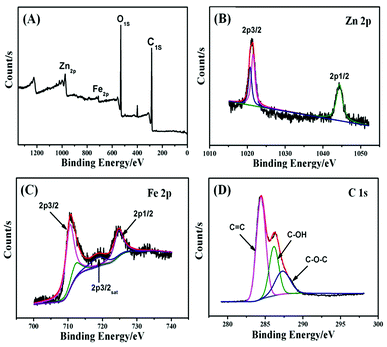
The ZnFe2O4@CS/GO sample was analyzed using XPS with a range of binding energies of 0–1300 eV (Fig. 3). The XPS survey (Fig. 3a) shows the photoelectron lines at binding energies of 284.9, 531.1, 709.2 and 975.5 eV which are attributed to C 1s, O 1s, Fe 2p, Zn 2p, respectively. The Zn 2p XPS spectrum is shown in Fig. 3b. Two peaks at a binding energies of 1021.7 eV (Zn 2p3/2) and 1044.8 eV (Zn 2p1/2) correspond to Zn2+ in the ZnFe2O4 phase.18 The Fe 2p XPS spectrum (Fig. 3c) shows two distinguishable main peaks at binding energies of about 711.0 and 724.9 eV, corresponding to Fe 2p3/2 and Fe 2p1/2, respectively. A satellite peak for Fe 2p3/2 which is visible at a binding energy of around 718.9 eV, is indicative of the presence of Fe3+ in the ZnFe2O4 phase.18 The deconvoluted C 1s spectra centered at the binding energies of 287.5, 286.3, and 284.7 eV were assigned to C–O–C, C–OH and C![[double bond, length as m-dash]](https://www.rsc.org/images/entities/char_e001.gif) C, respectively, (Fig. 3d). The results demonstrate that most carbon atoms were sp2 hybridized (C
C, respectively, (Fig. 3d). The results demonstrate that most carbon atoms were sp2 hybridized (C![[double bond, length as m-dash]](https://www.rsc.org/images/entities/char_e001.gif) C) and a large number of oxygenated functional groups exist (HO–C
C) and a large number of oxygenated functional groups exist (HO–C![[double bond, length as m-dash]](https://www.rsc.org/images/entities/char_e001.gif) O, C–O–C, and C–OH) in ZnFe2O4@CS/GO.
O, C–O–C, and C–OH) in ZnFe2O4@CS/GO.
Effect of pH on adsorption
Solution pH is an important control parameter in the adsorption process. The chemical structure of BF is shown in Fig. S1 (ESI†). As can be seen, the BF is a cationic dye with three amino functional groups. The pH dependent adsorption of BF on ZnFe2O4@CS/GO nanocomposites is shown in Fig. 4. The adsorption percentage of MB is gradually increased as the solution pH increases from 3 to 9. The kinetic and isotherm experiments were carried out at pH 9.0 in this study. At lower pH, the surface of the adsorbents is positively charged because of the protonation of the imine and amine groups in CS, whereas BF is an typical cationic dye, and this leads to a strong electrostatic repulsive effect between the adsorbents and the positively charged BF molecules. Furthermore, as the solution pH decreases, more and more H+ ions are competing with the positive charged BF, and occupying the surface active sites of the adsorbents. As the pH increased, more binding sites are released and there is less competition between the H+ ions and the cationic dye. In addition, the deprotonated carboxyl groups of ZnFe2O4@CS/GO can provide strong electrostatic attractions toward BF at a higher pH, which is also favorable for the BF adsorption. These result verified that the adsorption of BF on ZnFe2O4@CS/GO is pH dependent.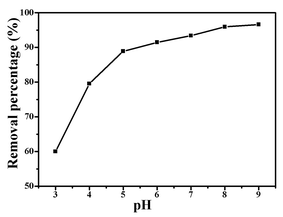 | ||
| Fig. 4 Effect of solution pH on the adsorption of BF (initial concentration, 50 mg L−1; temperature, 303 K; contact time, 60 min). | ||
Adsorption kinetics
The adsorption process is a physicochemical process which describes the mass transfer of molecules/ions from the liquid phase to the adsorbent's surface.1 A kinetic study provides important information about the mechanism of BF adsorption onto ZnFe2O4@CS/GO. Adsorption kinetics at different initial BF concentrations are shown in Fig. 5. The amount of adsorption increased rapidly in the initial stage, and then slowed down until the adsorption reached equilibrium. The equilibrium time with initial BF concentrations of 10, 25 and 50 mg L−1 were about 20, 40 and 120 min, respectively. The initial rapid step of BF sorption is from the surface physical sorption which is because of the existence of a large number of sorption sites (–COOH, –OH) on the surface of the ZnFe2O4@CS/GO nanocomposites. The subsequent slow step is attributable to the limited active adsorption sites available on the surface of the adsorbents, and the BF adsorbed on the surface would further hamper the diffusion of other BF molecules, resulting in a longer time to reach equilibrium.22 As shown in Fig. 5, the adsorption capacity of BF onto ZnFe2O4@CS/GO increases as the BF concentrations increase. At higher BF concentrations, more BF molecules are available which provide a higher driving force to overcome the mass transfer resistance of the dye molecules from the aqueous phase to the adsorbent's surface, resulting in more collisions between BF molecules and the active sites on the adsorbent.22 It is seen that the adsorption rate is extraordinarily high, which is confirmed by the fact that the adsorption percentage of BF onto ZnFe2O4@CS/GO reaches 53% within a contact time of 2 min. The fast adsorption rate could be attributed to the strong electrostatic attraction between the negatively charged surface oxygen containing groups of the ZnFe2O4@CS/GO and cationic BF as well as the π–π interactions between the BF molecules and the aromatic rings of GO.22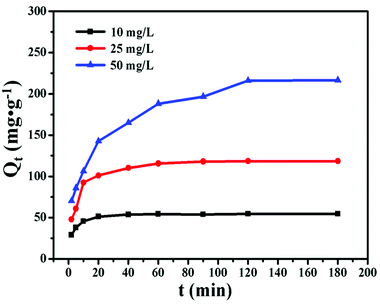 | ||
| Fig. 5 Effect of adsorption time on the adsorption of BF (initial concentration, 50 mg L−1; temperature, 303 K). | ||
The pseudo-first-order and pseudo-second-order models, and the intra-particle diffusion model were applied to fit the experimental kinetics data (Fig. S2; ESI†). The pseudo-first-order model, one of the most widely used kinetic models, describes the adsorption processes between the liquid and solid phase based on the solid capacity.23 The pseudo-first-order kinetic model is expressed as:
ln(Qe − Qt) = ln![[thin space (1/6-em)]](https://www.rsc.org/images/entities/char_2009.gif) Qe − K1t Qe − K1t |
where K2 represents the rate constant of the pseudo-second-order model. The pseudo-second-order model fitted experimental data is shown in Fig. 6. The calculated Qe values obtained for the linear plots of t/Qt versus t show good agreement with the experimental data (Table S1; ESI†). The R values obtained from the pseudo-second-order model are all larger than 99% and larger than the one obtained from the pseudo-first-order model, suggesting that the adsorption kinetics are better described by the pseudo-second order model.
As discussed previously, the adsorption kinetics showed a two stage process including an initial fast step and subsequent slow step. The fast adsorption rate at the initial stage was governed by the rate of the adsorption reactions occurring between the BF molecules and the surface active sites in the ZnFe2O4@CS/GO composites. As the surface active sites were occupied, the adsorption processes slowed down and the adsorption kinetics were mainly dominated by the diffusion of BF molecules from the liquid phase to the phase of the ZnFe2O4@CS/GO. The mass transport of the adsorbate from the liquid phase to solid phase can be described by the intraparticle diffusion model.24 The intraparticle diffusion model is expressed by the following equation:
| Qt = Kit0.5 |
In the equation above, Ki is the diffusion rate constant. Plots of Qt versus t0.5 and the linearly fitted lines are shown in Fig. S3; ESI.† The R values obtained from the fitted lines are 0.57, 0.66 and 0.91 for 10, 25 and 50 mg L−1 BF, respectively. This suggests that the intraparticle diffusion model better describes the adsorption process at higher BF concentrations. At high dye concentrations, the driving force is enough to overcome the diffusion resistance for the molecular dye to diffuse in to the pore of the adsorbent particle. With the decrease of the dye concentration, the diffusion rate slows down and finally reaches the diffusion equilibrium. The intercept of the linearly fitted lines were 36.8, 62.8 and 69.2 for 10, 25 and 50 mg L−1 BF, respectively. The Ki values obtained from the slope of the fitted lines were 1.74, 5.36 and 12.92 mg g−1 min0.5 for 10, 25 and 50 mg L−1 BF, respectively. The fitted lines do not pass through the origin and this suggests that the intraparticle diffusion model may not be the dominant mechanism for the adsorption of BF onto ZnFe2O4@CS/GO.
Adsorption isotherms and thermodynamics
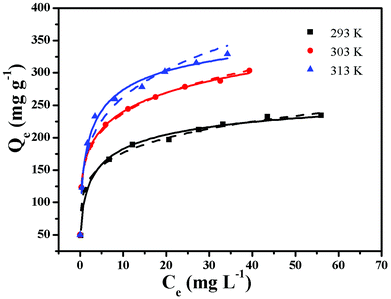
Adsorption isotherms are very important for investigating the adsorption properties of adsorbents. In order to determine the effect of temperature on BF adsorption, adsorption experiments at temperatures of 293, 303 and 313 K were carried out. Two isotherm models, Langmuir25 and Freundlich,26 were applied to fit the experimental data (Fig. 6). The Langmuir adsorption isotherm, first introduced by Irving Langmuir, is based on the assumption that adsorption takes place on a homogeneous surface.22 The Langmuir model can be expressed by the following equation:The Freundlich isotherm model can be expressed by the following formula:
| Qe = kCe1/n |
The calculated parameters obtained from the two models are listed in Table 1. The values of the correlation coefficient obtained from the Langmuir model are all larger than 0.99, indicating that the adsorption data are better fitted by the Langmuir model rather than by the Freundlich model. The calculated values of Qmax were 243.9 mg L−1 at 293 K, 307.69 mg L−1 at 303 K and 335.57 mg L−1 at 313 K. The results demonstrate that BF adsorption onto ZnFe2O4@CS/GO is an endothermic process. The maximum adsorption capacity of ZnFe2O4@CS/GO for BF at 293 K is close to that of Fe(III) and Mn(II) modified ACs (238.10 mg g−1),27 higher than AC/ferrospinel composite (101.0 mg g−1)5 and hydroxy-aluminum pillared bentonite (45.54 mg g−1).28 The high adsorption capacity could be, because of the synergistic effect from both the ZnFe2O4@CS particles and the GO sheets. However, the encapsulated ZnFe2O4@CS in the GO sheets can prevent the GO from aggregating in solution, but the ZnFe2O4@CS were hybridized with mechanically and chemically stable graphene materials, providing an accessible diffusion pathway in the macropore domain.8 The high adsorption capacity and magnetic property of the ZnFe2O4@CS/GO composites make them promising candidates as efficient adsorbents for the removal of pollutants from large volumes of aqueous solution. The Freundlich constant n was found to be 5.68 (n > 1), indicating that BF adsorption onto ZnFe2O4@CS/GO was a favorable process.
| T (K) | Langmuir | Freundlich | ||||
|---|---|---|---|---|---|---|
| Qmax (mg L−1) | b (L mg−1) | R2 | k | n | R2 | |
| 293 | 243.90 | 0.022 | 0.995 | 118.12 | 5.68 | 0.952 |
| 303 | 307.69 | 0.053 | 0.994 | 157.03 | 118.25 | 0.952 |
| 313 | 335.57 | 0.065 | 0.995 | 160.10 | 216.52 | 0.889 |
The Van't Hoff equation was applied to describe the adsorption thermodynamics. The Van't Hoff equation is expressed as follows:
| ΔG = ΔH − TΔS |
| T (K) | ΔG (kJ mol−1) | ΔH (kJ mol−1) | ΔS (J mol K−1) |
|---|---|---|---|
| 293 | −14.03 | ||
| 303 | −15.71 | 23.27 | 127.75 |
| 313 | −16.56 |
The negative values of ΔG (Table 2) indicate that the adsorption reaction is spontaneous at temperatures of 293, 303 and 313 K.
Conclusions
In summary, a novel multifunctional nanocomposite was fabricated by encapsulating magnetite CS into GO sheets. The adsorption properties of the ZnFe2O4@CS/GO composites towards cationic dyes were investigated by using ZnFe2O4@CS/GO as adsorbent and BF as adsorbate. ZnFe2O4@CS/GO showed a high adsorption capacity towards BF with a maximum adsorption capacity of 243.9 mg L−1 at 293 K, 307.69 mg L−1 at 303 K and 335.57 mg L−1 at 313 K. The adsorption of BF on ZnFe2O4@CS/GO was pH dependent, indicating that there were strong electrostatic interactions between BF and ZnFe2O4@CS/GO. The adsorption followed pseudo-second-order kinetics, and the equilibrium data were modeled well by the Langmuir isotherms. The negative ΔG indicated that the adsorption was a spontaneous process. The results demonstrated the ZnFe2O4@CS/GO could be a suitable adsorbent for the preconcentration and removal of organic dyes from large volumes of aqueous solutions.Acknowledgements
This work was financially supported by National Natural Science Foundation of China (No. 21607135), Zhejiang Environmental Protection Bureau (No. 2013A025).References
- G. Xue, Q. P. Dai and S. G. Jiang, J. Am. Chem. Soc., 1988, 110, 2393–2395 CrossRef CAS; L. Fan, C. Luo, X. Li, F. Lu, H. Qiu and M. Sun, J. Hazard. Mater., 2012, 215–216, 272–279 CrossRef PubMed.
- C. Wang, C. Feng, Y. Gao, X. Ma, Q. Wu and Z. Wang, Chem. Eng. J., 2011, 173, 92–97 CrossRef CAS.
- T. Robinson, G. McMullan, R. Marchant and P. Nigam, Bioresour. Technol., 2001, 77, 247–255 CrossRef CAS PubMed.
- J. Ma, W. Song, C. Chen, W. Ma, J. Zhao and Y. Tang, Environ. Sci. Technol., 2005, 39, 5810–5815 CrossRef CAS PubMed.
- L. Ai and J. Jiang, Desalination, 2010, 262, 134–140 CrossRef CAS.
- M. Rafatullah, O. Sulaiman, R. Hashim and A. Ahmad, J. Hazard. Mater., 2010, 177, 70–80 CrossRef CAS PubMed.
- G. Zhang, Z. He and W. Xu, Chem. Eng. J., 2012, 183, 315–324 CrossRef CAS.
- X. L. Wu, L. Wang, C. L. Chen, A. W. Xu and X. K. Wang, J. Mater. Chem., 2011, 21, 17353–17359 RSC.
- L. Sun, H. Yu and B. Fugetsu, J. Hazard. Mater., 2012, 203–204, 101–110 CrossRef CAS PubMed.
- L. Ai, C. Zhang and Z. Chen, J. Hazard. Mater., 2011, 192, 1515–1524 CrossRef CAS PubMed.
- Y. Chen, L. Chen, H. Bai and L. Li, J. Mater. Chem. A, 2013, 1, 1992–2001 CAS.
- Z. Zhang and J. Kong, J. Hazard. Mater., 2011, 193, 325–329 CrossRef CAS PubMed.
- S. Babel and T. A. Kurniawan, J. Hazard. Mater., 2003, 97, 219–243 CrossRef CAS PubMed.
- L. Fan, C. Luo, M. Sun, X. Li and H. Qiu, Colloids Surf., B., 2013, 103, 523–529 CrossRef CAS PubMed.
- W. S. Wan Ngah, L. C. Teong and M. A. K. M. Hanafiah, Carbohydr. Polym., 2011, 83, 1446–1456 CrossRef CAS.
- S. Chatterjee, M. W. Lee and S. H. Woo, Bioresour. Technol., 2010, 101, 1800–1806 CrossRef CAS PubMed.
- P. Ramesh, S. Bhagyalakshmi and S. Sampath, J. Colloid Interface Sci., 2004, 274, 95–102 CrossRef CAS PubMed.
- D. Yang, J. Feng, L. Jiang, X. Wu, L. Sheng, Y. Jiang, T. Wei and Z. Fan, Adv. Funct. Mater., 2015, 25, 7080–7087 CrossRef CAS.
- H. Yan, X. Tao, Z. Yang, K. Li, H. Yang, A. Li and R. Cheng, J. Hazard. Mater., 2014, 268, 191–198 CrossRef CAS PubMed.
- M. Sugimoto, M. Morimoto, H. Sashiwa, H. Saimoto and Y. Shigemasa, Carbohydr. Polym., 1998, 36, 49–59 CrossRef CAS.
- X. Chen, K. F. Lam, S. F. Mak and K. L. Yeung, J. Hazard. Mater., 2011, 186, 902–910 CrossRef CAS PubMed.
- N. Song, X. L. Wu, S. Zhong, H. Lin and J. R. Chen, J. Mol. Liq., 2015, 212, 63–69 CrossRef CAS.
- J. P. Simonin, Chem. Eng. J., 2016, 300, 254–263 CrossRef CAS.
- X. L. Wu, D. Zhao and S. T. Yang, Desalination, 2011, 269, 84–91 CrossRef CAS.
- I. Langmuir, J. Am. Chem. Soc., 1918, 40, 1361–1403 CrossRef CAS.
- H. M. F. Freundlich, J. Phys. Chem. A, 1906, 57, 385–470 CAS.
- L. Huang, J. Kong, W. Wang, C. Zhang, S. Niu and B. Gao, Desalination, 2012, 286, 268–276 CrossRef CAS.
- Y. F. Hao, L. G. Yan, H. Q. Yu, K. Yang, S. J. Yu, R. R. Shan and B. Du, J. Mol. Liq., 2014, 199, 202–207 CrossRef CAS.
Footnote |
| † Electronic supplementary information (ESI) available. See DOI: 10.1039/c7ra04100d |
| This journal is © The Royal Society of Chemistry 2017 |


