 Open Access Article
Ultra-selective detection of Fe2+ ion by redox mechanism based on fluorescent polymerized dopamine derivatives†
Taeuk An‡
a,
Namhun Lee‡a,
Hong-Jun Chob,
Seongsoo Kima,
Dong-Sik Shin *c and
Sang-Myung Lee*a
aDepartment of Chemical Engineering, Kangwon National University, Gangwon-do 24341, Republic of Korea. E-mail: sangmyung@kangwon.ac.kr
bSchool of Chemical and Biological Engineering, Seoul National University, Seoul 08826, Republic of Korea
cDepartment of Chemical and Biological Engineering, Sookmyung Women's University, Seoul 04310, Republic of Korea. E-mail: dshin@sm.ac.kr
First published on 14th June 2017
Abstract
Polydopamine (PDA) is considered as a fluorescent molecule, however, the molecular structure and degree of polymerization that yield the most efficient fluorescence have yet to be identified. Here, we first present the fluorescence origin of polymerized dopamine derivatives (pDA) and their extraordinary behavior on the ultra-selective recognition of Fe2+ ions. Dopamine molecules are polymerized to 5,6-dihydroxyindole-rich pDA in basic conditions, followed by readily oxidizing to indole-5,6-quinone-rich pDA by dropping the pH to strongly acidic conditions. It was clearly demonstrated that oligomeric dopamine molecules were water-soluble with intense fluorescence (F-ODA, n = 3–4), while polymeric dopamine molecules were water-insoluble without fluorescence (PDA, n > 5). Also, F-ODA was dramatically selective to Fe2+ ions contradicting previous studies, and their unique binding mechanism was described through the redox potential analysis.
Introduction
With the rapid development of optical analysis, fluorescence-based detection and imaging techniques have been widely applied in the field of biotechnology. Many fluorescent probes featuring Stokes shifts have been studied, however, most of the commercially available fluorescent organic probes have limitations, such as high in vitro and in vivo toxicity, low quantum yields, and poor solubility and stability in water.1 To overcome these problems, fluorescent probes based on biocompatible or bio-inspired materials have recently been developed showing good biocompatibility and biodegradability with high fluorescence and low toxicity.2Dopamine, a member of the catecholamine family, is well known for its role in neurotransmission and hormone release control. Dopamine is converted into 5,6-dihydroxyindole through cyclization induced by oxidative nucleophilic reaction under weakly basic conditions, after which it is polymerized to polydopamine (PDA) through covalent bonding, hydrogen bonding, π–π interactions and so on.3,4 Owing to its strong adhesive properties, PDA has been used as a surface coating to increase the stability or modify the surface of organic or inorganic materials.4 Also, chelation of Fe3+ ions with dopamine or dopamine derivatives is a well-known coordination induced by the attraction between catechol groups and Fe3+ ions. Based on this coordination, PDA cellulose nanocrystals (PDA@CNC) or PDA montmorillonite (PDA@Clay) were used to detect pollutants including Fe3+ ions.5,6 Moreover, nanoparticles consisting of PDA and Fe3+ ion complexes (PDA@Fe3+) were used as agents for MRI, bioimaging, and drug delivery systems.7–10 However, to the best of our knowledge, it is still unclear which structures of polymerized dopamine derivative (pDA) are mainly responsible for strong fluorescence. Bayindir et al. reported fluorescent PDA nanoparticles could be synthesized under basic conditions, however, they did not clearly present the origin of this fluorescence.11 In contrast, Xu et al. asserted that PDA nanoparticles do not emit fluorescence, but serve as fluorescence quenchers for some fluorescent dyes.12 This dispute is based on uncertainty over which molecular structures of PDA and which degrees of polymerization of dopamine are empirically effective for achieving fluorescence. Recently, Wu et al. and Tseng et al. reported that relatively low-molecular-weight polymers emit fluorescence.1,13 However, their methods have some disadvantages regarding the requirement of several additional chemical processes to control the molecular weight of polymerized dopamine derivatives.
Ferrous (Fe2+) and ferric ions (Fe3+), which are abundant metal ions in the human body, play important roles in various biological processes such as electron transport, enzymatic reaction, oxygen delivery and composition for heme.14,15 Disruption of iron equilibrium in cells results in various diseases such as cancer, hepatitis, Alzheimer disease and Parkinson's disease.16 Especially, reactive oxygen species that have critical effects on cells could be formed by reaction between ferrous ions (Fe2+) and hydrogen peroxide.17 In spite of importance of Fe2+ ions, there are few sensing model due to its poor selectivity.18–20
Herein, we first identified the fluorescence origin of pDA and their extraordinary behaviour on the ultra-selective detection of Fe2+ ions. Dopamine molecules are polymerized to 5,6-dihydroxyindole-rich pDA in basic condition. By dropping pH to the strong acidic condition, 5,6-dihydroxyindole-rich pDA is readily oxidized to indole-5,6-quinone-rich pDA through the redox reaction with dissolved oxygen. We observed that oligomeric dopamine was water-soluble with intensive fluorescence (F-ODA, n = 3–4), meanwhile polymeric dopamine molecule was water-insoluble without fluorescence (PDA, n > 5). We also found that F-ODA was dramatically selective to Fe2+ ions, contradicting previous studies reporting that only Fe3+ ions interact with dopamine derivatives. Their unique binding mechanism was elucidated through the redox potential analysis.
Results and discussion
Synthetic mechanism of F-ODA
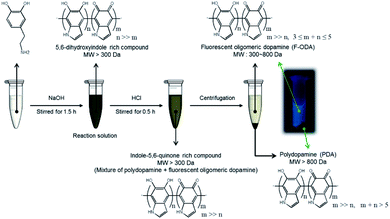
The overall isolation procedure and proposed structures of the polymerized dopamine derivatives in each step are presented in Scheme 1. Dopamine was polymerized by increasing pH of the dopamine dissolved in PBS buffer. The main polymerized products were 5,6-dihydroxyindole-rich compounds composed of various polymerized dopamine derivatives, including polymers and oligomers. As this product was acidified by adding HCl, the 5,6-dihydroxyindole-rich compound was oxidized to an indole-5,6-quinone-rich compound. Since the non-fluorescent PDA was precipitated, the fluorescent F-ODA supernatant containing indole-5,6-rich compounds could be well separated.To prove this proposed mechanism, the structures were revealed by measuring optical properties in each step. First, we investigated the chemical structures of dopamine, the 5,6-dihydroxyindole rich compound, the indole-5,6-quinone-rich compound, and F-ODA via FT-IR spectroscopy (Fig. 1). The FT-IR spectrum of dopamine exhibited five bands: stretching and bending vibrations of the amine group (3340 and 1618 cm−1, respectively), the stretching vibration of the hydroxyl group of catechol (3320 cm−1), and the stretching vibrations of C–H (3040 cm−1) and C–C of the aromatic ring (1550 cm−1).21,22 After polymerization in basic condition (black line), three distinguishable bands appeared at 1632, 1453, and 1110 cm−1, corresponding to the stretching vibrations of the aromatic ring, the specific structure of polyindole, and the C–O of the phenol group, respectively.23,24 This finding suggested that the polymerized dopamine derivatives were mainly composed of 5,6-dihydroxyindole. However, acidification by HCl addition (red line) induced the structural transition of 5,6-dihydroxyindole to indole-5,6-quinone, which was identified by observing a new band at 1740 cm−1 corresponding to ketone and the weakening or disappearance of peaks at 1453 and 1110 cm−1 corresponding to 5,6-dihydroxyindole.25 We also determined that the structure of F-ODA was mainly composed of indole-5,6-quinone on the basis of the similarity of the FT-IR spectrum of F-ODA (blue line) to that of the indole-5,6-quinone-rich compound (red line).
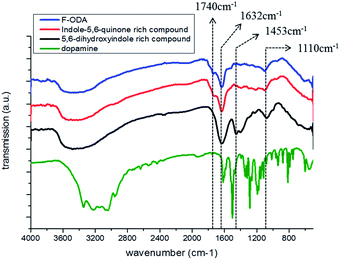 | ||
| Fig. 1 FT-IR spectra of dopamine (green), 5,6-dihydroxyindole-rich compound in basic conditions (black), indole-5,6-quinone-rich compound in acidic conditions (red), and F-ODA (blue). | ||
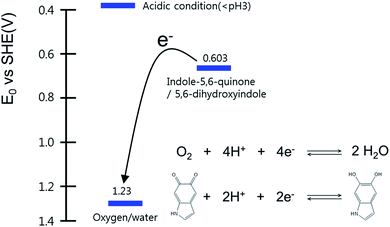
In addition to the FT-IR analysis, redox reaction analysis was performed. Fig. 2 presents a redox potential diagram indicating the expected half-reactions upon HCl addition to the basic reaction solution and the pH-dependent redox potentials.26,27 These two half-reactions clearly indicate that the sudden pH drop can trigger the reduction of dissolved oxygen by supplying excess protons, leading to the spontaneous oxidation of 5,6-dihydroxyindole to indole-5,6-quinone. Since indole-5,6-quinone became more neutral than 5,6-dihydroxyindole, this oxidation can decrease the solubility of the indole-5,6-quinone-rich compound. As a result, the polymeric molecules of the indole-5,6-quinone-rich compounds were aggregated through the hydrophobic interaction, π–π interaction and hydrogen bonding, and then precipitated in aqueous solution while the oligomeric molecules remained in the supernatant.4
Meanwhile, the mass spectrum of F-ODA exhibited several peaks at m/z 445, 569, 656, 672, 719, and 861, corresponding to [m], [n + 2Na + 2K], [p + Na + K], [p + 2K], [p + 2Na + 2K], and [q + 2Na + 2K], respectively (Fig. S1a†). Fig. S1b† shows the expected chemical structures of m, n, p, and q, indicating that F-ODA has an oligomeric structure featuring 3–5 degrees of polymerization. Furthermore, from NMR analysis of F-ODA compared with pure dopamine, the chemical shift of aromatic protons disappeared and the shift of methylene groups migrated (Fig. S2†).28,29 In addition, XPS analysis of F-ODA exhibited C 1s spectrum at 284.68 eV (C–C or C![[double bond, length as m-dash]](https://www.rsc.org/images/entities/char_e001.gif) C) (Fig. S3(a)†), N 1s spectrum at 399.38 eV (C–N–C or N–H) (Fig. S3(b)†) and O 1s spectrum at 532.28 eV (C
C) (Fig. S3(a)†), N 1s spectrum at 399.38 eV (C–N–C or N–H) (Fig. S3(b)†) and O 1s spectrum at 532.28 eV (C![[double bond, length as m-dash]](https://www.rsc.org/images/entities/char_e001.gif) O and C–OH) (Fig. S3(c)†).30 These data indicated that the dopamine polymerization reaction was successfully performed.
O and C–OH) (Fig. S3(c)†).30 These data indicated that the dopamine polymerization reaction was successfully performed.
Optical property of F-ODA
We investigated the optical properties of the F-ODA supernatant and PDA precipitate under different reaction conditions by fluorescence and UV/Vis absorption spectroscopies, as shown in Fig. 3. The fluorescence of the F-ODA supernatant in 10 mM sodium hydroxide solution was found at 457 nm (λex = 400 nm) and increased gradually while the PDA precipitate did not emit any fluorescence over time (Fig. 3(a) and (b)). In subsequent experiments, the reaction time was set to 1.5 h, which was considered sufficient to show high fluorescence intensity. The UV/Vis absorbance bands of the F-ODA supernatant were observed at 300 nm and 457 nm at the beginning of the polymerization reaction (Fig. 3(c)). As polymerization reaction time goes by, the absorbance bands observed at 300 nm was blue-shifted to 280 nm same as that of dopamine, and the band at 457 nm completely decreased within 30 min. The absorbance bands at 300 nm and 457 nm are those of dopaminechrome which is one of the intermediate molecules produced during the polymerization. Moreover, dopaminequinone molecules that are considered as an early form of dopaminechrome were not detected because their oxidation rate is too fast (395 nm).31 Considering that the maximum absorbance wavelength (280 nm) is different from the excitation wavelength (400 nm), the findings also confirmed that F-ODA has various singlet states, as fluorescence can only occur when the excited electrons drop from the S1 level to the S0 level. The high energy at 280 nm might be capable of exciting the electrons to higher singlet states than S1, whereas the weaker energy at 400 nm is capable of excitation at most from S0 to S1. In the case of the PDA precipitate, a shoulder peak was observed at 280 nm, which is identical to the peak of F-ODA (Fig. 3(d)).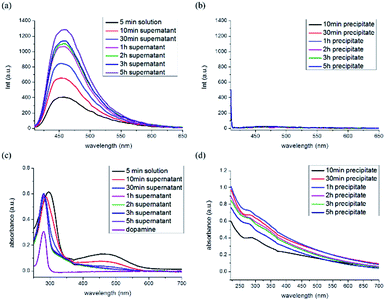 | ||
| Fig. 3 Fluorescence spectra of the (a) supernatant and (b) precipitate and UV/Vis absorption spectra of the (c) supernatant and (d) precipitate as a function of reaction time (λmax = 400 nm). | ||
The effect of pH to initiate the polymerization was investigated by adding various concentrations of NaOH solution into the reaction mixture. The fluorescence intensity at 457 nm was highest when 4 mM NaOH was added (pH = 10.7) (Fig. S4†). Since more NaOH induced extensive polymerization, polymeric dopamine was dominant at higher pH resulting in low fluorescence. In the following experiments, the NaOH concentration was set to 4 mM to maximize the fluorescence intensity.
Next, the effect of HCl on the molecular structural change of the polymerized dopamine derivatives via redox reaction was investigated (Fig. S5(a)†). In the absence of HCl, the 5,6-dihydroxyindole-rich compound could not be separated into a precipitate and supernatant by centrifugation; thus, the fluorescence intensities were totally same before and after centrifugation (Fig. S5(b)†). On the other hand, the fluorescence intensity of the F-ODA supernatant obtained from the indole-5,6-quinone-rich compound by centrifugation was higher than that of the indole-5,6-quinone-rich compound (Fig. S5(c)†). This fluorescence increase is caused by the removal of PDA, which partially absorbs the incident light (400 nm) exciting F-ODA. With respect to this phenomenon, Fig. S6† supports our claim that 5,6-dihydroxyindole can be oxidized via the reduction of dissolved oxygen induced by the prompt addition of HCl. When HCl was added under deoxygenated conditions achieved by nitrogen purging, no precipitate was observed after centrifugation similarly to the result in the absence of HCl. This result strongly supports our hypothesis that the reduction of dissolved oxygen plays an important role in separating F-ODA. Based on optimized reaction conditions, we measured photoluminescence lifetime and quantum yield of F-ODA. The F-ODA lifetime was shown as two types of decay: 1.75 ns (23.89%, short decay) and 5.05 ns (76.11%, long decay). From this result, the average lifetime was approximately 4.26 ns (Fig. S7(a)†). The F-ODA quantum yield was calculated 6.22% using eqn (1) compared with anthracene as a reference (Fig. S7(b)†).
 | (1) |
Ultra-selective detection of Fe2+ ions
To investigate the fluorescence intensity changes of F-ODA depending on its chelation with various metal ions, we performed metal screening using F-ODA. When the acidic F-ODA solution was incubated with Ru3+, Fe3+ and Fe2+, the fluorescence prominently diminished among various metal ions (Fig. 4(a)). Based on the ratio of the initial to the final intensity at λmax = 457 nm, Fe2+ quenched a fluorescence dramatically, decreasing the fluorescence intensity by 15-fold to the initial intensity (Fig. 4(b)). Fe3+ and Ru3+ are well-known chelate metal ions in the ortho-dihydroxyl group of catechol as well as fluorescence quenchers; thus, their quenching effects suggest that they are chelated with a few catechol groups of 5,6-dihydroxyindole of F-ODA.32–34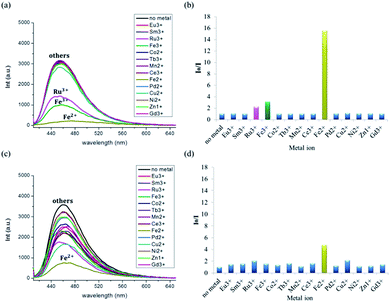 | ||
| Fig. 4 (a) and (c) Fluorescence spectra and (b) and (d) fluorescence intensity ratios I0/I of F-ODA upon addition of 1 mM of various metal ions at (a) and (b) acidic and (c) and (d) physiological pH. | ||
Since Fe2+ is not known to chelate with catechol, our discovery might be a surprising and inspiring result for further studies. Fig. S8† shows the redox half-reactions and the redox potentials associated with the half-reactions that could occur when adding Fe2+.26,27 As seen from the net reaction equation, the net redox potential is E0 = −0.167 V under acidic conditions, thus the reaction between indole-5,6-quinone-rich F-ODA and Fe2+ is unfavorable under standard condition. However, the real potential difference Eh should consider the concentration of reactants, thus, we adopted the Nernst equation as shown in eqn (S1).† Before Fe2+ was added into the acidic F-ODA solution in the absence of Fe3+, indole-5,6-quinone was dominant. In this condition, we can assume that the prompt addition of Fe2+ was enough to trigger an α-direction reaction. The reaction resulted in the increase of Fe3+ concentration leading to the α′-direction. However, Fe3+ was immediately chelated with reduced 5,6-dihydroxyindole and quenched the fluorescence (Fig. 5).
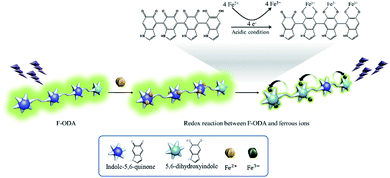 | ||
| Fig. 5 Proposed mechanism for detection of ferrous ions via redox reaction between F-ODA and ferrous ions. | ||
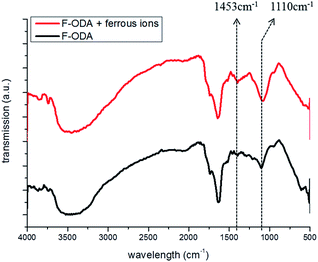
This result could be confirmed by monitoring the FT-IR spectra of F-ODA as well. Initially, the two bands at 1453 and 1110 cm−1 decreased upon the addition of HCl, corresponding to the stretching vibration of the specific structure of polyindole and the C–O of the phenol group respectively (Fig. 6, black line). Thereafter, the peaks were restored by the addition of Fe2+ ions (Fig. 6, red line). We conceived that it was due to a combination of two successive mechanisms: (1) reduction of the indole-5,6-quinone to catechol-structured 5,6-dihydroxyindole along with oxidation of Fe2+ to Fe3+ ions and (2) chelation of Fe3+ ion with reduced F-ODA. This hypothesis supported the result that Fe2+ ion quenched the fluorescence of the acidic F-ODA than Fe3+ ion even though Fe3+ is chelated with catechol groups directly. Additionally, SEM-EDS analysis was performed before and after incubating F-ODA with Fe2+ ions. From the SEM-EDS results, the synthesized polydopamine derivatives from supernatant and precipitate, respectively, showed very similar elemental analysis results (C: 30 wt%, N: 4 wt%, O: 61 wt%) (Fig. S9(a) and (b)†). After incubating F-ODA with Fe2+ ions, we could confirm that Fe2+ ions were incorporated within F-ODA (Fig. S9(c)†).
We also confirmed that the fluorescence-quenching induced by Fe2+ decreased when the F-ODA solution reacted with Fe2+ after its pH was adjusted to 7.4, which was attributed to the lower reduction potential of indole-5,6-quinone at this pH compared with acidic conditions (Fig. 4(c) and (d)). This means that pH-dependent effect is also related to the formation of iron hydroxide at pH 7.4, which does not occur under acidic conditions.35 Finally, we examined the dependence of the fluorescence intensity changes of F-ODA at pH 7.4 on the concentration of Fe2+ added. When the concentration of reacting Fe2+ increased from 2 μM to 1 mM, the fluorescence intensity of F-ODA at 457 nm decreased evidencing chelation between the oxidized Fe3+ and the reduced F-ODA (Fig. 7(a)). Fig. 7(b) shows that the fluorescence intensity ratio (I0 − I)/I0 at 457 nm is a function of Fe2+ concentration (I0 and I represent the fluorescence intensities of F-ODA before and after Fe2+ addition, respectively). The inset graph of Fig. 7(b) indicates that the fluorescence intensity ratio (I0 − I)/I0 is linear in the range of 2–50 μM Fe2+, showing that Fe2+ can be sensitively detected in this concentration range.
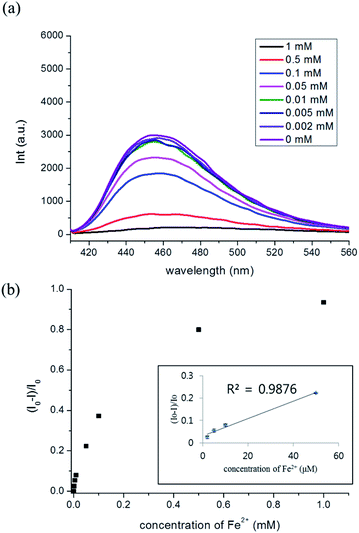 | ||
| Fig. 7 (a) Fluorescence spectra and (b) fluorescence intensity ratios (I0 − I)/I0 of F-ODA upon the addition of different concentrations of Fe2+ (n = 3 in inset graph). | ||
Experimental
Reagents and apparatus
The following were purchased from Sigma-Aldrich Co.: dopamine hydrochloride and the metals: europium(III) chloride, samarium(III) chloride hexahydrate, iron(III) chloride hexahydrate, ruthenium(III) chloride, cobalt(II) chloride hexahydrate, terbium(III) chloride hexahydrate, manganese(II) chloride tetrahydrate, cerium(III) chloride nonahydrate, iron(II) chloride tetrahydrate, zinc sulfate nonahydrate, and gadolinium(III) trifluoromethanesulfonate. Sodium hydroxide powder and hydrochloric acid were purchased from Daejung Co. Distilled water (Millipore) was used as a solvent for the metal ions. PBS buffer (pH 7.4, 2 mM) prepared in-house was used as a solvent for dopamine. UV/Vis absorption spectra and fluorescence emission spectra were collected using a UV/Vis spectrometer (OPTIZEN-α, Mecasys) and fluorescence spectrometer (FS-2, Scinco), respectively. FT-IR spectra were obtained using an FT-IR spectrometer (FTLA2000-104, ABB). Matrix-assisted laser desorption/ionization time-of-flight (MALDI-TOF) mass spectra of F-ODA were also recorded using a Voyager-DE STR workstation (Applied Biosystems).Synthesis of fluorescent oligomeric dopamine
F-ODA was prepared by oxidative polymerization and separated from the precipitated PDA by centrifugation. In the first step, dopamine hydrochloride (0.378 mg, 1 mM final concentration) was dissolved in 1.8 mL of PBS buffer (pH 7.4, 2 mM), and oxidative polymerization was conducted in a 20 mL glass vial via magnetic stirring (200 rpm) at room temperature for 1.5 h with 0.2 mL of sodium hydroxide solution (4 mM final concentration). After stirring, 0.04 mL of hydrochloric acid (0.25 M) was added to the solution, and the solution was stirred for an additional 0.5 h to induce the reduction of oxygen and the oxidation of 5,6-dihydroxyindole. In the second step, the resulting solution was transferred to a 2 mL Eppendorf tube and separated by centrifugation (10![[thin space (1/6-em)]](https://www.rsc.org/images/entities/char_2009.gif) 000 rpm) at room temperature for 10 min. The obtained supernatant was used to detect Fe2+ ions. The precipitate were fully re-dispersed with 2 mM PBS buffer solution (pH 7.4) to measure fluorescence intensity. The fluorescence intensities from the supernatant and the precipitate were measured at PMT 500 V using micro quartz cells.
000 rpm) at room temperature for 10 min. The obtained supernatant was used to detect Fe2+ ions. The precipitate were fully re-dispersed with 2 mM PBS buffer solution (pH 7.4) to measure fluorescence intensity. The fluorescence intensities from the supernatant and the precipitate were measured at PMT 500 V using micro quartz cells.
Metal screening
Various metal ions were dissolved in 0.05 mL of DW to a concentration of 1 mM. Next, 0.2 mL of F-ODA solution and 0.05 mL of each metal solution were mixed in a 1.5 mL tube and reacted in a thermomixer at room temperature and 600 rpm for 30 min. In the case of measurement at physiological pH, the pH of the F-ODA solution was adjusted to physiological pH after the F-ODA had been separated.Conclusions
In summary, we clearly demonstrated that the fluorescence of pDA originates from oligomeric dopamine, not from PDA. F-ODA was separated from PDA by solubility difference induced by structural change from 5,6-dihydroxyindole-rich pDA to indole-5,6-quinone-rich pDA. In addition, fluorescence of F-ODA was dramatically quenched by only Fe2+ ions based on their unique redox mechanism. Since this ultra-selective recognition of Fe2+ contradicts previous reports insisting that only Fe3+ ions interact with dopamine derivatives, our discovery must be an outstanding and inspiring result for the further studies.Acknowledgements
This work was supported by the Ministry of Science, ICT & Future Planning and National Research Foundation of Korea through Basic Science Research Program (NRF-2014R1A1A1006711 and NRF-2015R1D1A1A01059367), the Ministry of Trade, Industry & Energy (MOTIE), Korea Institute for Advancement of Technology (KIAT) through the Encouragement Program for The Industries of Economic Cooperation Region (R0004027) and Kangwon National University through 2015 Research Grant (No. 520150081).Notes and references
- B. Xiong, Y. Chen, Y. Shu, B. Shen, H. N. Chan, Y. Chen, J. Zhou and H. Wu, Chem. Commun., 2014, 50, 13578–13580 RSC.
- X. Feng, L. Liu, S. Wang and D. Zhu, Chem. Soc. Rev., 2010, 39, 2411–2419 RSC.
- J. Yang, M. Cohen Stuart and M. Kamperman, Chem. Soc. Rev., 2014, 43, 8271–8298 RSC.
- Y. Liu, K. Ai and L. Lu, Chem. Rev., 2014, 114, 5057–5115 CrossRef CAS PubMed.
- Y. Han, X. Wu, X. Zhang, Z. Zhou and C. Lu, ACS Sustainable Chem. Eng., 2016, 4, 5667–5673 CrossRef CAS.
- S. Huang, L. Yang, M. Liu, S. L. Phua, W. A. Yee, W. Liu, R. Zhou and X. Lu, Langmuir, 2013, 29, 1238–1244 CrossRef CAS PubMed.
- K. Y. Ju, J. W. Lee, G. H. Im, S. H. Lee, J. Pyo, S. B. Park, J. H. Lee and J. K. Lee, Biomacromolecules, 2014, 14, 3491–3497 CrossRef PubMed.
- K. Xin, M. Li, D. Lu, X. Meng, J. Deng, D. Kong, D. Ding, Z. Wang and Y. Zhao, ACS Appl. Mater. Interfaces, 2017, 9, 80–91 CAS.
- X. Zheng, J. Zhang, J. Wang, X. Qi, J. M. Rosenholm and K. Cai, J. Phys. Chem. C, 2015, 119, 24512–24521 CAS.
- B. Xiong, Y. Chen, Y. Shu, B. Shen, H. N. Chan, Y. Chen, J. Zhou and H. Wu, Chem. Commun., 2014, 50, 13578–13580 RSC.
- A. Yildirim and M. Bayindir, Anal. Chem., 2014, 86, 5508–5512 CrossRef CAS PubMed.
- W. Qiang, W. Li, X. Li, X. Chen and D. Xu, Chem. Sci., 2014, 5, 3018–3024 RSC.
- J.-H. Lin, C.-J. Yu, Y.-C. Yang and W.-L. Tseng, Phys. Chem. Chem. Phys., 2015, 17, 15124–15130 RSC.
- P. Aisen, C. Enns and M. Wessling-Resnick, Int. J. Biochem. Cell Biol., 2001, 33, 940–959 CrossRef CAS PubMed.
- C.-D. Kaplan and J. Kaplan, Chem. Rev., 2009, 109, 4536–4552 CrossRef CAS PubMed.
- W. Xuan, R. Pan, Y. Wei, Y. Cao, H. Li, F.-S. Liang, K.-J. Liu and W. Wang, Bioconjugate Chem., 2016, 27, 302–308 CrossRef CAS PubMed.
- S. Maiti, Z. Aydin, Y. Zhang and M. Guo, Dalton Trans., 2015, 44, 8942–8949 RSC.
- B.-P. Esposito, S. Epsztejn, W. Breuer and Z.-I. Cabantchik, Anal. Biochem., 2002, 304, 1–18 CrossRef CAS PubMed.
- J.-L. Chen, S.-J. Zhuo, Y.-Q. Wu, F. Fang, L. Li and C. Q. Zhu, Spectrochim. Acta, Part A, 2006, 63, 438–443 CrossRef PubMed.
- T. Hirayama, K. Okuda and H. Nagasawa, Chem. Sci., 2013, 4, 1250–1256 RSC.
- Y. Ma, H. Niu, X. Zhang and Y. Cai, Analyst, 2011, 136, 4192–4196 RSC.
- S. Xiong, Y. Wang, J. Yu, L. Chen, J. Zhu and Z. Hu, J. Mater. Chem. A, 2014, 2, 7578–7587 CAS.
- C. Zhijiang and H. Chengwei, J. Power Sources, 2011, 196, 10731–10736 CrossRef.
- A. Banerjee, S. Supakar and R. Banerjee, PLoS One, 2014, 9, 1–7 Search PubMed.
- S. Bose, S. Maji and P. Chakraborty, AAPS PharmSciTech, 2013, 2, 72–74 CAS.
- M. Amiri, E. Amali and A. Nematollahzadeh, Sens. Actuators, B, 2015, 216, 551–557 CrossRef.
- W. M. Haynes, CRC Handbook of Chemistry and Physics, CRC Press, Boca Raton, FL, 93rd edn, 2012 Search PubMed.
- M. Demura, T. Yoshida, T. Hirokawa, Y. Kumaki, T. Aizawa, K. Mitta, I. Bitter and K. Toth, Bioorg. Med. Chem. Lett., 2005, 15, 1367–1370 CrossRef CAS PubMed.
- M. Bisaglia, S. Mammi and L. Bubacco, J. Biol. Chem., 2007, 282, 15597–15605 CrossRef CAS PubMed.
- K. Qu, J. Wang, J. Ren and X. Qu, Chem.–Eur. J., 2013, 19, 7243–7249 CrossRef CAS PubMed.
- M. Bisaglia, S. Mammi and L. Bubacco, J. Biol. Chem., 2007, 282, 15597–15605 CrossRef CAS PubMed.
- D. J. Phillips, G.-L. Davies and M. I. Gibson, J. Mater. Chem. B, 2015, 3, 270–275 RSC.
- R. Yamahara, S. Ogo, H. Masuda and Y. Watanabe, J. Inorg. Biochem., 2002, 88, 284–294 CrossRef CAS PubMed.
- F. Liu, X. He, J. Zhang, H. Chen, H. Zhang and Z. Wang, J. Mater. Chem. B, 2015, 3, 6731–6739 RSC.
- V. Bonnefoy and D. S. Holmes, Environ. Microbiol., 2012, 14, 1597–1611 CrossRef CAS PubMed.
Footnotes |
| † Electronic supplementary information (ESI) available. See DOI: 10.1039/c7ra04107a |
| ‡ These authors contributed equally to this work. |
| This journal is © The Royal Society of Chemistry 2017 |

