 Open Access Article
Toward understanding the adsorption mechanism of large size organic corrosion inhibitors on an Fe(110) surface using the DFTB method†
Lei Guo *a,
Chengwei Qib,
Xingwen Zhengc,
Renhui Zhanga,
Xun Shena and
Savaş Kayad
aCollege of Material and Chemical Engineering, Tongren University, Tongren 554300, China. E-mail: cqglei@163.com; Tel: +86-0856-5592925
bSchool of Petroleum Engineering, Chongqing University of Science and Technology, Chongqing 401331, China
cMaterial Corrosion and Protection Key Laboratory of Sichuan Province, Zigong 643000, China
dCumhuriyet University, Faculty of Science, Department of Chemistry, Sivas 58140, Turkey
First published on 5th June 2017
Abstract
One of the effective methods developed to inhibit the corrosion of steel is the use of organic molecules as corrosion inhibitors. In particular, the design and synthesis of large size organic corrosion inhibitors draws more and more attention. Unfortunately, an atomic-level insight into the inhibition mechanism is still lacking, and regular density functional theory method is found to be inefficient in dealing with large inhibitor–metal adsorption systems. Given this background, in this work, density functional based tight binding (DFTB) approach was used to investigate the adsorption properties of three large size inhibitors (i.e., chalcone derivatives) on an iron surface. The molecular activity of free chalcone derivatives was studied by means of Frontier molecular orbital theory. The growth characteristics of α-Fe habits were observed using the “Morphology” software. Some adsorption parameters such as charge density difference, density of states, and changes of molecular orbital were described in detail. The present study is helpful to understand the anticorrosive mechanism of similar organic inhibitors and provides a feasible way to develop novel corrosion inhibitors.
1. Introduction
For decades, the corrosion of steel has seriously hindered the development of industrial economy, and even resulted in major accident and bodily injury. Many methods have been used to decrease the corrosion of steel, such as surface coating technology, minimizing the concentration of oxygen, and adding alloyed elements. Additionally, to prevent disasters, Li and colleagues call for open data infrastructures to collate information on material failures.1 The use of organic molecules as corrosion inhibitors has become an increasingly popular strategy for avoiding or reducing the metal corrosion, especially for steel in acidic medium. It is generally accepted that these inhibitors prevent the corrosion by adsorbing onto the metal surface and forming a protective barrier.2–4 Undoubtedly, a knowledge of the surface chemistry of the adsorbed organics can have profound implications for designing new inhibitors. As reviewed by Dwivedi and his coauthors,5 the surface analytical techniques, which were used for characterization of steels in corrosive media especially when the presence of corrosion inhibitors, receive more and more attentions. Actually, it is far from perfect to only rely on experiments, and there are still some difficulties in imaging the distribution of molecular orientation with conventional experimental techniques on the nanoscale.6 Fortunately, molecular simulation techniques can make a beneficial supplement to the inhibitor–metal interface study. An increasing number of scientists have turned to molecular simulation technique for understanding the anticorrosive mechanism of organic inhibitors.It is apparent from the studies in the literature, many researchers7–9 investigated the adsorption of organic inhibitors on metal surface employing molecular dynamics simulation method by Forcite or Lammps software, which is based on force field, such as COMPASS,10 cvff,11 Dreiding.12 However, one can only perform qualitative analysis by this approach, their reliability in the modeling of the adsorption of organic molecules is limited. Force fields are not flexible to various chemical situations or to predictions of spectroscopic data which rely quantitatively on the involved knowledge of electronic structure. We hold that more attention should be paid to how these organic inhibitors bind to metal surfaces, and why sometimes minor modifications in the geometry structures can have a great influence on their efficacy. On the other hand, density functional theory (DFT) enables very excellent approximations for the complicated components of electronic motion called exchange and correlation.13 DFT that considers the electron density to explain the reactivity or stability is helpful to develop novel corrosion inhibitor molecules because it has already proven to be very helpful in quantitatively elucidating the structure–activity relationships.14 Unfortunately, DFT can only handle small to medium sized organics–metal adsorption systems since it usually accompanies the complex and time-consuming calculations. For example, Kokalj15–17 has systematically studied the adsorption of azoles on bare or oxidized copper surfaces using Quantum Espresso package. In our previous work, we made some investigations on small molecule adsorbate–metal substrate system by Dmol3 code.18,19 Despite the success of DFT in terms of the explanation of reactivity or stability of chemical compounds, accurate DFT calculations on molecules including hundreds of atoms are very expensive and time-consuming.
Many studies showed that large size organic corrosion inhibitors tend to present better inhibiting property than small ones, which can be attributed to that the former usually have more active site relative to the latter.20,21 They are able to produce a multi-anchoring adsorption and exhibit a high geometric covering effect, as displayed in Fig. 1. Therefore it is very necessary to introduce a new and unusual approach to solve the adsorption problem of large size inhibitors.
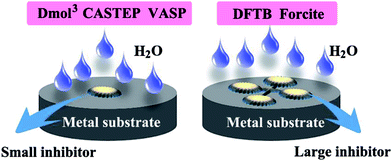 | ||
| Fig. 1 A comparative schematic for small and large size organic inhibitors adsorption on metal substrate. | ||
In this research, we focused on the adsorption of some large size organic corrosion inhibitors on iron surface using a relatively simple method, i.e., DFTB (see below for description). The main objective of this study is to obtain a qualitative description of these adsorption systems and a better understanding of the anticorrosive mechanism. Then, the most stable adsorption configurations, density of states, Mulliken charge as well as charge density difference will be theoretically analyzed.
2. Methods and computational details
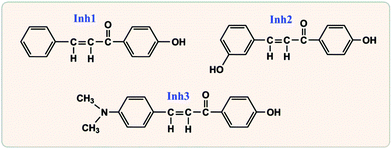
The density functional based tight binding (DFTB) method is based on a second-order expansion of the Kohn–Sham total energy in DFT with respect to charge density fluctuations. The zeroth order approach is equivalent to a common standard non-self-consistent scheme, while at second order a transparent, parameter-free, and readily calculable expression for generalized Hamiltonian matrix elements can be derived. The Coulombic interaction between partial atomic charges was determined by the self-consistent charge (SCC) formalism.22 It considerably reduces the computational cost, and offers a high degree of transferability as well as universality for both ground-state and excited-state properties. DFTB operates with the comparative efficiency and accuracy for organic matters, insulators, solids, clusters, semi-conductors, and metals, even biological systems are involved.23As seen in Fig. 2, the selected large size organic corrosion inhibitors are three chalcones derivatives, i.e., 3-(4-(dimethylamino)phenyl)-1-(4-hydroxyphenyl)prop-2-en-1-one (Inh1), 3-(3-hydroxyphenyl)-1-(4-hydroxyphenyl)prop-2-en-1-one (Inh2), and 1-(4-hydroxyphenyl)-3-phenylprop-2-en-1-one (Inh3), which have been identified as good inhibitors for carbon steel corrosion in hydrochloric acid solution.24 According to the electrochemical impedance spectroscopy experiment, for the same inhibitor concentration, the optimal inhibitive efficiency of Inh1, Inh2, and Inh3 were 91.3%, 87.0%, and 85.9%, respectively.24 The iron surface model consisted of a slab of four iron atomic layers. The unit cell was extended to a 7 × 7 supercell in x- and y-directions. Finally, a vacuum slab with 30 Å thickness was built on the iron surface. It is particularly worth mentioning here that we used the “Morphology” module25 in Materials Studio software (Version 7.0) to investigate the iron substrate in order to choose an appropriate adsorption surface.
All other computations were performed with the DFTB+ program package of Materials Studio. We used the trans3d Slater–Koster library set for all possible pair interactions between C, N, O, H, and Fe. Convergence tolerance for geometry optimization was 0.01 kcal mol−1 for energy, 0.1 kcal mol−1 Å−1 for force, and 0.001 Å for displacement. The relative SCC tolerance was set to 10−8 au elementary charge. To reduce the number of SCC iterations, Broyden mixing26 is used. Besides, fractional orbital occupation with a small thermal smearing parameter (0.001 Ha) was used to speed up SCC convergence. The k-points of 4 × 4 × 1 was selected. During the calculations, the two bottom layers of the slab were kept frozen to the ideal crystalline position, while the upper half of the slab and the inhibitor molecules were allowed to fully relax. Our DFTB calculation yields a lattice parameter of 2.899 Å for bulk bcc Fe, which agrees well with the experimental data (2.866 Å).27
To calculate the adsorption energies Eads, for all systems, the following equation was used as defined in our previous work:18,19,28
| Eads = Ecomplex − (EFe + Einh) | (1) |
Obviously, there usually exists more complicated circumstances in the real adsorption situation, for example, the iron surface can be positively charged in acid medium (charge effects),29,30 the substrate may be defective, stepped or oxidized (surface geometry effects),31,32 as well as that there exists solvent effect. It should be noted that this work is just a primary inquiry on adsorption issues of large size inhibitors. We just performed the simulations at vacuum/metal interface. Unquestionably, the calculations in the vacuum condition cannot perfectly reflect the real environment, but it is suitable for qualitatively illustrating the trend of the chemical interactions of interest. Some other factors will be gradually taken into account in our future work.
3. Results and discussion
3.1. Free chalcones derivatives
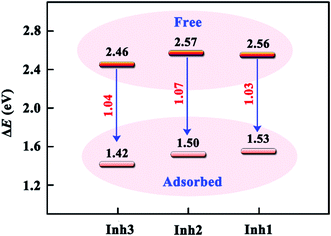
To identify the active characteristics of individual inhibitor molecule, the DFTB calculations for the chalcones derivatives in free forms were firstly performed. It is generally acknowledged that the bonding interaction between inhibitor molecules and metal surface depends on the Frontier orbital energetic position and the Fermi energy of metal.33 Fig. 3 shows the Frontier orbital energies for Inh1, Inh2, and Inh3 molecules.By careful examination of Fig. 3, it could be noticed that all the inhibitors exhibit very similar values of EHOMO (the energy of the highest occupied molecular orbital) and ELUMO (the energy of the lowest unoccupied molecular orbital). The EHOMO values are much higher than the Fermi level of iron (−13.16 eV, obtained by DFTB approach), and then the electrons can easily flow from the HOMO orbitals of chalcones derivatives to the empty iron orbitals until an equilibrium state was reached. As a global electronic index, the energy gap ΔE (ELUMO − EHOMO) is often adopted to express the chemical reactivity of the inhibitor molecules toward the substrate surface. However, there was some controversy about this descriptor. Some researchers think that a low ΔE value usually corresponds to a high inhibition efficiency in the inhibitor molecule.14,34 Conversely, some authors point out that the analysis of molecular electronic structure of organic inhibitors cannot straightforwardly predict the trend of their inhibition performance.35,36 Our calculated ΔE values are 2.56 eV, 2.57 eV, and 2.46 eV for Inh1, Inh2, and Inh3 respectively, in which the order is not in good agreement with experimental inhibitive efficiency mentioned above.24 Obviously, these results are consistent with the latter opinion. In fact, the factors that affect inhibition efficiency are complex, for instance, the molecule absorption orientation is sensitive to the dipole–dipole interaction.37 An approach solely focused on the inhibitors while ignoring the metal substrate is not perfect. This emphasizes the necessity of a rigorous modeling of the interactions between the corrosion inhibitors and the metal surface.
3.2. An investigation of iron surfaces
Crystal morphology study for α-Fe was performed in Morphology module using the equilibrium morphology model. It is known that the equilibrium morphology of a crystal is determined by the minimum of the surface free energy for a given volume and temperature.38 If the surface free energies are known for all relevant crystal faces, the morphology of a crystal in equilibrium with its surroundings can be visualized using the Wulff construction.39 In Morphology, the surface energy (Esurf) is calculated from the energy of a slab of finite thickness:
 | (2) |
| Dhkl = kEsurf(hkl) | (3) |
Calculated morphology parameters for α-Fe crystal using the equilibrium morphology method are given in Table 1. The symmetry multiplicities for the (110), (100) and (111) growth forms are 12, 6, and 8, respectively. The interplanar distance decreases gradually from (110) to (111) crystal face. The calculated surface energies (Esurf), which mostly originate from van der Waals force, decrease in the following sequence: (111) > (100) > (110), and this is in good agreement with reported trend by Arya and Carter.40 We hold that magnitude difference is acceptable, resulting from the different calculation methods. We also notice that the total facet area (TFA) of Fe(110) accounts for more than 63% of the crystal surface. The clean (110) and (100) surfaces possess only one type of surface atom with coordination numbers (N for short) 6 and 4, respectively, while the (111) surface has two kinds of surface atoms (where N = 4 or 6).
| hkl | Multiplicity | dhkla (Å) | Ahkl (Å2) | Esurf (J m−2) | Dhkl (Å) | TFAc (×108 Å2) | %TFAd | N |
|---|---|---|---|---|---|---|---|---|
| a Interplanar distance.b Ref. 40, obtained from DFT-GGA approach.c The total area of all symmetry images of the facet.d The percentage of the total habit surface area occupied by all symmetry images of the facet. | ||||||||
| (110) | 12 | 2.02 | 5.81 | 6.36, 2.28b | 9159.66 | 7.98 | 63.31 | 6 |
| (100) | 6 | 1.43 | 8.21 | 6.50, 2.30b | 9373.48 | 3.07 | 24.38 | 4 |
| (111) | 8 | 0.82 | 14.23 | 6.83, 2.66b | 9852.12 | 1.55 | 12.29 | 4, 6 |
For demonstration purposes, the habit information and three typical surface structures of α-Fe were given in Fig. 4. Obviously, the Fe(110) surface shows a density packed structure, it has a lower surface energy but a greater surface atom coordination number. Therefore, the Fe(110) surface was chosen to address the adsorption of chalcones derivatives, which is primarily because that it has more contact sites to interact with corrosion inhibitors. Actually, Fe(110) surface is also chosen as model for exploring the anticorrosive mechanism of corrosion inhibitors in conventional molecular dynamics simulations.41,42 But this morphology method can have an important significance for the determination of oxidized iron surfaces such as α-Fe2O3, γ-Fe3O4, and FeCO3.
3.3. Adsorption of chalcones derivatives on the Fe(110) surface
Firstly, one can argue that the nitrogen or oxygen atoms in the chalcones derivatives of interest can be protonated in acid media. Thus, as an example, we did the adsorption study of Inh3H (the protonated form of Inh3 molecule) on the Fe(110) surface. The adsorption configurations of Inh3H before and after the geometry optimization are given in Fig. S1 (ESI data†). We found that there existed a proton transfer process form the nitrogen atom to nearby carbon atom, and compared to the neutral adsorption, a slightly lower adsorption energy (−1.84 eV) was obtained. So the protonated state is metastable, it could be existed unless there are negatively-charged particles such as chloride ion. From this prospective, in this section, we just elaborate a discussion for the adsorption behaviour of inhibitors in neutral forms.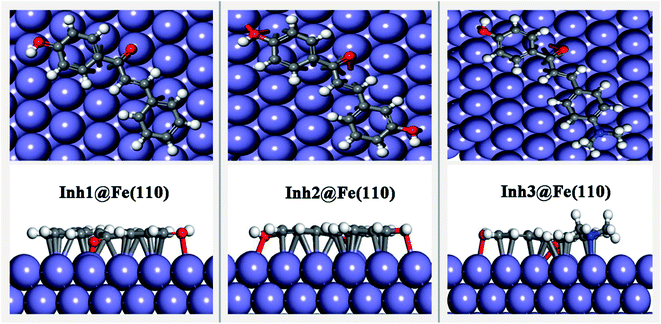 | ||
| Fig. 5 Equilibrium adsorption configurations performed for three chalcones derivatives on Fe(110) surface. Top: top view, down: side view. | ||
Table 2 lists some geometric parameters and adsorption energy values. The results show that the Eads values of three adsorption systems are negative, which reveals the adsorption is energetically favorable. Moreover, the stability of adsorption system can be measured by the magnitude of Eads, that is, the bigger the absolute value of Eads was, the stronger the inhibitor–Fe(110) interactions and the higher inhibition efficiency were. It is clear from Table 2 that the Inh3@Fe(110) adsorption system is more stable than the other two system and then exhibited the highest inhibition efficiency, which efficiently reduced the corrosion rate of carbon steel.24 The minimum N/O–Fe bond lengths are in the range between 1.9–2.2 Å, which is comparable to the sum of N/O and Fe atomic covalent radii (rNcov + rFecov = 0.71 + 1.32 = 2.03 Å, rOcov + rFecov = 0.66 + 1.32 = 1.98 Å),47 so this indicates that there the exists chemisorption between the studied inhibitors and Fe(110) surface.
| Inhibitor@Fe(110) | Bond lengthsa (Å) | ΔhFeb (Å) | dinh–Fec (Å) | Eads (eV) | CRd (mmy−1) | IEd % | |
|---|---|---|---|---|---|---|---|
| a RO–Fe and RN–Fe represent the minimum N/O–Fe distance.b ΔhFe, maximum vertical displacement of the surface Fe in contact with the inhibitor.c dinh–Fe, the vertical distance from the centroid of inhibitor molecule to the first layer iron atoms.d Expt. ref. 24. | |||||||
| Inh1 | RO–Fe | 1.925 | 0.195 | 2.620 | −1.35 | 38.7 | 82.5 |
| Inh2 | RO–Fe | 1.927 | 0.238 | 2.573 | −1.68 | 29.2 | 86.9 |
| Inh3 | RO–Fe | 1.943 | 0.295 | 2.514 | −1.94 | 20.9 | 90.6 |
| RN–Fe | 2.269 | ||||||
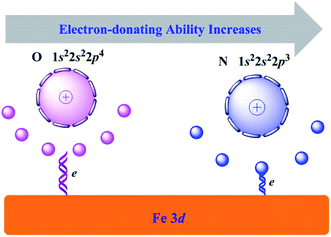
Since the modification of inhibitors to iron substrate, the iron atoms in the first layer relax outward with respect to the computed bulk-terminated geometry. The maximum vertical displacement, ΔhFe, increased gradually from Inh1 to Inh3. While the vertical distance (dinh–Fe) decreased in the sequence Inh1 > Inh2 > Inh3. These characteristics can be attributed to the number of N/O heteroatoms in the molecular structure. Owing to the oxygen atom has a larger electronegativity (χ) value than nitrogen atom (i.e., χO = 3.44, χN = 3.04),48 then as depicted in Fig. 6, its outer electrons are somewhat firmly held around the oxygen atom. Looked at another way, according to the Hard and Soft Acid and Bases (HSAB) theory, soft interacts better with soft. As bulk metals are chemically the softest materials, this would imply that the smaller is the electronegativity of coordination atoms the stronger is their interaction with metal surfaces. Consequently, oxygen has a slightly weaker electron-donating ability than nitrogen atom. This can be seen the main reason why Inh3 has a better inhibiting property than Inh2.
| Δρ = ρtotal − (ρinh + ρFe) | (4) |
 | ||
| Fig. 7 Charge density difference for the adsorption systems of chalcones derivatives on Fe(110). The blue region denotes electronic accumulation, while the red region denotes electronic loss. | ||
We also made quantitative analysis about the changes of Mulliken charge for some typical atoms between the free and adsorbed chalcones derivatives, and the results are collected in Table 3. Based on the tabulated atomic charges, a striking feature is that the charges for O1 atoms (in carbonyl group) increase while decrease for other atoms (such as O2, O3), especially N atom in the dimethylamino group. This confirms previous conclusion that N atom possesses greater electron-donating ability.
| Atoms | Inh1 | Inh2 | Inh3 | |||
|---|---|---|---|---|---|---|
| Free | Adsorbed | Free | Adsorbed | Free | Adsorbed | |
| O1 | −0.419 | −0.479 | −0.419 | −0.489 | −0.419 | −0.494 |
| O2 | −0.452 | −0.382 | −0.452 | −0.387 | −0.452 | −0.381 |
| O3 | −0.452 | −0.382 | ||||
| N | −0.384 | −0.065 | ||||
In Fig. 8, we show the total and partial density of states for clean Fe(110) surface with 7 × 7 geometry. We observe that the total density of states (TDOS) are mainly dominated by the cooperative contributions of Fe s, p, and d orbitals, among which Fe 3d is dominant. The Fe 3d state is distributed mainly in energy ranges from −5.0 to 4.8 eV. By comparison with previous Özcan and co-worker's reports, we find that the whole TDOS profile is in fairly good agreement with their calculated curve,50 and the locations of several main peaks are also basically consistent. Apparently, Fe has a large density of d-states at the EF, then it can be regarded as a more reactive transition metal with d-states partially occupied. This makes it much easier for the chalcones derivatives bonding with π-system to iron surface.
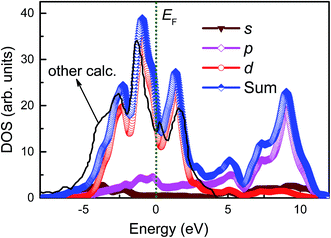 | ||
| Fig. 8 Calculated total and partial density of states for clean Fe(110) surface. Fermi energy (EF) is adopted as the zero energy level (green vertical line). | ||
Fig. 9 shows the PDOS of the inhibitor@Fe(110) systems before and after molecule–surface interaction. The top panel shows the PDOS for the molecule located 7 Å above the surface, i.e., in an unbound configuration, while the lower one shows the adsorbed state. Obviously, the plots are similar for all examined derivatives. The top figure can be used to present the alignment of the high-lying molecular valence states with the Fe 3d-band before the interaction occurs. It is evident that several molecular states (sharp peaks in the −4.0 to 0 eV regions) lie at the position of the Fe 3d band, which can be seen to describe the molecule–surface bonding upon adsorption. When the chalcones derivatives adsorb on the Fe(110) surface, the molecular PDOS is relatively unstructured in the vicinity of the Fermi energy for three flat configurations, and the intensity significantly decreases. A strong orbital hybridization occurred between the reactive sites in inhibitor molecules and Fe atoms. While the PDOS change for Fe 3d is not evident since we have performed the calculations at low coverages. After interacting with the surface, the molecular PDOS of Inh3 is considerably less spiky compared with Inh1 and Inh2, implying a stronger molecule–surface bond.
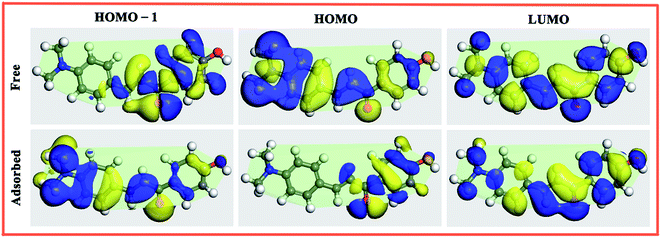 | ||
| Fig. 10 Molecular orbital plots for the Inh3 molecule from the HOMO−1 to LUMO under the free (upper row) and adsorbed state (lower row). (isovalue: ±0.005 e Å−3). | ||
Further quantitative analysis reveals that the adsorption of inhibitor molecule on Fe(110) surface reduces the energy gap of the chalcones derivatives involved. As shown in Fig. 11, the ΔE of isolated Inh3 molecule is 2.46 eV, whereas in the adsorbed system the ΔE is 1.42 eV. This is a pretty common phenomenon in the organic–metal interfaces. For example, Hahn and Kang51 reported that the energy gap of pyridine molecule decreases about 0.9 eV while interacting with Ag(110) surface. One way of explaining this is that the charging process of the topmost metal surface appeared to affect the electronic structure of the adsorbate in such a way that its molecular orbitals were fully stabilized by adsorption.
3.4. Mechanism of adsorption and inhibition
Finally, after investigating the adsorption mechanism at molecular/atomic level, a clarification of the anticorrosive mechanism in real environment medium is important. In the medium of hydrochloric acid, due to the specific adsorption effect of chloride ions, the pitting corrosion of iron bulk material can proceed by the following steps:29,52| Fe + Cl− ↔ (FeCl)ads + e− | (5) |
| (FeCl)ads ↔ (FeCl+) + e− | (6) |
| FeCl+ ↔ Fe2+ + Cl− | (7) |
As shown in Fig. 12, for iron specimens in HCl solutions inhibited by the chalcones derivatives, these organic surface modifiers can react rapidly with the surface Fe atoms. Then a strong protective layer (FeInh) was formed in the non-corroded (flat) area, which is very thin and could be a single monolayer.
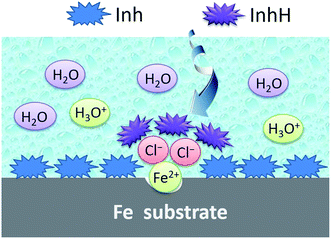 | ||
| Fig. 12 Proposed schematic for the adsorption mechanism of inhibitor on iron surface under hydrochloric acid medium. | ||
While in the corroded (low-lying) area, chloride ions may be preferred to adsorb onto the positively charged iron surface. On the other hand, some heteroatoms in the chalcones derivatives, such as nitrogen and oxygen, can be partially protonated (abbreviated as InhH) in a low pH value media. Thus, Cl− plays the role of a bridge joining the InhH and iron surface, then a thick and protective [FeClInhH] complex was formed. Ultimately, the diffusion of corrosive ions such as H3O+ can be blocked by the protective film and then the steel was effectively protected from corrosion.
4. Conclusions
The chalcones derivatives have proven experimentally to be efficient against the corrosion of carbon steel. In the present work, the interactions of three chalcones derivatives and iron surface have been simulated and analyzed by DFTB method. The Inh3 molecule present strong interaction toward Fe(110) surface with larger adsorption energy and smaller interaction distance, compared with Inh1 and Inh2. The hetero atoms in the chalcones derivatives are found to have high electron-donating ability and their inhibition efficiency increases in the order O < N. For all the molecules studied, they can chemisorb onto Fe(110) with their molecular plain being nearly parallel to the surface. The π-molecular orbitals play a decisive role for the adsorption performance.Acknowledgements
This research was sponsored by the Science and Technology Program of Guizhou Province (QKHJC 2016-1149), the Guizhou Provincial Department of Education Foundation (QJHKYZ2016-105, 2016-009), the Research Fund for the Doctoral Program of Tongren University (trxyDH1510), the National Natural Science Foundation of China (51462030), the Student's Platform for Innovation and Entrepreneurship Training Program (2016106665), and the Opening Project of Sichuan University of Science and Engineering (2016CL06).References
- X. G. Li, D. W. Zhang, Z. Y. Liu, Z. Li, C. W. Du and C. F. Dong, Nature, 2015, 527, 441–442 CrossRef CAS PubMed.
- F. M. Donahue and K. Nobe, J. Electrochem. Soc., 1965, 112, 886–891 CrossRef CAS.
- J. O. Mendes, E. C. da Silva and A. B. Rocha, Corros. Sci., 2012, 57, 254–259 CrossRef CAS.
- H. Lu, S. Zhang, W. Li, Y. Cui and T. Yang, ACS Appl. Mater. Interfaces, 2017, 9, 4034–4043 CAS.
- D. Dwivedi, K. Lepková and T. Becker, RSC Adv., 2017, 7, 4580–4610 RSC.
- E. A. Muller, B. Pollard, H. A. Bechtel, P. van Blerkom and M. B. Raschke, Sci. Adv., 2016, 2, e1601006 Search PubMed.
- M. Shahraki, M. Dehdab and S. Elmi, J. Taiwan Inst. Chem. Eng., 2016, 62, 313–321 CrossRef CAS.
- Z. Wang, Q. Lv, S. Chen, C. Li, S. Sun and S. Hu, ACS Appl. Mater. Interfaces, 2016, 8, 7499–7508 CAS.
- M. A. Chidiebere, E. E. Oguzie, L. Liu, Y. Li and F. Wang, Ind. Eng. Chem. Res., 2014, 53, 7670–7679 CrossRef CAS.
- H. Sun, P. Ren and J. R. Fried, Comput. Theor. Polym. Sci., 1998, 8, 229–246 CrossRef CAS.
- P. Hobza, M. Kabelac, J. Sponer, P. Mejzlik and J. Vondrasek, J. Comput. Chem., 1997, 18, 1136–1150 CrossRef CAS.
- S. L. Mayo, B. D. Olafson and W. A. Goddard, J. Phys. Chem., 1990, 94, 8897–8909 CrossRef CAS.
- C. K. Skylaris, Science, 2016, 351, 1394–1395 CrossRef CAS PubMed.
- G. Gece, Corros. Sci., 2008, 50, 2981–2992 CrossRef CAS.
- S. Peljhan, J. Koller and A. Kokalj, J. Phys. Chem. C, 2014, 118, 933–943 CAS.
- S. Peljhan and A. Kokalj, Phys. Chem. Chem. Phys., 2011, 13, 20408–20417 RSC.
- N. Kovačević, I. Milošev and A. Kokalj, Corros. Sci., 2015, 98, 457–470 CrossRef.
- L. Guo, W. P. Dong and S. T. Zhang, RSC Adv., 2014, 4, 41956–41967 RSC.
- L. Guo, I. B. Obot, X. Zheng, X. Shen, Y. Qiang, S. Kaya and C. Kaya, Appl. Surf. Sci., 2017, 406, 301–306 CrossRef CAS.
- P. Singh, E. E. Ebenso, L. O. Olasunkanmi, I. B. Obot and M. A. Quraishi, J. Phys. Chem. C, 2016, 120, 3408–3419 CAS.
- M. Finšgar and J. Jackson, Corros. Sci., 2014, 86, 17–41 CrossRef.
- M. Elstner, D. Porezag, G. Jungnickel, J. Elsner, M. Haugk, T. Frauenheim, S. Suhai and G. Seifert, Phys. Rev. B: Condens. Matter Mater. Phys., 1998, 58, 7260–7268 CrossRef CAS.
- T. Frauenheim, G. Seifert, M. Elstner, T. Niehaus, C. Kohler, M. Amkreutz, M. Sternberg, Z. Hajnal, A. Di Carlo and S. Suhai, J. Phys.: Condens. Matter, 2002, 14, 3015–3047 CrossRef CAS.
- A. S. Fouda, M. A. Elmorsi and A. Elmekkawy, Afr. J. Pure Appl. Chem., 2013, 7, 337–349 CrossRef.
- R. F. P. Grimbergen, H. Meekes, P. Bennema, C. S. Strom and L. J. P. Vogels, Acta Crystallogr., Sect. A: Found. Crystallogr., 1998, 54, 491–500 CrossRef.
- G. Kresse and J. Furthmuller, Phys. Rev. B: Condens. Matter Mater. Phys., 1996, 54, 11169–11186 CrossRef CAS.
- E. P. Yelsukov, E. V. Voronina and V. A. Barinov, J. Magn. Magn. Mater., 1992, 115, 271–280 CrossRef.
- X. W. Zheng, S. T. Zhang, W. P. Li, L. L. Yin, J. H. He and J. F. Wu, Corros. Sci., 2014, 80, 383–392 CrossRef CAS.
- S. A. Umoren and M. M. Solomon, J. Ind. Eng. Chem., 2015, 21, 81–100 CrossRef CAS.
- M. Mobin and M. Rizvi, Carbohydr. Polym., 2017, 156, 202–214 CrossRef CAS PubMed.
- J. Radilla, M. Boronat, A. Corma and F. Illas, Phys. Chem. Chem. Phys., 2010, 12, 6492–6498 RSC.
- A. Kokalj, Faraday Discuss., 2015, 180, 415–438 RSC.
- B. Hammer and J. K. Norskov, Adv. Catal., 2000, 45, 71–129 CAS.
- Y. Gong, Z. Wang, F. Gao, S. Zhang and H. Li, Ind. Eng. Chem. Res., 2015, 54, 12242–12253 CrossRef CAS.
- A. Kokalj, Electrochim. Acta, 2010, 56, 745–755 CrossRef CAS.
- L. Guo, S. Zhu, S. Zhang, Q. He and W. Li, Corros. Sci., 2014, 87, 366–375 CrossRef CAS.
- N. Kovacevic and A. Kokalj, J. Phys. Chem. C, 2011, 115, 24189–24197 CAS.
- J. W. Gibbs, Collected works, Longman, New York, 1928 Search PubMed.
- D. Winn and M. F. Doherty, AIChE J., 2000, 46, 1348–1367 CrossRef CAS.
- A. Arya and E. A. Carter, J. Chem. Phys., 2003, 118, 8982–8996 CrossRef CAS.
- M. A. Chidiebere, E. E. Oguzie, L. Liu, Y. Li and F. H. Wang, Ind. Eng. Chem. Res., 2014, 53, 7670–7679 CrossRef CAS.
- L. L. Liao, S. Mo, H. Q. Luo and N. B. Li, J. Colloid Interface Sci., 2017, 499, 110–119 CrossRef CAS PubMed.
- S. K. Saha, A. Dutta, P. Ghosh, D. Sukul and P. Banerjee, Phys. Chem. Chem. Phys., 2016, 18, 17898–17911 RSC.
- N. Ding, X. Chen and C.-M. L. Wu, Environ. Sci.: Nano, 2014, 1, 55–63 RSC.
- A. Dutta, S. K. Saha, P. Banerjee and D. Sukul, Corros. Sci., 2015, 98, 541–550 CrossRef CAS.
- N. Kovacevic and A. Kokalj, Mater. Chem. Phys., 2012, 137, 331–339 CrossRef CAS.
- P. Pyykko and M. Atsumi, Chem.–Eur. J., 2009, 15, 186–197 CrossRef PubMed.
- R. G. Parr and R. G. Pearson, J. Am. Chem. Soc., 1983, 105, 7512–7516 CrossRef CAS.
- T. A. Baker, C. M. Friend and E. Kaxiras, J. Am. Chem. Soc., 2008, 130, 3720–3721 CrossRef CAS PubMed.
- M. Ozcan, D. Toffoli, H. Ustunel and I. Dehri, Corros. Sci., 2014, 80, 482–486 CrossRef CAS.
- J. R. Hahn and H. S. Kang, Surf. Sci., 2010, 604, 258–264 CrossRef CAS.
- R. Solmaz, G. Kardas, M. Culha, B. Yazici and M. Erbil, Electrochim. Acta, 2008, 53, 5941–5952 CrossRef CAS.
Footnote |
| † Electronic supplementary information (ESI) available. See DOI: 10.1039/c7ra04120a |
| This journal is © The Royal Society of Chemistry 2017 |

