 Open Access Article
Creative Commons Attribution 3.0 Unported Licence
The high photocatalytic activity and reduced band gap energy of La and Mn co-doped BiFeO3/graphene nanoplatelet (GNP) nanohybrids
Sabeen Fatimaa,
S. Irfan Ali b,
Muhammad Z. Iqbal*c and
Syed Rizwan
 *a
*a
aDepartment of Physics, School of Natural Sciences (SNS), National University of Science & Technology (NUST), Islamabad 44000, Pakistan. E-mail: syedrizwanh83@gmail.com; Tel: +92-9085-5599
bState Key Laboratory for New Ceramics & Fine Processing, School of Materials Science & Engineering, Tsinghua University, Beijing 100084, China
cDepartment of Chemical and Petroleum Engineering, United Arab Emirates University, (UAEU), PO Box 15551, Al Ain, United Arab Emirates. E-mail: mziqbal@uaeu.ac.ae; Tel: +971-371-35398
First published on 19th July 2017
Abstract
Recently, bismuth ferrites have attracted great interest in the field of photocatalysis due to their magnetic nature and narrow band gap. Herein, nanohybrids of lanthanum (La) and manganese (Mn) co-doped BiFeO3 (BLFMO)/graphene nanoplatelets (GNPs) have been synthesized. The hybrids were prepared by two different but simple and low-cost synthesis routes: (i) co-precipitation (namely the C-series), and (ii) hydrothermal (namely the H-series) methods. This article details a comparison of the C-series and H-series BLFMO/GNP nanohybrids based on their photocatalytic activity and band gap. The H-series nanohybrids showed a more crystalline structure, reduced band gap and less dye removal compared to the C-series nanohybrids. The enhanced dye removal (92%) of the C-series nanohybrids is attributed to their high surface area (55 m2 g−1) due to GNP incorporation inside the BLFMO/GNP nanohybrids. The higher surface area enables more adsorption of dye molecules over the catalyst surface under dark conditions. In addition, the band gap of the BLFMO/GNP nanohybrids was reduced from 2.04 eV (pure BiFeO3) to 1.40 eV (BLFMO/GNPs) because of the presence of new donor energy levels with Mn loading. The calculated particle sizes from Scherrer’s formula were 19.3–23.5 nm (C-series) and 22.5–26 nm (H-series). The estimated particle size calculated via transmission electron microscopy (TEM) is approximately 31 nm for the C-series nanohybrids. The graphene based nanohybrids significantly enhanced dye removal compared to pure BiFeO3 (44%) under visible light irradiation. The low cost, easy preparation and higher catalytic activity of the BLFMO/GNP nanohybrids reported here make nanohybrids suitable candidates for practical applications.
1 Introduction
With the tremendous increase in population and industrialization, photocatalytic degradation of harmful substances has been a very important technique for producing purified water. Textile effluents discharged into water bodies contain certain toxic pollutants dangerous to human health (such as tartrazine,1 methylene blue,2 congo red,3 indigo carmine,4 etc.). Photocatalysts are used for the purification of coloured waste water by degrading the organic debris.5 Over the past few decades, the development of efficient nanophotocatalysts for water purification has been the main focus of research to produce purified water.6Photocatalysts are materials which produce strong oxidizing agents (superoxides and hydroxyl radicals) with electronic holes in the presence of water and UV or visible light. The hydroxyl radicals and superoxides help in removing organic pollutants from water.7 A low recombination of charge carriers, tunable band gap for promoting the charge efficiently and a high surface area to absorb a broad spectrum of radiation are the essential requirements for an enhanced photocatalytic activity.8,9 Various metal oxide semiconductors10 are commonly used as photocatalyst materials. Among early photocatalysts, TiO2 was proven to be a potential metal oxide photocatalytic material for the degradation of organic molecules such as methylene blue, sulfosalicylic acid, etc.11,12 due to the high recombination rate of charge carriers and being the only ultraviolet light-driven catalyst, however, it is restricted for practical applications due to its wide band gap (3.2 eV). Economically, an efficient and cost effective photocatalytic system is usually required. As sunlight is a naturally available source of energy it can be used as a cheap energy source for meeting the cost requirements of industry. So in practice, based on its widespread availability and being a natural energy source, solar light can be a potential energy source containing visible light for photocatalytic degradation. Thus, exploring economical photocatalysts that can work under visible light is the main objective of this study.
Semiconductor based photocatalytic systems are getting more attention recently for the fast and efficient degradation of organic molecules. A lot of work has been done with various systems including LaFeO3,13 YFeO3,14 GdFeO3,15 LuFeO3 (ref. 16) and PreFeO3 (ref. 17) for which good photocatalytic results have been reported. Bismuth ferrite BiFeO3 (BFO) is a well known perovskite multiferroic material exhibiting both ferroelectricity and antiferromagnetism at room temperature.18,19 BFO also responds actively to visible light, attributed to its narrow band gap (2.2 eV)20 which further makes it an ideal candidate for the catalytic degradation of the organic pollutants.20 In addition, the magnetic nature of BFO makes its recovery from waste-water easy, and thus increases its recyclability potential. Areas such as the photocatalytic activity of BFO have been extensively researched in the context of various applications ranging from photolysis of methyl orange to methyl orange degradation.21–27 Due to the high recombination rate of photo-generated charge carriers (e−–h+ pairs), the catalytic performance of bismuth ferrite is significantly enhanced. Therefore, increasing the photocatalytic effectiveness of BFO is another objective of this study.
Several modifications to BFO are possible in this context. The BFO material can be synthesized in the form of nanoparticles with controlled size or shape,28 thin films,20 nanowires,28 and micro-crystals.29 Meanwhile, the band gap of BFO can also be engineered via metal ion doping,30–33 thus various hybrid structures can be fabricated with other suitable nanomaterials.34,35
The two-dimensional (2D) allotrope of carbon called graphene consists of a single sheet of carbon atoms arranged hexagonally with sp2 hybridization. Graphene has been proven to be a promising nanomaterial for various applications, attributed to its outstanding properties such as high electron mobility,36 very large surface area (theoretical surface area of 2600 m2 g−1),37 excellent conductivity (5000 W mK−1),38 stability and mechanical strength (Young’s modulus = 0.5 TPa).39 Graphene, in its composite form with other materials, has exhibited comparatively good photocatalytic activity against the pure form of these particles due to its high degradation ability for organic pollutants during waste water treatment.40–43 A high surface area is exhibited by single layer graphene. However, single layer graphene is very expensive and is difficult to prepare commercially. Moreover, the tendency of graphene nanosheets to re-agglomerate in dried single layer graphene reduces its commercial applications.44
Graphene nanoplatelets (GNPs), a low cost commercial product, are comprised of multilayers of graphene45 (10 to 30 layers or more) in the form of flakes, particles or plates. The GNPs have a thickness in the nanometer range, and are less vulnerable to defects. Although GNPs exhibit a relatively lower surface area than that of the single layer graphene, they offer a high interfacial area for manufacturing hybrid structures with other nanoparticles. When preparing a hybrid or composite, uniform dispersion is a big challenge and GNPs form a good stable dispersion in comparison to the single layer graphene which is more susceptible to curling up during dispersion shearing.45 Thus, the GNPs are good nano-fillers for hybrid or composite formation with polymers or other materials.46 Recently, hybrid structures of GNPs with magnesium oxide (MgO) showed a higher photocatalytic performance under visible light for purifying waste water.47 Similarly the photocatalytic activity of ZnO/BFO was also reported48 and showed good results. The large surface area of the graphene sheets inside the GNPs significantly lowers the recombination rate of charge carriers with excellent carrier mobility.49 The presence of reactive edge-atoms and the low band gap energy also enable fast photo-degradation.50 The combination of all these properties makes GNP hybrids efficient photocatalysts as well as economically suitable for large scale applications.
Here, lanthanum (La) and manganese (Mn) co-doped BFO nanoparticles, prepared by a modified sol–gel method, were further used to synthesize nanohybrid structures with GNPs. La and Mn are used for doping as they both have good photocatalytic properties compared to pure BFO and have already been reported.31,51,52 Furthermore, Mn doping also helps in reducing the band gap of BFO.53 A completely new hybrid system based on GNPs is introduced here and two variations are named based on their synthesis routes, namely by co-precipitation (namely the C-series) and hydrothermal synthesis (namely the H-series) routes. These nanohybrids were characterized to compare the structure and morphology of both the C and H series nanohybrids. A series of experiments was carried out in order to understand the photocatalytic activity of both series. The H-series nanohybrids showed more crystallinity as compared to the C-series nanohybrids which have more disorder due to the enhanced fusion of the graphene sheets inside the nanoparticles. Photoluminescence (PL) spectroscopy and X-ray photoluminescence spectroscopy (XPS) were also performed to analyze the recombination rate of charge carriers and the elemental composition of the nanohybrids, which helped in supporting the results of the photocatalysis. The C-series nanohybrids exhibited higher dye adsorption over the catalytic surface compared to the H-series but the H-series caused more photodegradation of the dye under visible light irradiation compared to the C-series nanohybrids.
2 Experimental details
2.1 Materials
Graphene nanoplatelets (GNPs) (A-12, Graphene Supermarket), ethylene glycol (≥99%), bismuth nitrate (99% pure), iron nitrate (98.5% pure), acetic acid (≥99.5%), lanthanum nitrate (98.5% pure), manganese nitrate (50% sol.) and congo red were used as received.2.2 BLFMO nanoparticle synthesis
Bismuth ferrite nanoparticles were doped with 5% lanthanum (La) and a variable amount of manganese (Mn) from 5–25% using a previously reported double solvent sol–gel method.31 The as-prepared series are named BLFO (La doped BFO), BLFMO-5 (Mn = 5%), BLFMO-10 (Mn = 10%), BLFMO-15 (Mn = 15%), BLFMO-20 (Mn = 20% Mn), and BLFMO-25 (Mn = 25%).2.3 Synthesis of GNP nanohybrids
![[thin space (1/6-em)]](https://www.rsc.org/images/entities/char_2009.gif) :
:![[thin space (1/6-em)]](https://www.rsc.org/images/entities/char_2009.gif) 1 solution of acetic acid and ethylene glycol under continuous sonication at 60 °C for 2.5 hours. The GNP and BLFMO dispersions were combined at room temperature and were further sonicated for 15 minutes followed by magnetic stirring for one hour. The temperature was maintained at 85 °C during mixing and the hybrid structures settled in the form of precipitates. The precipitates were washed multiple times with deionized water and filtered through filter paper (Whatman 0.2 μm). The filtrate was dried overnight at 55 °C in a drying oven.
1 solution of acetic acid and ethylene glycol under continuous sonication at 60 °C for 2.5 hours. The GNP and BLFMO dispersions were combined at room temperature and were further sonicated for 15 minutes followed by magnetic stirring for one hour. The temperature was maintained at 85 °C during mixing and the hybrid structures settled in the form of precipitates. The precipitates were washed multiple times with deionized water and filtered through filter paper (Whatman 0.2 μm). The filtrate was dried overnight at 55 °C in a drying oven.2.4 Characterization
Wide angle X-ray diffraction (XRD) was performed on a Rigaku-2500 with Cu-K radiation at a scanning rate of 1° per second. The XRD spectra were recorded in the 2θ range of 20° to 60°. The micrographs of platinum-sputter coated nanoparticles were obtained using a JEOL-7001F field emission scanning electron microscope (FESEM) at accelerating voltages of 1.5 to 3 keV.2.5 Photocatalytic degradation study
The hydrothermally synthesized nanohybrids were used for the photocatalytic degradation application. A UV-vis spectrophotometer (Hitachi UV-3310) was used for the measurement of photocatalytic degradation and for recording the diffuse reflectance spectra (DRS) of the nanohybrids. Approximately 100 mg of the photocatalyst was dispersed in 100 mL of congo red (CR) dye solution (the initial concentration of the dye solution was 100 mg L−1) and stirred for 120 minutes in the dark. To avoid the thermal degradation of CR in solution, an ice bath was used and constant stirring was maintained.33 A xenon lamp (300 W) was used as the visible light source, whereas a light emitting diode of 5 W was used as the ultraviolet (UV) radiation source. During the course of the photocatalytic reaction, small samples of ∼3 mL of the solution were periodically removed every 30 minutes, and centrifuged at 7000 rpm. The supernatant was separated by simply pouring it out from the top of centrifugal tube, and tested for the residual concentration of CR using a UV-vis spectroscope (Hitachi UV-3310) at maximum wavelength = 496 nm.31 The degradation efficiency can be determined by the following formula,where Co is the initial dye concentration in solution and Ct is the concentration of dye at a specific time.54
The optical absorption coefficient followed the Kubelka–Munk function55 near the band edge which corresponds to (αhν) = A(hν − Eg)n/2. Here, A is a constant number, Eg is the band gap energy, h is Planck’s constant, and ν is the light frequency. The optical band gaps for BFO, BLFO/GNP and BLFMO/GNP were obtained by plotting (αhν)2 versus the photon energy. The band gap energy (Eg) was obtained by extrapolating a straight line over the photon energy against (αhν)2 plot to the point where it becomes zero.
3 Results and discussion
3.1 Structural analysis of the nanoparticles and nanohybrids
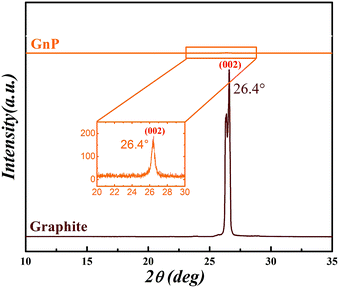
The XRD diffraction patterns provide fundamental evidence regarding the quality of the available graphene. Fig. 1 shows a comparison between the XRD patterns of graphite and the GNPs. A strong diffraction peak (002) was observed at 26.4° for graphene corresponding to a d-spacing of 0.34 Å. A strong and narrow peak for graphite indicates the presence of a highly stacked structure. The particle size of graphite was calculated to be ∼145 nm from the Scherrer analysis.56 On the other hand, compared to graphite, the GNPs exhibited no significant diffraction pattern. The inset in Fig. 1 shows an enlarged section of the GNP XRD pattern, showing a small diffraction peak at 26.4°, corresponding to a particle size of ∼35 nm. A small graphitic peak exhibited by the GNPs further indicates the presence of some residual stacking in the GNPs. The intensity of the GNP peak is much lower than that of the graphite, attributed to the exfoliated nature and platelet structure of the graphene.Assuming a perfect interlayer spacing of 3.37 Å between graphene layers of ∼1 nm thickness, a particle size of 35 nm means that approximately 24 graphene sheets are stacked in one GNP particle. Generally, graphene particles containing less than 10 graphene sheets are considered high quality graphene57 for high surface area applications such as polymer nanocomposites.58 In these applications, GNPs might not be as effective as high quality graphene produced by thermal exfoliation and reduction of graphite oxide containing 4–5 graphene layers.59,60
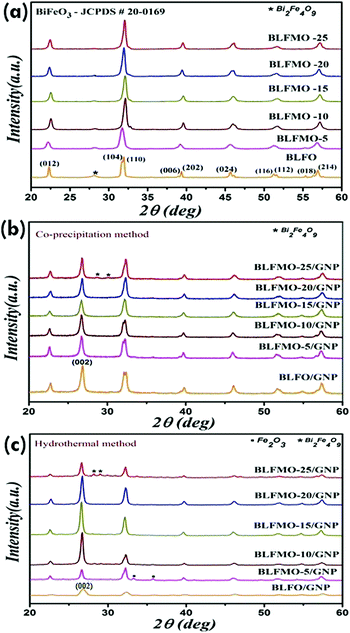
The effect of doping on the structure of the nanohybrids was studied using XRD. In this section, the XRD patterns for the Mn-doped nanohybrids (Fig. 2a), the nanohybrids prepared via the co-precipitation method (also called C-series here) (Fig. 2b), and the nanohybrids prepared via the hydrothermal method (also called H-series hereafter) (Fig. 2c) are discussed. The XRD patterns of the BLFO and BLFMO nanoparticles with various GNP loadings are shown in Fig. 2a. The labelled peaks of bismuth ferrite corresponding to its primitive hkl planes, e.g., (012), (104), (110), (006), (202), (024), (116), (112), (018), and (214), match with JCPDS card no. 20-0169. The addition of La in BFO distorted its perovskite rhombohedral structure, and caused a decrement in the intensity of the peaks.61 An impurity phase of Bi2Fe4O9 also appeared with La doping, and it was suppressed and vanished later due to Mn addition. With an increasing amount of Mn from 5% to 25%, Bi/Fe deficiencies were compensated, causing the removal of impurities. An overlapping of peaks was observed with an increasing concentration of Mn (BLFO to BLFMO), attributed to the complete phase transformation in the crystal structure from rhombohedral to orthorhombic.31 With the addition of Mn, the peak was shifted towards a larger angle up to Mn = 15%. Meanwhile, the lattice constant decreased due to the inverse relation between the d-spacing and diffraction angle. The decrement in inter-planar spacing is attributed to the replacement of Mn atoms with Fe atoms with an increase in dopant concentration since iron has a larger atomic radius than Mn.62 On increasing the Mn concentration above 15%, there will be a negative shift in the peaks.31 Trapping of the Mn atoms and defect states are the main reasons for the broadening of the XRD peaks for the BLFMO-20 and BLFMO-25 nanoparticles. Furthermore, the crystallite size is also reduced because of the strain produced inside the crystal lattice by the trapping of Mn atoms.63
Fig. 2b contains the XRD patterns of the C-series nanohybrids. Similar diffraction patterns were observed for the doped BLFO and BLFMO nanohybrids. An intrinsic (002) graphitic peak was also observed for the GNPs in the hybrids which gives an indication towards the fabrication of the GNP-based hybrid structure. A very small impurity phase of Bi2Fe4O9 was observed in the BLFMO-25/GNP hybrid structure. Overall, the intensity of the XRD peaks was lowered due to the lower periodicity due to the effect of incorporation of the disordered graphene sheets into the BLFO and BLFMO crystal structures. In addition, peak broadening was also observed in the GNP-based nanohybrids, attributed to the low crystallite size.64 The particle size of the nanohybrids calculated from Scherrer’s formula ranged from 19.3 nm to 23.5 nm. Moreover, the disjoining of peaks (104) and (110) in the BLFO/GNP, BLFMO-5/GNP and BLFMO-10/GNP hybrids shows a small distortion in the rhombohedral crystal structure.31
Similarly, the structure of the nanohybrids prepared via the hydrothermal method (the H-series) was studied by XRD, as shown in Fig. 2c. The (002) graphitic peak for the GNPs was observed to increase with increasing concentration of GNPs in the nanohybrids. The presence of narrow, high intensity XRD peaks further indicates that the nanohybrids have a more regular (periodic) and crystalline structure than that of the C-series nanohybrids prepared by the co-precipitation method (see Fig. 2b) in which the crystallization process is delayed due to the enhanced fusion of graphene sheets at nucleation sites.65 Usually, the higher the crystallinity, the fewer the defects and the less disordering there is in the hybrid structure. Two small impurity phases of Fe2O3 and Bi2Fe4O9 were observed in the BLFMO-5/GNP and BLFMO-25/GNP hybrid structures. As the H-series hybrids are more crystalline, the impurities are also in a more ordered form than those of the C-series hybrids which are disordered like the crystal structure. The calculated particle size for the H-series nanohybrids ranged from 22.5 nm to 26 nm. The slight positive shift in the (002) peak for the nanohybrids is attributed to the strain produced with the loading of BLFO and BLFMO nanoparticles inside the graphene layers.66
3.2 Morphological analysis
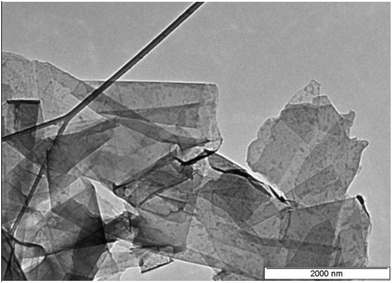
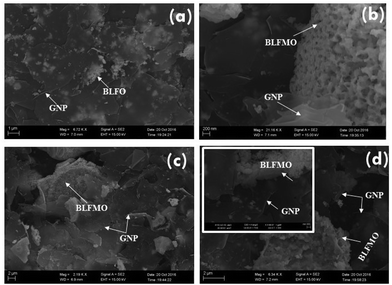
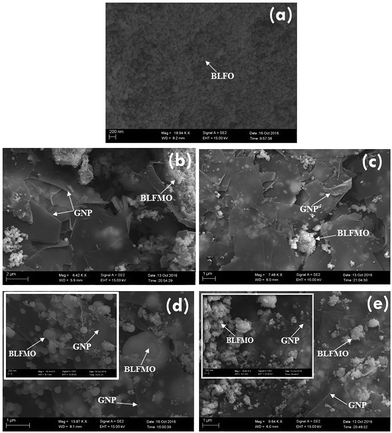
The morphologies of the GNPs and the nanohybrids were studied using a scanning electron microscope. Fig. 3 shows a transmission electron microscope image of graphene nanoplatelets (GNPs). The graphene sheets are flat and smooth with sharp corners and are clearly visible. The SEM micrographs of the C-series nanohybrids are shown in Fig. 4. The white granular part (clearly visible at the interface) represents the BLFO or BLFMO particles, and the layered part shows the presence of GNP nanosheets in the multiphase nanohybrid structures. The presence of multiple phases further affirms the successful preparation of nanohybrids of BLFO/GNP and BLFMO/GNP. In the nanohybrids, the metallic nanoparticles are well dispersed on the surface as well as on the edges of the graphene nanosheets. The surface and edge distribution of the nanoparticles is hypothesized to give an icy transparent effect to the hybrid structure. The dispersion of the BLFO nanoparticles was more homogeneous on the graphene sheets (Fig. 4a). However, agglomeration of the BLFMO nanoparticles occurred during attachment onto the graphene sheet. The agglomerated clusters of BLFMO nanoparticles have irregular shapes (Fig. 4b–d), and the agglomerate size increased with Mn loading. We also studied the morphology of the nanohybrids prepared via the hydrothermal method (H-series) using FESEM (Fig. 5). In the BLFO/GNP hybrids, the BLFO nanoparticles are evenly distributed on the surface of the graphene nanosheets so that no portion of the graphene is visible in the SEM micrographs (Fig. 5a). On the other hand, the BLFMO nanoparticles also showed better dispersion and distribution on the graphene surface (Fig. 5b–e). Increasing the concentration of Mn still produced agglomerated clusters, which were smaller than those observed from the co-precipitation method.TEM images for the BLFMO/GNP nanohybrid structures of the C-series are shown in Fig. 6. The spherical nanoparticles of BLFMO, connected at the interfaces and distributed over the GNP layers in the form of clusters, are clearly visible in the TEM images, which verifies the presence of both phases (nanoparticles and sheets) inside the nanohybrids. The particles inside the C-series BLFMO/GNP nanohybrids are in the form of clusters and are also visible in the SEM images. Due to overlapping of the nanoparticles, it is very hard to see the separate spherical nanoparticles over the GNP layers. The estimated particle size from the TEM images of the C-series BLFMO/GNP nanohybrid (using the software ImageJ) is ∼31 nm.
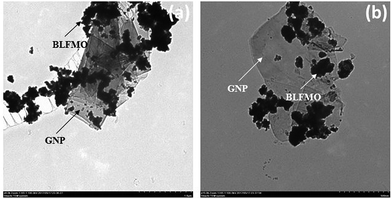 | ||
| Fig. 6 TEM images of the BLFMO/GNP nanohybrids of the C-series at 200 nm at (a) ×20 and (b) ×40 resolution. | ||
The XRD and morphological study of the nanohybrids produced via the hydrothermal method show that the H-series is more crystalline and has more controlled growth compared to the C-series in which the crystal structure is disordered due to the enhanced growth of the nanoparticles over the graphene sheets. In the following sections, the H-series and C-series nanohybrids have been subjected to photocatalytic activity experiments.
3.3 Band gap analysis and photocatalytic activity of the nanoparticles/GNP nanohybrids
Diffuse reflectance spectroscopy was utilized to study the optical band gap in the nanoparticle systems. The UV-vis absorption spectra of the BLFO/GNP and BLFMO/GNP nanohybrids are compared to that of pure BFO and are shown in Fig. 7. At first, there is less optical absorption for the BLFMO/GNP nanohybrids compared to pure BFO in the ultraviolet region. An overlap occurs at around 550 nm and the optical absorptions for the BLFMO/GNP hybrid structures increase in comparison to that of pure BFO in the visible region. The increase in optical absorption in the visible range enables the BLFMO/GNP nanohybrids to perform better as visible light-driven photocatalysts. The optical band gaps for BFO and the BLFMO/GNP nanohybrids were also calculated (shown in the inset of Fig. 7). The obtained band gap for BFO is 2.04 eV which is quite similar to previously reported results.21,22,30 The band gap, which is slightly decreased with the doping of Mn inside the BFO nanoparticles, is estimated by drawing a straight line over the (αhν)2 vs. energy plot. Finding where the straight line meets the x-axis gives a value of ∼1.04 eV for BLFMO-25/GNP. In this case, because of slight changes in optical absorption, it was a bit difficult to compute the onset of the drop in optical absorption for the other nanohybrids. Thus the band gap is a bit difficult to approximate using the straight line method. The decrease in band gap is attributed to the enhanced photocatalytic activity of BFO.67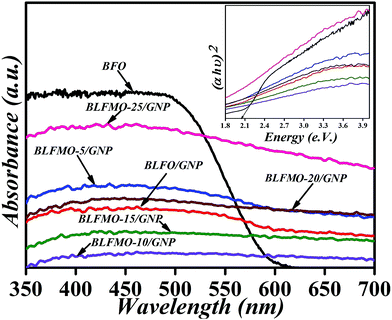 | ||
| Fig. 7 UV-vis absorption spectra of pure BFO, BLFO/GNP and the BLFMO/GNP nanohybrids; inset: calculation of their respective bands. | ||
The photocatalytic efficiencies of the nanohybrids were studied by measuring the degradation of congo red (CR) in aqueous solution under visible light irradiation. Fig. 8 shows the photodegradation efficiencies of the H and C-series nanohybrids versus irradiation time. The lower the remaining concentration of CR in solution, the higher the photocatalytic activity of the catalytic system. The pure BFO nanoparticles (1 mg mL−1) showed approximately 40% degradation of CR in 120 minutes. On the other hand, surprisingly, the addition of GNPs inside BLFMO nanoparticles enhanced dye adsorption over the surface of the BLFMO/GNP nanohybrids in the dark. In the H-series nanohybrids, BLFMO-15/GNP, BLFMO-20/GNP and BLFMO-25/GNP adsorb 36%, 65% and 54% of dye molecules over their surfaces while under visible light, respectively, and they degrade 19%, 11% and 9% of the dye molecules, respectively, as shown in Fig. 8a. Hence, the surface adsorption and photocatalytic degradation together give the total removal of the organic dye from the aqueous solution. The total removal of the organic dye for BLFMO-15/GNP, BLFMO-20/GNP and BLFMO-25/GNP is 55%, 76% and 63%, respectively.
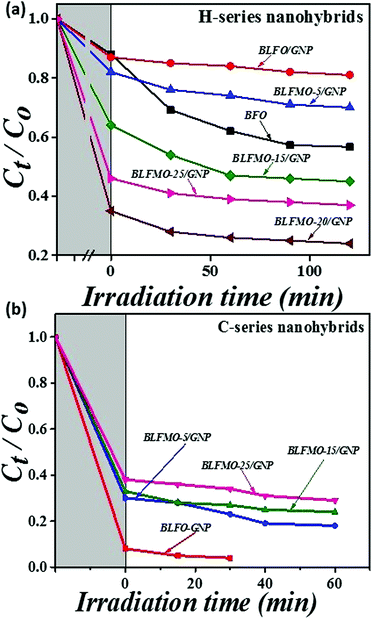 | ||
| Fig. 8 Photocatalytic efficiencies of BFO and the BLFMO/GNP nanohybrids from (a) the H-series and (b) the C-series in the removal of congo red dye. | ||
The catalytic activity of the C-series nanohybrids is shown in Fig. 8b. The surface adsorption of dye molecules is significantly enhanced in the C-series nanohybrids compared to that of the H-series nanohybrids. The adsorption of the dye over the surface of BLFO/GNP, BLFMO-5/GNP, BLFMO-15/GNP and BLFMO-25/GNP is 92%, 70%, 67% and 62%, respectively. The photodegradation of the organic dye by BLFO/GNP, BLFMO-5/GNP, BLFMO-15/GNP and BLFMO-25/GNP is 4%, 12%, 9% and 8%, respectively. The total removal of dye by BLFO/GNP, BLFMO-5/GNP, BLFMO-15/GNP and BLFMO-25/GNP is 96%, 82%, 76% and 70%, respectively.
The complete catalytic activity mainly depends upon the surface adsorption over the catalyst surface which is comparatively higher for the C-series nanohybrids than for the H-series. The complete dye removal took 120 minutes for the H-series nanohybrids while it only took 60 minutes for the C-series BLFMO/GNP nanohybrids. The highest dye removal is for the BLFO/GNP nanohybrid structure of the C-series which occurs in 30 minutes due to the highest adsorption of dye over the catalyst surface. This adsorption of dye is due to enhanced graphene fusion inside the BLFO nanoparticles. As the GNP dispersion was sonicated for longer in the C-series than in the H-series, the exfoliation of graphene layers is greater in the C-series which results in higher graphene yield in the C-series. Hence, the enhanced graphene incorporation in the C-series nanohybrids causes more organic molecule adsorption over the catalyst surface. In the following section, photoluminescence (PL) and X-ray photoelectron spectroscopy are performed which support the results of photocatalytic activity.
3.4 Photoluminescence spectra of the C-series nanohybrids
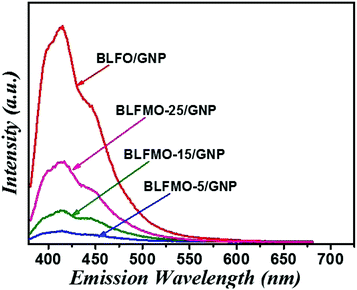
The photoluminescence spectra show the recombination rate and charge separation inside the photocatalysts. The higher the intensity in the PL spectrum, the higher the recombination rate of charge carriers,47 hence the photocatalytic degradation efficiency is lowered. Graphene, being a good trapping site for electrons, helps the efficient charge separation after loading of the graphene nanoplatelets. The PL peak intensity is usually reduced which results in efficient charge transfer over the catalyst surface.48 The PL spectra of the C-series nanohybrids are shown in Fig. 9. Among the C-series nanohybrids, the PL peak intensities are lower for BLFMO-5/GNP and BLFMO-15/GNP as compared to those of BLFMO-25/GNP and BLFO/GNP. The lower PL intensity shows a low recombination rate of charge carriers because the graphene acts as a trapping site for electrons which promote efficient separation among photo-carriers. Hence, the low recombination rate provides a greater dye degradation efficiency of the photocatalyst which is consistent with the photocatalytic results.3.5 X-ray photoelectron spectra of the C-series nanohybrids
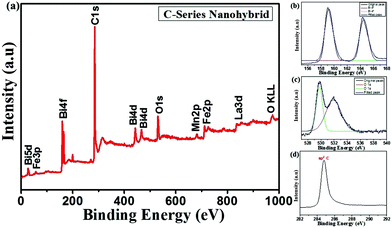
The XPS spectrum of the C-series nanohybrids is shown in Fig. 10a. The XPS spectrum shows the detailed elemental composition of the BLFMO/GNP hybrid structure in which all the chemical bonds corresponding to Bi, La, Fe, Mn, C and O give prominent peaks at their binding energies of 159 eV, 840 eV, 710 eV, 683 eV, 285 eV and 530 eV, respectively.68–70 The main peaks corresponding to bismuth, carbon and oxygen are also shown separately in Fig. 10b–d. The oxygen peak for the GNPs is usually of low intensity (it almost vanished due to graphene reduction71) but due to introduction of bismuth ferrite in the hybrid structure, two oxygen peaks exist (shown in Fig. 10c) and the intensity is also high compared to that of pristine GNP. The intense carbon peak (shown in Fig. 10d) represents the sp2 hybridized carbon network of graphene70 present in the pristine GNPs. There is no other peak related to C 1s due to the removal of all other additional functional groups (C–O, C–H and COOR) from the GNPs during the reduction process. A peak for OKLL appeared at around 970 eV which represents the oxygen vacancies created during charge compensation during BFO and graphene reduction.3.6 Brunauer–Emmett–Teller (BET) measurement of a C-series nanohybrid
The BET measurement is also performed to check the surface area of the C-series BLFO/GNP nanohybrid. The nitrogen adsorption–desorption curve for surface area measurement is shown in Fig. 11. The specific surface area of BLFO/GNP is 55 m2 g−1. The higher surface area is due to GNP loading inside the BLFO nanoparticles which enables it to enhance dye adsorption over the material surface. The adsorption curve is a type IV curve showing the existence of mesopores and type H3 hysteresis.72 The calculated pore volume and the average pore diameter are 0.184 cm3 g−1 and 13.32 nm, respectively. The enhanced surface area shows the existence of a multichannel structure inside the nanohybrid which enables fast mass transportation and more light harvesting due to increased absorption, scattering, multiple light reflections and gas diffusion inside the material’s pores.73,74 The presence of mesopores and macro-channels also helps to trap more dye molecules over the hybrid surface. Hence the effect of multiple light reflections and adsorption over the surface together enhance the photocatalytic activity of the nanohybrid which results in fast dye degradation.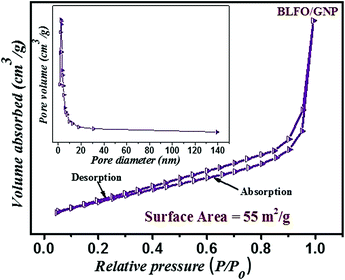 | ||
| Fig. 11 Nitrogen adsorption–desorption curve for surface area measurement of the C-series (BLFO/GNP) nanohybrid. | ||
3.7 Proposed mechanism
Based on the above discussion, a schematic illustration of the photodegradation phenomenon is depicted in Fig. 12. The electron and hole generation in the conduction band (CB) and valence band (VB) is shown to be strongly related to the positions of the CB and VB. Mulliken electronegativity theory is used to calculate the CB and VB potentials.75,76 The following expressions are used for the calculations of the respective potentials:| EVB = X − Ee + 0.5Eg | (1) |
| ECB = EVB − Eg | (2) |
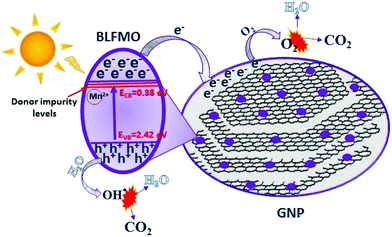 | ||
| Fig. 12 Schematic of the general mechanism involved in the photocatalytic activity of the BLFMO/GNP nanohybrids. | ||
The electron–hole pair generation under visible light irradiation inside the CB and VB helps in the breakdown of organic molecules with the generation of water molecules (H2O) and carbon dioxide (CO2) as by-products. The degradation mechanism can be divided into three main steps: (1) high energy photon absorption over the surface of the photocatalyst; (2) the generation of photo-generated charge carriers, their separation and transfer or recombination; and (3) the photochemical reactions over the surface of the photocatalyst.33 The higher photocatalytic activity of BLFMO-20/GNP might be due to the wider absorption of photons, low rate of electron–hole recombination and enhanced redox reactions over the surface. The photo-excited BLFMO/GNP nanohybrid helps in the generation of electron–hole pair charge carriers (eqn (3)). Graphene sheets (being strong e− acceptors42) inside the GNPs act as trapping sites for electrons and produce a sufficient separation78 between charge carriers and their efficient surface transfer (eqn (4)). These electrons convert oxygen (O2) into peroxide (O2−) radicals (eqn (5)). Water molecules in the aqueous solution are converted into OH˙ by the promotion of electrons in the catalyst (eqn (6)). Both the O2 and OH˙ species play an active role in degrading the CR into CO2 and H2O (eqn (7) and (8)). This whole phenomenon is expressed by the following equations:
| BLFMO/GNP + hν → e− + h+ | (3) |
| e− + GNP → e− (GNP trapping sites) | (4) |
| e− (GNP trapping sites) + O2 → O2− | (5) |
| h+ + H2O → OH˙ | (6) |
| OH˙ + CR → CO2 + H2O (degradation by-products) | (7) |
| O2− + CR → CO2 + H2O (degradation by-products) | (8) |
4 Conclusion
The BLFO and BLFMO nanoparticles were successfully synthesized via a modified sol–gel method. The BLFO/GNP and BLFMO/GNP nanohybrids were fabricated via co-precipitation and hydrothermal methods (namely the C and H-series, respectively). The XRD patterns and SEM images show that the H-series nanohybrids are more crystalline and ordered compared to the C-series nanohybrids. The Mn loading in the BFO nanoparticles reduces the band gap of the nanohybrids due to the introduction of impurity energy levels. XPS verified the elemental composition of the nanohybrids. The overall dye removal (surface adsorption + photo-degradation) is higher for the C-series nanohybrids (92%) compared to that for the H-series nanohybrids (76%), which is attributed to the higher surface area (55 m2 g−1) of the C-series nanohybrids. The total catalytic activity depends upon the surface adsorption of the dye over the catalyst surface in the dark. The enhanced dye removal of the as-prepared porous structure with a low cost and easy synthesis route makes the BLFMO/GNP nanohybrids more suitable for future industrial applications.Acknowledgements
The authors are thankful to the Higher Education Commission (HEC) of Pakistan for financing the project under the Project No. 6040/Federal/NRPU/R&D/HEC/2016, and the School of Natural Sciences (SNS), NUST. The authors also thank the School of Chemical & Mechanical Engineering (SCME), NUST for the technical support.References
- P. L. L. de Alba, L. Lopez-Martnez and L. M. De-Leon-Rodrguezr, Electroanalysis, 2002, 14, 197–205 CrossRef.
- R. R. Ramsay, C. Dunford and P. K. Gillman, Br. J. Pharmacol., 2007, 152, 946–951 CrossRef CAS PubMed.
- A. Afkhami and R. Moosavi, J. Hazard. Mater., 2010, 174, 398–403 CrossRef CAS PubMed.
- S. Kobylewski and M. F. Jacobson, Advance in Electronic and Electric Engineering, 2012, vol. 18, pp. 220–246 Search PubMed.
- E. M. Saggioro, A. S. Oliveira, T. Pavesi, C. G. Maia, L. F. V. Ferreira and J. C. Moreira, Molecules, 2011, 16, 10370–10386 CrossRef CAS PubMed.
- M. T. Amin, A. A. Alazba and U. Manzoor, Chem. Soc. Rev., 2014, 2014, 1–24 Search PubMed.
- R. V. Prihod’ko and N. M. Soboleva, J. Chem., 2013, 2013, 1–8 CrossRef.
- S. Chaturvedi, R. Das, P. Poddar and S. Kulkarni, RSC Adv., 2015, 5, 23563–23568 RSC.
- I. Papadas, J. A. Christodoulides, G. Kioseoglou and G. S. Armatas, J. Mater. Chem. A, 2015, 3, 1587–1593 CAS.
- M. R. Hoffmann, S. T. Martin, W. Choi and D. W. Bahnemann, Chem. Rev., 1995, 95, 69–96 CrossRef CAS.
- H. Liu, H. T. Ma, X. Z. Li, W. Z. Li, M. Wu and X. H. Bao, Chemosphere, 2003, 50, 39–46 CrossRef CAS PubMed.
- Y. Han, H. S. Kim and H. Kim, J. Nanomater., 2012, 2012, 1–10 CrossRef.
- S. Thirumalairajan, K. Girija, N. Y. Hebalkar, D. Mangalaraj, C. Viswanathan and N. Ponpandian, Adv. Mater., 2013, 3, 7549–7561 CAS.
- Y. Zhang, J. Yang, J. Xu, Q. Gao and Z. Hong, Adv. Mater., 2012, 81, 1–4 CAS.
- L. Li and X. Wang, J. Sol-Gel Sci. Technol., 2016, 79, 1–7 CrossRef.
- M. Zhou, H. Yang, T. Xian, R. S. Li, H. M. Zhang and X. X. Wang, J. Hazard. Mater., 2015, 289, 149–157 CrossRef CAS PubMed.
- S. N. Tijare, S. Bakardjieva, J. Subrt, M. V. Joshi, S. S. Rayalu, S. Hishita and N. Labhsetwar, J. Chem. Sci., 2014, 126, 517–525 CrossRef CAS.
- G. Catalan and J. F.Scott, Adv. Mater., 2009, 21, 2463–2485 CrossRef CAS.
- T. Soltani and M. H. Entezari, J. Chem. Eng., 2013, 223, 145–154 CrossRef CAS.
- S. Li, Y. H. Lin, B. P. Zhang, Y. Wang and C. W. Nan, J. Phys. Chem. C, 2010, 114, 2903–2908 CAS.
- F. Gao, X. Chen, K. Yin, S. Dong, Z. Ren, F. Yuan, T. Yu, Z. Zou and J. M. Liu, Adv. Mater., 2007, 19, 2889–2892 CrossRef CAS.
- U. A. Joshi, J. S. Jang, P. H. Borse and J. S. Lee, Appl. Phys. Lett., 2008, 92, 3 CrossRef.
- Q. J. Ruan and W. D. Zhang, J. Phys. Chem. C, 2009, 113, 4168–4173 CAS.
- Y. Huo, Y. Jin and Y. Zhang, J. Mol. Catal. A: Chem., 2010, 331, 15–20 CrossRef CAS.
- Q. Zhang, W. Gong, J. Wang, X. Ning, Z. Wang, X. Zhao, W. Ren and Z. Zhang, J. Phys. Chem. C, 2011, 115, 25241–25246 CAS.
- J. Wei, C. Zhang and Z. Xu, Mater. Res. Bull., 2012, 47, 3513–3517 CrossRef CAS.
- T. Soltani and M. H. Entezari, J. Mol. Catal. A: Chem., 2013, 337, 197–203 CrossRef.
- J. Z. H. Wu, L. Liang, L. Li and X. Zhu, J. Nanomater., 2014, 2014, 1–14 Search PubMed.
- X. Xu, Y. H. Lin, P. Li, L. Shu and C. W. Nan, J. Am. Ceram. Soc., 2011, 94, 2296–2299 CrossRef CAS.
- R. Guo, L. Fang, W. Dong, F. Zheng and M. Shen, J. Mater. Chem. C, 2010, 114, 21390–21396 CAS.
- S. Irfan, S. Rizwan, Y. Shen, R. Tomovska, S. Zulfiqar, M. I. Sarwar and C. W. Nana, RSC Adv., 2016, 6, 114183–114189 RSC.
- S. Wang, D. Chen, F. Niu, N. Zhang, L. Qin and Y. Huang, RSC Adv., 2016, 6, 34574–34587 RSC.
- S. Irfan, S. Rizwan, Y. Shen, L. Li, A. Yar, S. Butt and C. W. Nan, Sci. Rep., 2017, 7, 1–12 CrossRef PubMed.
- S. Li, J. Zhang, M. G. Kibria, Z. Mi, M. Chaker, D. Ma, R. Nechache and F. Rosei, Chem. Commun., 2013, 49, 5856–5858 RSC.
- T. Fan, C. Chen and Z. Tang, RSC Adv., 2016, 6, 9994–10000 RSC.
- K. I. Bolotin, K. J. Sikes, Z. Jiang, M. Klima, G. Fudenberg, J. Hone, P. Kim and H. L. Stormer, Solid State Commun., 2008, 146, 351–355 CrossRef CAS.
- A. Peigney, C. Laurent, E. Flahaut, R. R. Bacsa and A. Rousset, Carbon, 2001, 39, 507–514 CrossRef CAS.
- A. A. Balandin, S. Ghosh, W. Bao, I. Calizo, D. Teweldebrhan, F. Miao and C. Lau, Nano Lett., 2008, 8, 902–907 CrossRef CAS PubMed.
- I. W. Frank, D. M. Tanenbaum, A. M. V. D. Zande and P. L. McEuen, J. Vac. Sci. Technol., B: Microelectron. Nanometer Struct.--Process., Meas., Phenom., 2007, 25, 2558–2561 CrossRef CAS.
- A. Sun, H. Chen, C. Song, F. Jiang, X. Wang and Y. Fub, RSC Adv., 2013, 3, 4332–4340 RSC.
- Z. Li, Y. Shen, C. Yang, Y. Lei, Y. Guan, Y. Lin, D. Liu and C. W. Nan, J. Mater. Chem. A, 2013, 1, 823–829 CAS.
- J. F. Dai, T. Xian, L. J. Di and H. Yang, J. Nanomater., 2013, 2013, 1–5 Search PubMed.
- Q. Xiang, J. Yu and M. Jaroniec, Chem. Soc. Rev., 2012, 41, 782–796 RSC.
- A. V. Melezhyk and A. G. Tkachev, Nanosyst.: Phys., Chem., Math., 2012, 5, 294–306 Search PubMed.
- A. Nieto, D. Lahiri and A. Agarwal, Carbon, 2012, 50, 4068–4077 CrossRef CAS.
- M. Y. Shen, T. Y. Chang, T. H. Hsieh, Y. L. Li, C. L. Chiang, H. Yang and M. C. Yip, Nanomaterials, 2013, 2013, 1–9 Search PubMed.
- A. Arshad, J. Iqbal, M. Siddiq, Q. Mansoor, M. Ismail, F. Mehmood, M. Ajmal and Z. Abid, J. Appl. Phys., 2017, 121, 1–10 Search PubMed.
- P. Worajittiphon, K. Pingmunag, B. Inceesungvorn and S. Phanichphant, Ceram. Int., 2015, 41, 1885–1889 CrossRef CAS.
- Q. Zhang, N. Bao, X. Wang, X. Hu, X. Miao, M. Chaker and D. Ma, Sci. Rep., 2016, 6, 1–15 CrossRef PubMed.
- Z. Ren, E. Kim, S. W. Pattinson, K. S. Subrahmanyam, C. N. R. Rao, A. K. Cheetham and D. Eder, Chem. Sci., 2011, 3, 209–216 RSC.
- W. Meng, R. Hu, J. Yang, Y. Du, J. Li and H. Wang, Chin. J. Catal., 2016, 37, 1283–1292 CrossRef CAS.
- H. C. Wang, Y. H. Lin, Y. Feng and Y. Shen, J. Electroceram., 2013, 31, 1–4 CrossRef.
- A. W. Aziz and N. H. M. Kaus, 2015, 1–6.
- Y. Cong, J. Zhang, F. Chen and M. J. Anpo, J. Phys. Chem. C, 2007, III, 6976–6982 Search PubMed.
- P. Kubelka and F. Munk, Tech. Phys., 1931, 12, 593–601 Search PubMed.
- E. F. Kaelble, Handbook of X-rays, McGraw-Hill Education, U.S.A., 2nd edn, 1967 Search PubMed.
- D. W. Johnson, B. P. Dobson and K. S. Coleman, Curr. Opin. Colloid Interface Sci., 2015, 20, 367–382 CrossRef CAS.
- M. Z. Iqbal, A. A. Abdala, V. Mittal, S. Seifert, A. M. Herring and M. W. Liberatore, Polymer, 2016, 98, 143–155 CrossRef CAS.
- M. Z. Iqbal and A. A. Abdala, RSC Adv., 2013, 3, 24455–24464 RSC.
- M. Z. Iqbal and A. A. Abdala, Environ. Sci. Pollut. Res., 2013, 20, 3271–3279 CrossRef CAS PubMed.
- F. G. Garciaa, C. Riccardi and A. Simes, J. Alloys Compd., 2010, 501, 25–29 CrossRef.
- S. Gupta, A. Sharma, M. Tomar, V. Gupta, M. Pal, R. Guo and A. Bhalla, J. Appl. Phys., 2012, 111, 064110–064116 CrossRef.
- G. S. Arya and N. S. Negi, J. Phys. D: Appl. Phys., 2013, 46, 1–8 CrossRef.
- T. S. Sahu and S. Mitra, Sci. Rep., 2015, 5, 1–13 Search PubMed.
- A. Trapalis, N. Todorova, T. Giannakopoulou, N. Boukos, T. Speliotis, D. Dimotikali and J. Yu, Appl. Catal., B, 2016, 180, 637–647 CrossRef CAS.
- B. Qiu, Y. Zhou, Y. Ma, X. Yang, W. Sheng, M. Xing and J. Zhang, Sci. Rep., 2015, 5, 1–6 Search PubMed.
- N. S. A. Satar, A. W. Aziz, M. K. Yaakob, M. Z. A. Yahya, O. H. Hassan, T. I. T. Kudin and N. H. M. Kaus, J. Phys. Chem. C, 2016, 120, 26012–26020 CAS.
- Y. Li, M. Sheng Cao, D. Wei Wang and J. Yuan, RSC Adv., 2015, 5, 77184–77191 RSC.
- Q. Xu, Y. Sheng, M. Khalid, Y. Cao, Y. Wang, X. Qiu, W. Zhang, M. He, S. Wang, S. Zhou, Q. Li, D. Wu, Y. Zhai, W. Liu, P. Wang, Y. B. Xu and J. Du, Sci. Rep., 2015, 5, 1–8 Search PubMed.
- F. Wang, L. T. Drzal, Y. Qin and Z. Huang, High Perform. Polym., 2015, 28, 1–11 Search PubMed.
- R. Sun, H. Yao, H. B. Zhang, Y. W. M. Y. Li and Z. Z. Yu, Compos. Sci. Technol., 2016, 137, 1–9 CrossRef.
- B. W. Chieng, N. A. Ibrahim, W. M. Z. W. Yunus, M. Z. Hussein and V. S. G. Silverajah, Int. J. Mol. Sci., 2012, 13, 10920–10934 CrossRef CAS PubMed.
- T. Zhao, Z. Liu, K. Nakata, S. Nishimoto, T. Murakami, Y. Zhao, L. Jiang and A. Fujishima, J. Mater. Chem., 2010, 20, 5095–5099 RSC.
- B. Fang, A. Bonakdarpour, K. Reilly, Y. Xing, F. Taghipour and D. P. Wilkinson, ACS Appl. Mater. Interfaces, 2014, 6, 15488–15498 CAS.
- W. Meng, R. Hu, J. Yang, Y. Du, J. Li and H. Wang, Chin. J. Catal., 2016, 37, 1283–1292 CrossRef CAS.
- S. Han, J. Li, K. Yang and J. Lin, Compos. Sci. Technol., 2015, 36, 2119–2126 CAS.
- H. Hotop and W. C. Lineberger, J. Phys. Chem. Ref. Data, 1975, 4, 539–576 CrossRef CAS.
- Z. T. Hua, J. Liub, X. Yana, W. D. Oha and T. T. Lim, Chem. Eng. J., 2015, 262, 1022–1032 CrossRef.
| This journal is © The Royal Society of Chemistry 2017 |


