 Open Access Article
In situ synthesis of hierarchical structured cotton fibers/MnO2 composites: a versatile and recyclable device for wastewater treatment†
Chenlu Jiaoa,
Jin Taoa,
Sijun Xub,
Desuo Zhanga,
Yuyue Chen a and
Hong Lin
 *a
*a
aNational Engineering Laboratory for Modern Silk, College of Textile and Clothing Engineering, Soochow University, Suzhou 215123, P. R. China. E-mail: linhong523@suda.edu.cn
bSchool of Textile and Clothing, Nantong University, Jiangsu 226019, P. R. China
First published on 19th June 2017
Abstract
To improve the feasibility of MnO2 nanoparticles for applications in wastewater treatment, cotton fibers–MnO2 hierarchical composites (C-MHCs) were fabricated via a new and efficient two-step strategy. The as-prepared C-MHCs were characterized by FTIR, XPS, XRD, SEM and TEM analyses, and the results show that the C-MHCs possess hierarchical structure with a monolayer coverage of MnO2 nanoparticles on the cotton fiber surfaces. The batch adsorption experiments were executed as a function of pH value, contact time and initial concentration. Adsorption behavior followed the pseudo-second-order model (R2 > 0.99) and Langmuir isotherm, with Langmuir maximum adsorption capacity of 68.3, 174.2, 109.4 and 247.0 mg g−1 for Cu2+, Pb2+, CR and MB, respectively. The regeneration experiments show that more than 85% of the initial adsorption amount was retained at the 5th sequential adsorption–desorption cycle. Considering the simple and facile fabrication process, all-round adsorption feasibility and high-efficiency regeneration performance, the C-MHCs are believed to be a versatile and renewable candidate for wastewater treatment.
Introduction
Water pollution, a major challenge encountering the global society today, is due to the discharge of effluents from textile dye, paint, paper, mining and electroplating industries containing harmful chemicals such as dyes and heavy metal ions.1–3 These effluents are toxic and non-biodegradable to fauna and flora, and some of them are mutagenic and carcinogenic to organisms.4,5 Manganese dioxide (MnO2) nanoparticles, as a typical type of transition-metal oxide, have been a subject of intense interest in various fields, including ion and molecular sieves, redox catalysts, wastewater treatment, biosensors and electrode materials due to their prominent structural multiformity as well as novel physical and chemical performances.6,7 In terms of high capacity and selectivity, MnO2 nanoparticles exhibit excellent adsorption performance, which can contribute to deep removal of pollutants from aquatic systems to meet increasingly strict standards.8–10 However, the high surface energy of nanosized MnO2 granules inevitably leads to poor stability. As a result, granules tend to agglomerate because of van der Waals forces and other interactions, resulting in the reduction of reactivity.11 Moreover, it is difficult to separate the nanoparticles from aqueous systems, which leads to the leaching of nanoparticles along with the treated effluents.Recently, nano-biocomposites with enhanced properties have been deemed to be a promising alternative for industrial applications due to the integrated features of biopolymer matrices and nanomaterials. Moreover, the addition of bio-supports can avoid the agglomeration of nanomaterials. The commonly used templates for nano-biocomposite preparation are biodegradable polymers such as starch, cellulose, pectin, poly(lactic acid), and chitosan.12
As an abundantly available, economical, renewable, and environment friendly material, natural cotton fiber is gaining interest as a support because of its nanoporous surface feature.13,14 Cotton fiber is composed of a large number of β-(1 → 4)-glycosidic bonds of D-glucose,15,16 and abundant hydroxyl groups facilitate the cross-linked cotton fibers to construct a flexible 3D netlike matrix with strong hydrophilic surfaces, which is suggested to be a suitable nanoreactor for the growth of MnO2 nanoparticles. In addition, hierarchical nanostructured metal oxide has been widely used in gas sensors, water treatment, energy storage, etc.20–23 Although previous studies have reported manganese oxide (MnOx) hybrids based on matrix materials,17–19 those reports were generally about MnOx nanosheets with limited adsorption capacities, and some MnOx were anchored onto nanosized supports and the loading content could not be tuned, leading to a poor separation performance and unclear analysis about adsorption efficiency. Hence, the hierarchical structured cotton fibers–MnO2 nano-biocomposites with uniform coverage of MnO2 nanospheres are valuable to be developed.
In this study, a new two-step strategy “ion exchange–redox reaction” was proposed to prepare cotton fibers–MnO2 hierarchical composites (C-MHCs). The resultant C-MHCs exhibit inherent merits of cotton fibers such as macroscale, flexibility and high surface area for loading MnO2 nanoparticles. The chemical composition, crystal performance and microstructure of C-MHCs were characterized by FTIR, XPS, XRD, SEM and TEM analyses, respectively. Various adsorption parameters such as pH value, initial concentration, contact time, kinetic models and adsorption isotherms were studied.
Experimental
Materials
The cotton fibers were obtained from Yintong Cotton Co., Ltd, (Suzhou, China). Manganese(II) sulfate monohydrate (MnSO4·H2O), potassium permanganate (KMnO4), copper(II) nitrate hydrate [Cu(NO3)2·3H2O], lead nitrate [Pb(NO3)2], sodium hydroxide (NaOH), hydrochloric acid (HCl), and two typical dyes including cationic methylene blue (MB) and anionic Congo red (CR) were obtained from Sinopharm Chemical Reagent Co., Ltd. (Shanghai, China). All reagents were used without any treatment.Activation of cotton fibers
First, the cotton fibers were pretreated by NaOH aqueous solution. In detail, 5 g cotton fibers were boiled in 250 mL NaOH aqueous solution (2 wt%) for 90 min, followed by filtering and transferring into 150 mL NaOH aqueous solution (18 wt%) and kept stirring for 2 h. Then, the resultant was filtered again and washed several times with abundant deionized water; alkali-activated cotton fibers were acquired after drying at 50 °C for 3 h.Preparation of C-MHCs
In a typical synthesis, alkali-activated cotton fibers were added into a three-necked flask containing 45 mL 0.020 mol L−1 MnSO4 aqueous solution and kept stirring for 15 min. Then, the infiltrated cotton fibers were filtered and dropped into deionized water. Subsequently, 30 mL 0.020 mol L−1 KMnO4 solution was added dropwise into the reaction system under continuous stirring for 6 h at room temperature. The resultant was washed several times with deionized water to remove residual reactants and dried at 50 °C for 4 h to obtain the product C-MHCs.Characterization of C-MHCs
Fourier transform infrared spectroscopy (FTIR, Nicolet 5700, Thermo Nicolet, USA) was recorded to test the chemical characteristics. The valence of manganese was confirmed on an X-ray photoelectron spectroscopy system (XPS, Axis Ultra HAS, Shimadzu, Japan). X-ray diffraction (XRD) studies were performed on an X-ray diffractometer (Bruker AXS, D8 Advance, Germany). The microstructures of C-MHCs were studied by field emission scanning electron microscopy (FE-SEM, S-4800, Hitachi, Japan). An energy-dispersive spectrometer (EDS, TM3030, Hitachi, Japan) was used to measure the element content and distribution. The morphology of C-MHCs was observed by field emission transmission electron microscopy (TEM, G2 F20 S-Twin, USA). Thermal analyzer (TG, DIAMOND 5700, PerkinElmer, USA) was used to survey the MnO2 content in C-MHCs from ambient condition to 800 °C with a heating rate of 10 °C min−1 in flowing N2. Zeta potential was measured using a zetasizer (ZEN 3600, Malvern, UK).Adsorption and desorption studies
Herein, 0.1 g C-MHCs was soaked into 100 mL wastewater containing metal ions or dyes. The initial pH values of the solutions were calibrated by dilute HCl or NaOH solutions. All the adsorption experiments were executed at 30 °C with stirring. The equalized adsorption capacity Qe (mg g−1) was calculated according to the following equation:
 | (1) |
The concentrations of metal ions were measured via inductively coupled plasma atomic emission spectroscopy (ICP-AES, iCAP 6000 DUO, Thermo Scientific, USA). The concentrations of CR and MB were calculated by UV-visible spectroscopy (UV-vis, TU-1810, Purkinje General, China) at 497 and 664 nm, respectively.
For regeneration, the C-MHCs after adsorption were filtered out and soaked into different eluents with agitation at 30 °C for 4 h. Specifically, for C-MHCs loaded Cu2+, Pb2+ and MB, the eluent was 0.05 mol L−1 HCl. Moreover, 0.05 mol L−1 NaOH was used for CR-loaded C-MHCs. After the elution course, the C-MHCs were washed and dried to obtain the regenerated C-MHCs. In order to investigate the reusability of C-MHCs, 5 cycles of sequential adsorption–desorption were tested.
Results and discussion
Principle and strategy for the preparation of C-MHCs
Alkali treatment of cellulose has been an important pretreatment step in the production of various cellulose derivatives since it was activated by the alkali solution for the main reactions.24 As shown in Scheme 1, the alkali pretreatment of cotton fibers with NaOH solution results in the transformation of non-active cotton cellulose to alkali-activated cotton cellulose. Then, with the addition of Mn2+, the sodium salt of Cell·O−Na+ was exchanged with the manganese salt of (Cell·O−)2Mn2+ due to higher electronegativity of manganese (1.55) than sodium (0.93).25 Thereafter, redox reaction occurred as shown in eqn (2) when MnO4− was added, achieving the in situ formation of MnO2 nanoparticles on the cotton fiber surface.| 3Mn2+ + 2MnO4− + 2H2O → 5MnO2 + 4H+ | (2) |
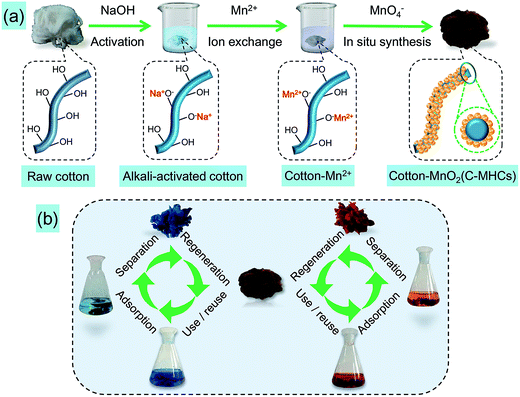 | ||
| Scheme 1 (a) Schematic for the fabrication process of C-MHCs, and (b) cyclic adsorption diagram for pollutants by as-prepared C-MHCs. | ||
Chemical analyses of C-MHCs
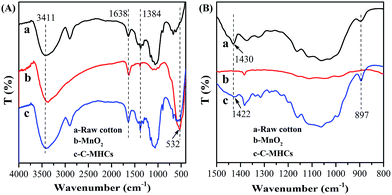
FTIR spectroscopy of C-MHCs was performed to characterize the chemical and crystal change of cotton fibers before and after loading MnO2. As shown in Fig. 1, a new peak at 532 cm−1 appeared in C-MHCs, indicating the successful loading of the manganese compound on the cotton matrix.26 Furthermore, the region of 1500–800 cm−1 has been used to characterize the polymorphs of cellulose. The adsorption band at 1430 cm−1 shifted to 1422 cm−1, demonstrating the crystalline change of cotton fibers from cellulose I to cellulose II.27,28In order to investigate the valence of manganese, the cotton fibers and C-MHCs were subjected to XPS analysis, and the result is shown in Fig. 2. The Mn 2p peak can be clearly seen in C-MHCs spectrum (Fig. 2a), confirming the deposition of manganese compound on cotton fibers. Fig. 2b shows the Mn 2p3/2 feature at 642.1 eV with a separation of 11.9 eV from Mn 2p1/2, which indicates that Mn is present in its IV state.29 This result demonstrates that the resultant manganese compound is MnO2.
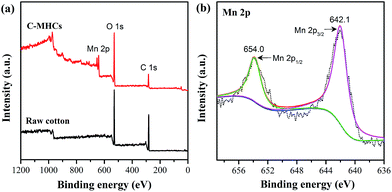 | ||
| Fig. 2 (a) XPS survey spectra of raw cotton and C-MHCs. (b) XPS high-resolution spectrum of the Mn 2p region in C-MHCs. | ||
Crystal structure of C-MHCs
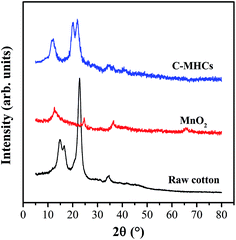
To further analyze the crystalline properties, the XRD patterns of C-MHCs and related components are shown in Fig. 3. There is a strong peak at 2θ of 22.76° in natural cotton fibers, which can be attributed to 002 lattice plane. The other three peaks at 2θ of 14.80°, 16.64° and 34.4° originate from 101, 101 and 040 lattice planes and are characteristic of cellulose I crystal structure.30 As for MnO2 nanoparticles, the intense diffraction peaks at 2θ of 12.20°, 24.65°, 36.33° and 65.74° can be assigned to the characteristic peaks of birnessite MnO2, demonstrating the poorly crystalline MnO2 nanoparticles composed of layered structures containing K+ and H2O in the interlayer space.31 However, no significant diffraction peaks related to MnO2 were observed in C-MHCs, which may be due to the strong diffraction peaks of cotton fibers and the weak diffraction peaks of MnO2. In addition, the crystal texture of cotton changes into cellulose II type as displayed in C-MHCs spectrum, which is consistent with the FTIR result and can be attributed to the alkali-activation pretreatment of cotton fibers.32Microstructure of C-MHCs
The effect of precursor concentration on the MnO2 loading was studied by SEM. As shown in Fig. 4, native cotton fibers act as the control group to indicate surface changes, and they show the typical natural twists and netting lines on the fiber surface. The C-MHCs exhibit an increasing load of MnO2 nanoparticles along the fiber direction with increasing precursor concentration. With low concentration of 0.005 mol L−1, nearly no MnO2 nanoparticles are generated on the fiber surface. On increasing the concentration to 0.010 mol L−1, a number of MnO2 granules are deposited on the fiber surface, which are not enough to cover the entire fiber. Moreover, it is clear that these resultant MnO2 unit cells assemble along the grooves formed by adjacent netting lines of cotton, which provide abundant directional anchor points for the deposition of MnO2 nanoparticles and facilitate the formation of C-MHCs with uniform coverage of MnO2 nanoparticles.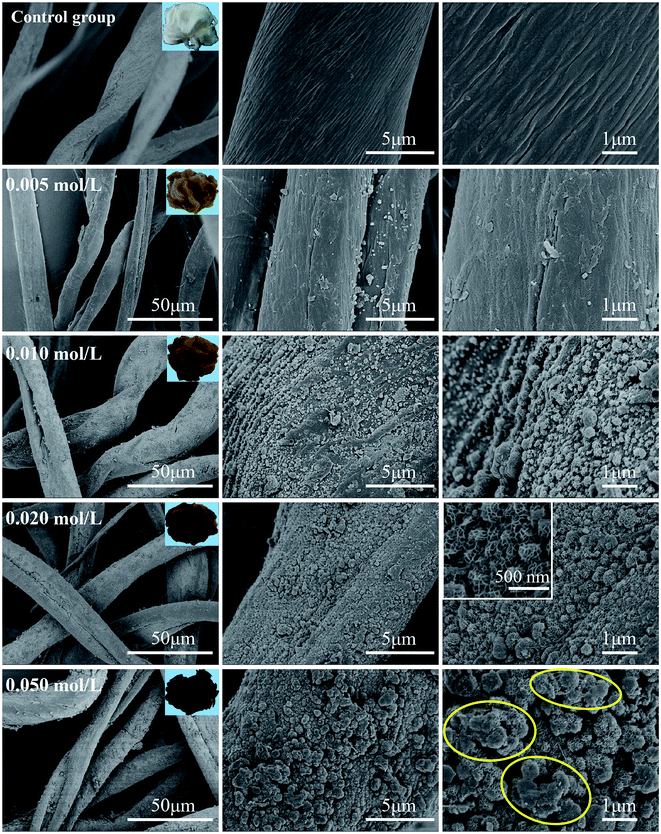 | ||
| Fig. 4 SEM and digital images of C-MHCs prepared with different concentrations of precursors such as 0, 0.005, 0.010, 0.020 and 0.050 mol L−1. | ||
When the precursor concentration is increased to 0.020 mol L−1, these MnO2 granules dispersing homogenously on fiber surface can be clearly observed, and magnified SEM image display the lamella-stacked plicated-typed nanospheres with a size of 200–350 nm. As shown in Fig. S1 and Table S1 (ESI†), the growth of MnO2 nanoparticles onto cotton fibers increases the number of active sites and specific surface area (5.77 m2 g−1 for raw cotton and 21.72 m2 g−1 for C-MHCs prepared by 0.020 mol L−1 precursor), which play an important role in the adsorption process. However, as the precursor concentration is further increased to 0.050 mol L−1, considerable amount of MnO2 aggregation appears with multilayer coverage as shown in the yellow circles, leading to an unfavorable adsorption. Moreover, the photograph colors change from white to dark brown, and their loading amounts calculated from the TG curves (Fig. S2†) are 0 wt%, 2.74 wt%, 5.64 wt%, 8.78 wt% and 14.25 wt%, indicating that the MnO2 load can be tuned by varying the precursor concentration. This result is highly in line with the SEM result.
Furthermore, as shown in Fig. 5, the EDS mapping analyses also confirm the uniform dispersion of MnO2 nanoparticles. In terms of the structure of C-MHCs, TEM image shown in Fig. 5f demonstrates the hierarchical structured C-MHCs with monolayer coverage of MnO2 nanoparticles. In addition, TEM further confirms that MnO2 exhibits a structure with lots of small wormhole-like pores composed of lamella-stacked spherical granules, which enhances the adsorption of pollutants owing to their large surface area and substantial active sites.
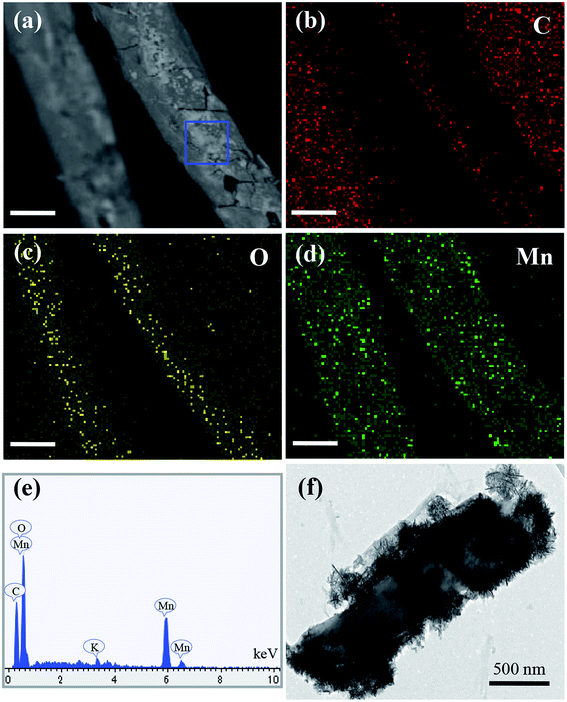 | ||
| Fig. 5 (a)–(d) EDS mapping results of C-MHCs prepared by 0.020 mol L−1 precursor, the scale bar is 10 μm. (e) EDS spectrum of C-MHCs in selected area of (a). (f) Typical TEM image of C-MHCs. | ||
Adsorption studies
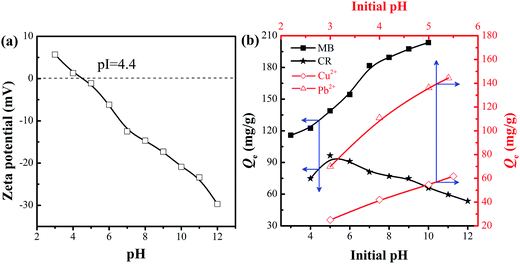 | ||
| Fig. 6 (a) Zeta potential of C-MHCs, and (b) effect of pH values on the adsorption capacity of C-MHCs for Cu2+, Pb2+, CR and MB (adsorption condition: 500 mg L−1, 4 h). | ||
The CR adsorption capacity increased as the pH value increased from 4.0 to 5.0, and then decreased gradually with a further increase in the pH value to 12.0. This can be attributed to the protonation and deprotonation of functional groups of the adsorbent and adsorbate.34 CR has a pKa value of 4.5–5.5; it would be positively charged because the nitrogen atoms and sulfonate groups of the CR molecules become protonated when the pH < 5.0.35 Herein, the isoelectric point (pI) of C-MHCs is 4.4, as displayed in Fig. 6a. It follows that the removal is expected to increase at pH range of 4.4–5.0 and reached a maximum capacity (96.6 mg g−1) at about pH = 5.0, for the C-MHCs was negatively charged and CR was either neutral or positively charged. When pH > 5.0, the surface charges of CR and C-MHCs become negative, and the adsorption is impeded, leading to a gradual decrease in the adsorption capacity.
The adsorption capacity for MB displays an “S-shape” increasing trend under the pH range of 3.0–10.0. In consideration of the pI of C-MHCs, the C-MHCs are positively charged in the pH range of 3.0–4.4 and are not conducive to adsorbing cationic MB due to electrostatic repulsion, generating a slow increase for adsorption capacity. When pH > 4.4, the adsorption rose rapidly owing to the electrostatic attraction between cationic MB molecules and negatively charged adsorbent. For metal ions, the effect of pH on the solubility and speciation of metal ions should be considered, and hence the corresponding initial pH value-3.0 was set. The adsorption capacity trends for Cu2+ and Pb2+ are close to that of MB because of the similar mechanism. The above results indicate that the adsorption ability of C-MHCs depends largely on the pH environment, and it possesses all-round adsorption feasibility for anionic and cationic pollutants.
Pseudo-first-order model
ln(Q1e − Qt) = ln![[thin space (1/6-em)]](https://www.rsc.org/images/entities/char_2009.gif) Q1e − k1t Q1e − k1t
| (3) |
Pseudo-second-order model
 | (4) |
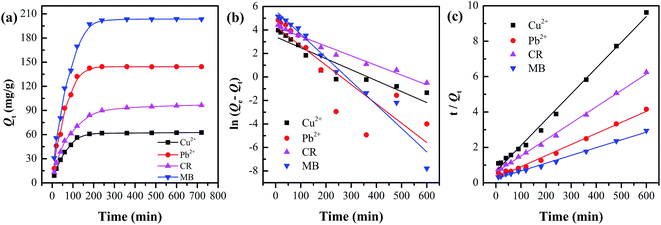
All kinetics parameters, correlation coefficients, and experimental adsorption capacities are listed in Table 1. It can be clearly seen that the result presented an ideal fit to the pseudo-second-order model with an extremely high R2 (0.9905–0.9978). Moreover, a good agreement can be supported by the consistency of the calculated value Q2e and experimental value Qexp, indicating that pseudo-second-order kinetics can reasonably describe the adsorption process.
| Adsorbates | Qexp (mg g−1) | Pseudo-first-order model | Pseudo-second-order model | ||||
|---|---|---|---|---|---|---|---|
| Q1e,cal (mg g−1) | k1 (min−1) | R2 | Q2e,cal (mg g−1) | k2 × 104 (g (mg min)−1) | R2 | ||
| Cu2+ | 62.6 | 30.6 | 0.0093 | 0.8500 | 68.0 | 3.2252 | 0.9940 |
| Pb2+ | 144.4 | 73.3 | 0.0165 | 0.7495 | 161.3 | 1.3315 | 0.9905 |
| CR | 96.6 | 72.1 | 0.0082 | 0.9801 | 108.7 | 1.4302 | 0.9978 |
| MB | 203.5 | 283 | 0.0200 | 0.9616 | 232.6 | 0.7922 | 0.9934 |
Adsorption isotherm models are commonly used to describe adsorption process and investigate its mechanism. In this study, two important isotherm equations, namely Langmuir and Freundlich isotherms, were employed to investigate the adsorption process. The Langmuir isotherm (Fig. 8b) assumes that the adsorption occurs at specific homogenous sites of the adsorbent,37 and the equation is given as follows:
 | (5) |
 | (6) |
| Adsorbates | Langmuir | Freundlich | |||||
|---|---|---|---|---|---|---|---|
| Qmax (mg g−1) | kL (L mg−1) | R2 | RL | kF (L mg−1) | n | R2 | |
| Cu2+ | 68.3 | 0.0180 | 0.9978 | 0.0649–0.6897 | 7.9799 | 2.9323 | 0.8423 |
| Pb2+ | 174.2 | 0.0078 | 0.9919 | 0.1381–0.8368 | 6.3105 | 1.9562 | 0.9158 |
| CR | 109.4 | 0.0134 | 0.9943 | 0.0853–0.7491 | 7.7868 | 2.3890 | 0.8577 |
| MB | 247.0 | 0.0073 | 0.9923 | 0.1462–0.8457 | 9.2159 | 1.9881 | 0.9395 |
Freundlich isotherm equation, the most widely used adsorption isotherm for heterogeneous surface of adsorbent, is an empirical relationship as eqn (7) describes.
 | (7) |
All corresponding parameters are summarized in Table 2. Comparing their linear correlation coefficients R2, it is concluded that the adsorption for Cu2+, Pb2+, CR and MB on C-MHCs was well fitted to the Langmuir isotherm equation. In addition, the suitable Langmuir constant (kL > 0) and reasonable separation factor (0 < RL < 1) also demonstrate the feasibility of the Langmuir isotherm, illuminating the monolayer homogeneous adsorption of C-MHCs.
As shown in Table 2, Qmax of C-MHCs is 68.3, 174.2, 109.4 and 247.0 mg g−1 for Cu2+, Pb2+, CR and MB, respectively. Compared with representative studies about MnOx and MnOx composite adsorbents in Table 3,6,29,38–43 the C-MHCs show improved adsorption capacities. This excellent adsorption performance directly benefits from the hollow and flat fiber structure and high hydrophilicity of native cotton fibers. Moreover, the two-dimensional lamina-stacked birnessite-MnO2 granules with a uniform distribution provide more additive sites for adsorption, suggesting that the C-MHCs is a promising candidate for applications in wastewater treatment.
| Adsorbent | Adsorption capacity (mg g−1) | Reference | |||
|---|---|---|---|---|---|
| Cu2+ | Pb2+ | CR | MB | ||
| MnO2/CNTs | 78.7 | 38 | |||
| Manganese oxide nanostructure | 68.4 | 6 | |||
| α-MnO2 hierarchical hollow microspheres | 96.0 | 39 | |||
| Hollow MnO2 nanostructure | 60.0 | 40 | |||
| MWCNTs/MnO2 | 19.9 | 41 | |||
| Manganese oxide coated sand | 2.1 | 1.8 | 42 | ||
| Cellulose–manganese oxide | 80.1 | 29 | |||
| Manganese oxide coated zeolite | 10.2 | 75.8 | 43 | ||
| C-MHCs | 68.3 | 174.2 | 109.4 | 247.0 | This work |
Regeneration of C-MHCs
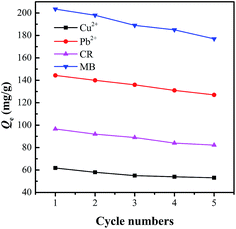
Regeneration ability is a vital factor to evaluate the performance of an adsorbent, and desorption process aims to refresh the adsorption capacity of the adsorbent at the maximum extent for effective reuse. As shown in Fig. 9, the Qe for all pollutants can still keep above 85% of the initial adsorbability at the fifth cycle, indicating a benign renewable adsorbent. Furthermore, the phenomenon that the adsorbates can be desorbed by strong mineral acids or bases demonstrates that the electrostatic interaction and chemisorption contribute to a large proportion of adsorption capacity.44 This desorption process shows a similar correlation and mutual correspondence with the pH-dependent adsorbability of C-MHCs.Conclusions
This study reported the fabrication of the C-MHCs via a new and efficient “ion exchange–redox reaction” strategy, in which cotton fibers worked as nanoreactor and macroscopic support for a straightforward separation of pollutants. A series of characterizations demonstrate that the C-MHCs are equipped with homogeneous monolayer coverage of MnO2 nanoparticles formed by lamella-stacked birnessite-MnO2 granules with high reactivity. Compared with the adsorbability of representative studies, the C-MHCs show improved adsorption capacity for cationic and anionic pollutants. The adsorption behavior follows pseudo-second-order kinetics and Langmuir isotherm, with the Langmuir monolayer capacity of 68.3, 174.2, 109.4 and 247.0 mg g−1 for Cu2+, Pb2+, CR and MB, respectively. In terms of advantageous straightforward separation after adsorption, the C-MHCs were regenerated and the adsorption amounts could be retained above 85% at the 5th adsorption–desorption cycle for all pollutants, demonstrating that the C-MHCs are versatile and renewable candidates for wastewater treatment.Acknowledgements
This study was supported by the Graduate Student Innovation Project of Jiangsu Province (No. KYLX16_0134), and the Natural Science Foundation of Jiangsu Province (No. BK20140347).Notes and references
- A. Salama, J. Colloid Interface Sci., 2017, 487, 348–353 CrossRef CAS PubMed.
- I. Michael, L. Rizzo, C. McArdell, C. Manaia, C. Merlin, T. Schwartz, C. Dagot and D. Fatta-Kassinos, Water Res., 2013, 47, 957–995 CrossRef CAS PubMed.
- M. S. Sajab, C. H. Chia, S. Zakaria, S. M. Jani, M. K. Ayob, K. L. Chee, P. S. Khiew and W. S. Chiu, Bioresour. Technol., 2011, 102, 7237–7243 CrossRef CAS PubMed.
- W. W. Ngah, L. Teong and M. Hanafiah, Carbohydr. Polym., 2011, 83, 1446–1456 CrossRef.
- A. Z. Aroguz, J. Gulen and R. Evers, Bioresour. Technol., 2008, 99, 1503–1508 CrossRef CAS PubMed.
- H. Chen and J. He, J. Phys. Chem. C, 2008, 112, 17540–17545 CAS.
- L. Espinal, S. L. Suib and J. F. Rusling, J. Am. Chem. Soc., 2004, 126, 7676–7682 CrossRef CAS PubMed.
- Y. Ren, N. Yan, Q. Wen, Z. Fan, T. Wei, M. Zhang and J. Ma, Chem. Eng. J., 2011, 175, 1–7 CrossRef CAS.
- L. Dong, Z. Zhu, H. Ma, Y. Qiu and J. Zhao, J. Environ. Sci., 2010, 22, 225–229 CrossRef CAS.
- E. Deliyanni, E. Peleka and K. Matis, J. Hazard. Mater., 2009, 172, 550–558 CrossRef CAS PubMed.
- T. Pradeep, Thin Solid Films, 2009, 517, 6441–6478 CrossRef CAS.
- B. Pan, B. Pan, W. Zhang, L. Lv, Q. Zhang and S. Zheng, Chem. Eng. J., 2009, 151, 19–29 CrossRef CAS.
- X. Pang, Y. He, J. Jung and Z. Lin, Science, 2016, 353, 1264–1272 CrossRef PubMed.
- D. Dutta, R. Hazarika, P. D. Dutta, T. Goswami, P. Sengupta and D. K. Dutta, RSC Adv., 2016, 6, 85173–85181 RSC.
- A. Fukuoka and P. L. Dhepe, Angew. Chem., Int. Ed., 2006, 45, 5161–5163 CrossRef CAS PubMed.
- X. Zhang, H. Yu, H. Yang, Y. Wan, H. Hu, Z. Zhai and J. Qin, J. Colloid Interface Sci., 2015, 437, 277–282 CrossRef CAS PubMed.
- L. Zhou, J. He, J. Zhang, Z. He, Y. Hu, C. Zhang and H. He, J. Phys. Chem. C, 2011, 115, 16873–16878 CAS.
- M. L. Chacón-Patiño, C. Blanco-Tirado, J. P. Hinestroza and M. Y. Combariza, Green Chem., 2013, 15, 2920 RSC.
- Y. Wang, X. Zhang, X. He, W. Zhang, X. Zhang and C. Lu, Carbohydr. Polym., 2014, 110, 302–308 CrossRef CAS PubMed.
- J.-S. Hu, L.-S. Zhong, W.-G. Song and L.-J. Wan, Adv. Mater., 2008, 20, 2977–2982 CrossRef CAS.
- J. Fei, Y. Cui, J. Zhao, L. Gao, Y. Yang and J. Li, J. Mater. Chem., 2011, 21, 11742 RSC.
- H. Wang, D. Ma, X. Huang, Y. Huang and X. Zhang, Sci. Rep., 2012, 2, 701 Search PubMed.
- J.-H. Lee, Sens. Actuators, B, 2009, 140, 319–336 CrossRef CAS.
- R. H. Setyanto, K. Diharjo, P. Setyono and I. M. Miasa, J. Mater. Sci. Res., 2013, 2, 80–88 CAS.
- A. bin Jusoh, W. H. Cheng, W. M. Low, A. Nora'aini and M. J. Megat Mohd Noor, Desalination, 2005, 182, 347–353 CrossRef CAS.
- S. Liang, F. Teng, G. Bulgan, R. Zong and Y. Zhu, J. Phys. Chem. C, 2008, 112, 5307–5315 CAS.
- C.-H. Kuo and C.-K. Lee, Carbohydr. Polym., 2009, 77, 41–46 CrossRef CAS.
- M. L. Nelson and R. T. O'Connor, J. Appl. Polym. Sci., 1964, 8, 1325–1341 CrossRef CAS.
- S. M. Maliyekkal, K. P. Lisha and T. Pradeep, J. Hazard. Mater., 2010, 181, 986–995 CrossRef CAS PubMed.
- Q. Lu, L. Tang, F. Lin, S. Wang, Y. Chen, X. Chen and B. Huang, Cellulose, 2014, 21, 3497–3506 CrossRef CAS.
- Y. Hu, J. Wang, X. Jiang, Y. Zheng and Z. Chen, Appl. Surf. Sci., 2013, 271, 193–201 CrossRef CAS.
- J. Xiong, C. Jiao, C. Li, D. Zhang, H. Lin and Y. Chen, Cellulose, 2014, 21, 3073–3087 CrossRef CAS.
- B. Zhu, P. Xia, W. Ho and J. Yu, Appl. Surf. Sci., 2015, 344, 188–195 CrossRef CAS.
- A. P. Vieira, S. A. Santana, C. W. Bezerra, H. A. Silva, J. A. Chaves, J. C. de Melo, E. C. da Silva Filho and C. Airoldi, J. Hazard. Mater., 2009, 166, 1272–1278 CrossRef CAS PubMed.
- Y. Aldegs, M. Elbarghouthi, A. Elsheikh and G. Walker, Dyes Pigm., 2008, 77, 16–23 CrossRef CAS.
- J. Tao, J. Xiong, C. Jiao, D. Zhang, H. Lin and Y. Chen, ACS Sustainable Chem. Eng., 2016, 4, 60–68 CrossRef CAS.
- I. Langmuir, J. Am. Chem. Soc., 1918, 40, 1361–1403 CrossRef CAS.
- S. Wang, W. Gong, X. Liu, Y. Yao, B. Gao and Q. Yue, Sep. Purif. Technol., 2007, 58, 17–23 CrossRef CAS.
- J. Wang, J. Liu, Y. Zhou, P. Hodgson and Y. Li, RSC Adv., 2013, 3, 25937 RSC.
- J. B. Fei, Y. Cui, X. H. Yan, W. Qi, Y. Yang, K. W. Wang, Q. He and J. B. Li, Adv. Mater., 2008, 20, 452–456 CrossRef.
- M. A. Salam, Colloids Surf., A, 2013, 419, 69–79 CrossRef.
- R. Han, W. Zou, Z. Zhang, J. Shi and J. Yang, J. Hazard. Mater., 2006, 137, 384–395 CrossRef CAS PubMed.
- W. Zou, R. Han, Z. Chen, J. Shi and L. Hongmin, J. Chem. Eng. Data, 2006, 51, 534–541 CrossRef CAS.
- A. Roy, B. Adhikari and S. Majumder, Ind. Eng. Chem. Res., 2013, 52, 6502–6512 CrossRef CAS.
Footnote |
| † Electronic supplementary information (ESI) available: Nitrogen sorption isotherms and pore size distribution curves of raw cotton and C-MHCs, effect of various MnO2 loads on adsorption capacity, TG analysis, and pore structure characteristics of raw cotton and C-MHCs. See DOI: 10.1039/c7ra04287f |
| This journal is © The Royal Society of Chemistry 2017 |

