 Open Access Article
Creative Commons Attribution 3.0 Unported Licence
Computational assignments of lattice vibrations of ice Ic†
Zhen-Yu Yuana,
Peng Zhang *a,
Shu-kai Yaoa,
Ying-Bo Lua,
Hao-Zhi Yangb,
Hui-Wen Luoa and
Zeng-Ji Zhaoa
aSchool of Space Science and Physics, Shandong University, Weihai, 264209, China. E-mail: zhangpeng@sdu.edu.cn
bSupercomputing Center, Shandong University, Weihai, 264209, China
First published on 25th July 2017
Abstract
Herein, via the first-principles density functional theory, CASTEP code, we investigated the 15 vibrational normal modes of ferroelectric hydrogen-ordered phase of ice Ic. The physical mechanism of hydrogen bond vibrations has been indicated by two type of peaks: the weak peak corresponds to two hydrogen bonds participating in the basal plane and the strong peak is composed by four hydrogen bonding vibrations for one molecule along the optic axis. The assignments of vibrational spectrum are individually conducted via the analysis of normal modes. The agreements of experimental data with the computed results manifest that the hydrogen-disordered bulk Ic may be composed by domains of a ferroelectric-ordered phase. We also predicted that the ferroelectric phase of ice Ic should show a birefringent phenomenon along the optical axis provided that a single crystal of the ferroelectric phase of ice Ic could be made.
Introduction
Water/ice covers 71% of the Earth's surface and is vital for all known forms of life. It has more than 17 different crystal phase and amorphous phase structures under certain pressure and temperature.1–10 In some crystalline ice structures, such as the common ice phase, ice Ih, the oxygen atoms form a regular lattice, whereas the hydrogen atoms are irregular; in other phases, such as ice II, the hydrogen atoms are arranged in an ordered way. In fact, many existent phases are paired, for instance, ice Ih and its hydrogen-ordered counterpart ice XI, which have identical oxygen sublattice but different hydrogen order. To computationally study the vibration spectrum of the ice phase, a hydrogen-ordered structure may greatly reduce the workload due to its simple primitive cell and present the main physical features.11 In this study, the lowest energy structure of the ferroelectric-ordered phase of ice Ic was simulated, and two hydrogen bonds were specifically investigated.Konig was the first to identify and deduce the structure of ice Ic.12 The oxygen atoms in ice Ic are arranged in a diamond structure. It is very similar to ice Ih, with almost the same density and lattice constants along the hexagonal puckered-planes.13 The ice Ic forms at temperatures between 130 and 220 K, and upon heating, it can remain stable up to 240 K.14,15 Then, it transforms into ice Ih. Ice Ic can also be produced from amorphous ice13,16 as well as from ice II, ice III, and ice V under high pressure.17 It can occasionally be found in the upper atmosphere18 and is responsible for the observation of the Scheiner's halo that occurs around 28 degrees from the Sun or the Moon.19 Many references, particularly those discussing cirrus clouds, have mentioned ice Ic.18,20–23 However, the bulk ice Ic is hard to be experimentally synthesized.24–26 At this stage, to date, the stacking disordered ice with maximally 70% cubic stacking has been prepared.27
Lekner et al. calculated about 90 hydrogen configurations to investigate the energetics of hydrogen arrangements in ice Ic with a unit cell containing 8 water molecules.28,29 They indicated that the totally ordered antiferroelectric hydrogen configuration had the lowest electrostatic energy, whereas the ferroelectric hydrogen configuration had the highest electrostatic energy. However, the calculations were found to be different from those reported by Geiger et al. via a combination of spectroscopic experiments and first-principles simulations;30,31 this indicated that the ferroelectrically ordered structure was the most stable geometric structure (space group I41md).32 Although they could not indicate the ferroelectric structure as a unique assignment, it was meaningful to investigate this model to simulate the vibration spectrum since it fitted the experimental spectra very well. They concluded that the experimental spectra manifested the partial hydrogen ordering structure in cubic ice, but no unique assignment of hydrogen order was possible. We considered this view and hypothesized that the bulk Ic was mainly composed by domains of hydrogen ordering structures. Interestingly, Del Ben et al. reported a model to explain the disagreement between theory and experiment and suggested that complete transformation to ferroelectric ice XV was disfavored under open-circuit conditions but might be favored under closed-circuit conditions.33 Herein, we investigated the ferroelectric structure to reveal the relationship between vibration modes and frequencies. The physical mechanism of splitting of two hydrogen bond peaks obtained via inelastic neutron scattering (INS) has particularly been discussed in this study.
Computational methodology
Using the CASTEP code,34 a first-principles density functional theory (DFT) method, we calculated the ferroelectric hydrogen-ordered phase of ice Ic. The normal modes at the Brillouin zone (BZ) center as well as the phonon density of states (PDOS) of ice Ic are specially designated. The PDOS are integrated by dispersion curves, which provide the phonons of lattice vibrations in the whole BZ and can be compared with the INS spectrum. Additionally, the peaks of photon scattering are close to the frequencies of normal modes near the BZ center. Due to different interaction mechanisms, there are discrepancies between neutron scattering and photon scattering. In this study, the experimental data of neutron scattering and photon scattering have been discussed with computed outcomes, which shed light on the physical insights for the vibrational spectra assignments of ice Ic.The XC function of GGA RPBE35 is chosen for this study based on our previous experience. The energy and SCF tolerance should take the maximum values for geometry optimization. The energy cut-off is set at 1200 eV, and the K-point mesh is 7 × 7 × 8 in the reduced BZ. The norm-conserving pseudopotentials are used to calculate the PDOS and polarizability.
Results and discussion
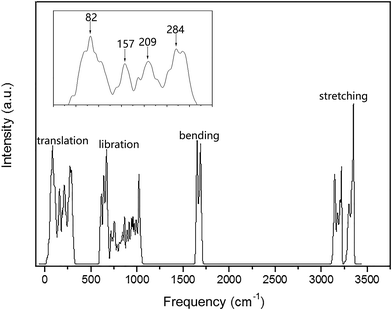
The PDOS of the ferroelectric structure ice Ic based on harmonic approximations is shown in Fig. 1 with four separated vibration regions, and the correlated data are listed in Table 1. The simulation accomplished herein is an ordered hydrogen configuration in a 6-atom primitive cell,32 which makes a great reduction in the optical vibration modes. The results are quite consistent with literature stating that the main features of the spectrum are largely uniform. There is a slight red-shift in the translation region, and a blue-shift for the intramolecular vibration due to the XC function of RPBE slightly makes an underestimation of the hydrogen bond (H-bond). Table 1 is a comparison of four types of frequency peaks: PDOS, INS, normal modes, and photon scattering data. Herein, the neutron and photon scattering data are obtained from literature reports on ice Ic. Comparisons could be made between the normal modes at the gamma point and the photon scattering experiments due to the reason that the interactions between electromagnetic waves and lattice waves were restricted near the BZ center. However, it is difficult to point out one peak from the PDOS to an accurate vibration mode since the peaks are generated by integrating the phonon signals throughout the BZ. Theoretically, the PDOS could be verified by the INS since the experimental data indicated all the signals in the BZ. Fig. 2 presents the dispersion curves of the vibration modes on the left and the integrated PDOS curve on the right. From the dispersion curves, it can be observed that there are 3 × 6 − 3 = 15 optical branches for a 6-atom primitive cell, and these 15 normal modes at the gamma point have been discussed hereinafter.| PDOS | INS (ref. 44/45) | Normal modes | Photon scattering (ref. 46/47/48) |
|---|---|---|---|
| 82 | 57/— | ||
| 107/— | |||
| 157 | 153/— | ||
| 209 | 225/— | 230(2) | 228/—/— |
| 284 | 298/304 | 321 | |
| 540/588 | 589(2) | 570/520/— | |
| 612 | 629/— | 613 | 690/—/— |
| 668 | |||
| 751 | |||
| 863 | |||
| 956 | 930/927 | 923(2) | 833/812/— |
| 1020 | —/1024 | 1053 | |
| 1650 | 1612/— | 1630 | 1604/1620/— |
| 1687 | 1708 | ||
| 3142 | 3200/— | 3113 | 3149/3170/3083 |
| 3217 | 3337/— | 3220(2) | 3217/3240/3215 |
| 3347 | 3334 | 3340/3380/3320 |
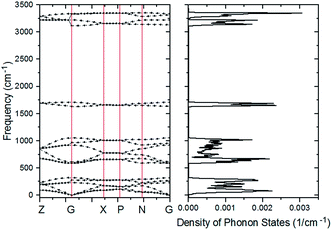 | ||
| Fig. 2 The curve of PDOS on the right is an accumulation of the dispersion curve on the left. The vertical coordinate of the PDOS curve corresponds to the horizontal coordinate in Fig. 1. | ||
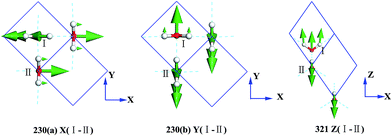
Fig. 3 presents the intermolecular translational vibrations. The crystal axis C is parallel to the coordinate axis Z, which is perpendicular to the XY plane. The green arrows represent the vibration direction, with the sizes proportional to the amplitude. We used I and II to label two molecules in one Ic primitive cell. The right molecule is the same as II in the neighboring cell. The side view is in the XY plane for the mode at 230(a) and 230(b) cm−1, and it is in the XZ plane for the mode at 321 cm−1. The two degenerate modes at 230 cm−1 vibrate along the X and Y axes, and the normal mode at 321 cm−1 vibrates along the Z axis. We used + and - to indicate whether the vibration direction of the molecule II is the same as that of the molecule I. The ESI Video T1† illustrates the vibration process of 230(a). While molecule I is stretching towards the negative direction of the X axis, molecule II is vibrating towards the opposite direction. Therefore, this vibration mode is named as X(I-II). In this region, there are three peaks at 57, 105, and 153 cm−1 obtained via the INS experiments, but they are absent in the normal modes and IR spectrum. They are obviously signals that belong to an acoustic branch. The illustrated three normal modes in the translational region are H-bond vibrations.
However, the role of H-bonding in this region is still unclear.36–39 Since the discovery of two H-bond peaks from the INS spectra of ice Ih, XI, and Ic, explanations on this issue led to considerable debates. Li and Ross proposed two H-bond strengths in their lattice dynamic simulation that appeared to have good agreement with the measured neutron scattering results. However, their proposition has not been widely accepted due to large ratios of two proposed force constants. Klotz et al. regarded the split as an incomplete description of the phonon dispersion.40 Our previous studies have discarded this model and found evidence of LO–TO splitting in the phase of ice XI.11,41,42 In the case of ice Ic, via observing the ESI Video T1–T3,† the difference between the modes of 230 and 321 can be distinguished. There are four H-bonds around one molecule. Taking the H-bond as a simple model of intermolecular connecting spring, the elastic resorting force is k for one H-bond. It can be seen that there are two spring stretchings for mode 230(a) along the X-axis as well as two spring stretchings for mode 230(b) along the Y-axis. However, the four springs are simultaneously stretching for mode 321. Then, based on the formula of a simple harmonic vibration:  , we obtained the ratio of frequency between 321 and 230 cm−1 as follows:
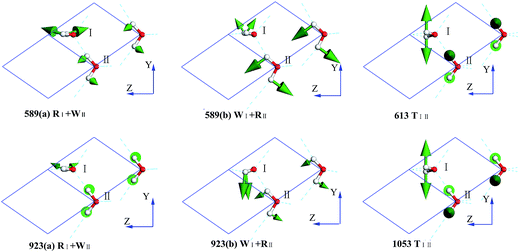
In the intermolecular librational band, there are 6 normal modes corresponding to 4 frequencies due to 4 degenerate states, as shown in Fig. 4. In this region, all the molecular vibration modes could be classified into three types: rocking, twisting, and wagging, labeled as R, T, and W, respectively. For instance, in the mode of 589(a) RI + WII (ESI Video L1†), I is rocking and II is wagging simultaneously. Li et al. have pointed out that the spectra of ice Ic and Ih are fundamentally the same, having almost the same optical peaks and the same bandwidth in the librational band. Moreover, Carr et al. conducted a detailed analysis of the spectra of the stacking disordered ice and observed that the difference in the spectra of ice Ih and Ic was very small.43 We have listed the peaks of ice Ih in Table 1 based on Li's works.44,45 A simple two molecule primitive cell just contributes 15 normal modes. Therefore, the figure of the PDOS shows distinct sharp peaks. Compared with those in the INS spectrum, the simulated librational band presents the same tendency curves. The vibration mode at 1053 cm−1 is only obtained in the INS experiment. Hardin et al. have reported three peaks at 833, 690, and 570 cm−1 (IR),46 corresponding to our result (923, 613, and 589 cm−1 (normal mode), respectively). Ockman assigned two peaks at 520 and 812 cm−1 to different rotational vibrations, in agreement with our result (589 and 923 cm−1 (normal modes), respectively).47 However, we disagree the point reported by him the 520 cm−1 peak is a double frequency peak of a certain rotational vibration. Although some modes have the same expression, their specific dynamic processes are different. For example, the vibrational frequencies at 613 and 1053 cm−1 are named as the same TIII, which indicates the twisting together of the two molecules. As illustrated in the ESI Video L3† for the 613 mode, the hydrogen atoms of I and II dynamically keep a distance. For the 1053 mode, the hydrogen atoms become alternatively close to neighbors (ESI Video L6†).
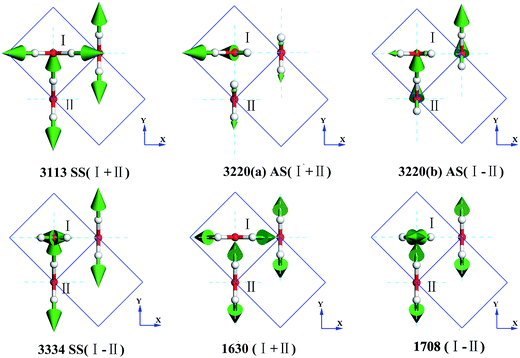
As for the intramolecular bending region, there are only two normal modes, as shown in Fig. 5. The symbols + and - represent whether the molecule II is in-phase or out-of-phase with I, respectively. It can be seen that the in-phase bending has lower energy. In the mode 1708 (I-II), I is opening, whereas II is closing (ESI Video B2†). The infrared spectrum obtained by Hardin et al.46 indicated a bending vibrational peak at 1604 cm−1, consistent with our result (1630 cm−1 (normal modes)). The weak peak at 2235 cm−1 (IR) and the shoulder at 1570 cm−1 (IR) are combinations, which are absent in our simulations. Ockman assigned a peak at 1620 cm−1 (IR) to a bending vibration corresponding to 1630 cm−1 (normal modes) as well. In the INS spectrum,47 we can find a peak at 1612 cm−1 that is consistent with 1650 cm−1 (PDOS). Studies have only reported one mode in the bending vibration. However, the computing analysis presents two different modes.
Fig. 5 also shows four intramolecular vibration modes in the O–H stretching band. There are two kinds of stretching modes for one molecule: symmetric stretching and asymmetric stretching. The symbol SS refers to symmetric stretching vibration and AS refers to asymmetric stretching vibration. We used the sign + and the sign - to indicate whether the vibrations were in-phase or out-of-phase, respectively, for the SS type. As for the two degenerate cases of AS at 3220 cm−1, they are difficult to depict and the signs just distinguish the two different vibrational modes. Taylor et al. detected three peaks in the Raman spectrum of ice Ic, which were 3083, 3215, and 3320 cm−1.48 They seem consistent with our result of 3113, 3220, and 3334 cm−1 peaks (normal mode). However, the simulations show that the intensity of the 3334 cm−1 peak in the Raman spectrum should be very small. Ockman assigned the peaks at 3240 cm−1 (IR) to AS and 3380 cm−1 (IR) to SS, in agreement with our assignments of 3220 and 3334 cm−1, respectively.47 He indicated that the peak at 3170 cm−1 (IR) was due to the double frequency of 1620 cm−1 (IR), but we could not verify this since we only presented the ground states. Hardin et al. have also assigned the peaks at 3149 cm−1 (IR) to SS and 3217 cm−1 (IR) to AS, which are consistent with the normal modes at 3113 and 3220 cm−1, respectively.46 They assigned the peak at 3340 cm−1 (IR) to a combination of 3149 cm−1 (SS) and 213 cm−1, which is different from that obtained herein. Li et al. have pointed out that the INS spectra of ice Ic and Ih are fundamentally the same and assigned the peaks at 3200 and 3337 cm−1, which are consistent with our results of 3142 and 3217 cm−1, respectively (PDOS).45 Whalley has indicated that there exists a TO–LO splitting of O–H AS vibrations in the H–O stretching band of ice Ic of up to 114 cm−1.49 According to our results, the experimentally obtained data at 3083(Raman)/3150(IR) cm−1 is in correspondence to SS 3113 cm−1 in this study; 3209(Raman)/3220(IR) cm−1 are the two degenerate modes of AS 3220 cm−1; and 3323(Raman)/3380(IR) cm−1 is the SS mode at 3334 cm−1. Thus, we disagree with Whalley's assignment in this region. Herein, consistency between the IR spectra and simulated normal modes can be observed. Since the INS spectrum reflected the whole signals around the BZ, we only verified the validity by the PDOS and found it difficult to point the peak to a special mode. Additionally, we present two degenerate modes at 3220 cm−1, which are not analyzed from the experimental work. To understand the dynamic process, please find the movies in the ESI (Video S1–S4†).
Conclusions
The vibrational spectrum of the ferroelectric phase of ice Ic was simulated using the first-principles DFT method. According to the discussion of the 15 normal modes, the PDOS peaks in our results are consistent with the INS data; this manifests the accuracy of the simulation conducted in this study. The photon scattering spectrum is close to the analysis of normal modes, and the physical insights can be individually obtained. At last, the assignments of the vibrational spectrum of crystalline material could be illustrated according to the physical mechanism.The splitting of H-bonds observed via the INS experiment could be explained as follows: there were two H-bonds participating in vibrations in the basal plane, whereas four H-bonds stretched together along the C axis. Since there is an agreement between the vibrational spectrum of disordered Ic and the ferroelectric model, we proposed that the bulk Ic might be composed by the domains of the ferroelectric-ordered phase. In this case, we predicted that the ordered phase of ice Ic should have a birefringent phenomenon along the C axis such that a single crystal of the ferroelectric phase of ice Ic could be obtained.
Acknowledgements
We would like to thank the National Natural Science Foundation of China with Grant No. 11504202 for the support. The numerical calculations in this study have been conducted using the supercomputing system in the Supercomputing Center, Shandong University, Weihai.References
- J. E. Bertie and E. Whalley, J. Chem. Phys., 1967, 46, 1271–1284 CrossRef CAS
.
- J. E. Bertie, L. D. Calvert and E. Whalley, J. Chem. Phys., 1963, 38, 840–846 CrossRef CAS
.
- W. F. Kuhs, J. L. Finney, C. Vettier and D. V. Bliss, J. Chem. Phys., 1963, 81, 3612–3623 CrossRef
.
- E. Whalley, J. B. R. Heath and D. W. Davidson, J. Chem. Phys., 1968, 48, 2362–2370 CrossRef CAS
.
- Y. Tajima, T. Matsuo and H. Suga, Nature, 1982, 299, 810–812 CrossRef CAS
.
- K. R. Hirsch and W. B. Holzapfel, J. Chem. Phys., 1986, 84, 2771–2775 CrossRef CAS
.
- C. Lobban, J. L. Finney and W. F. Kuhs, Nature, 1998, 391, 268–270 CrossRef CAS
.
- C. G. Salzmann, P. G. Radaelli, A. Hallbrucker, E. Mayer and J. L. Finney, Science, 2006, 311, 1758–1761 CrossRef CAS PubMed
.
- C. G. Salzmann, P. G. Radaelli, E. Mayer and J. L. Finney, Phys. Rev. Lett., 2009, 103, 105701–105704 CrossRef PubMed
.
- A. Falenty, T. C. Hansen and W. F. Kuhs, Nature, 2014, 516, 213–233 CrossRef PubMed
.
- P. Zhang, Z. Wang, Y. B. Lu and Z. W. Ding, Sci. Rep., 2016, 6, 29273–29281 CrossRef CAS PubMed
.
- V. H. Konig, Z. Kristallogr., 1943, 105, 279–286 Search PubMed
.
- L. G. Dowell and A. P. Rinfret, Nature, 1960, 189, 1144–1148 CrossRef
.
- B. J. Murray and A. K. Bertram, Phys. Chem. Chem. Phys., 2006, 8, 186–192 RSC
.
- B. J. Murray, Environ. Res. Lett., 2008, 3, 025008–025014 CrossRef
.
- E. Mayer and A. Hallbrucker, Nature, 1987, 325, 601–602 CrossRef CAS
.
- J. E. Bertie, L. D. Calvert and E. Whalley, J. Chem. Phys., 1963, 38, 840–846 CrossRef CAS
.
- B. J. Murray, D. A. Knopf and A. K. Bertram, Nature, 2005, 434, 202–205 CrossRef CAS PubMed
.
- E. Whalley, Science, 1981, 211, 389–390 CAS
.
- T. Peter, C. Marcolli, P. Spichtinger, T. Corti, M. B. Baker and T. Koop, Science, 2006, 314, 1399–1402 CrossRef CAS PubMed
.
- J. E. Shilling, M. A. Tolbert, O. B. Toon, E. J. Jensen, B. J. Murray and A. K. Bertram, Geophys. Res. Lett., 2006, 33, 499–514 CrossRef
.
- D. M. Murphy, Geophys. Res. Lett., 2003, 30, 179 CrossRef
.
- B. J. Murray, T. W. Wilson, S. Dobbie, Z. Q. Cui, S. M. R. K. Al-Jumur, O. Mohler, M. Schnaiter, R. Wagner, S. Benz, M. Niemand, H. Saathoff, V. Ebert, S. Wagner and B. Karcher, Nat. Geosci., 2010, 3, 233–237 CrossRef CAS
.
- W. F. Kuhs, D. V. Bliss and J. L. Finney, J. Phys., Colloq., 1987, 48, 631–636 Search PubMed
.
- T. L. Malkin, B. J. Murray, A. V. Brukhno, J. Anwar and G. Salzmann, Proc. Natl. Acad. Sci. U. S. A., 2012, 109, 1041–1045 CrossRef CAS PubMed
.
- W. F. Kuhs, C. Sippel, A. Falenty and T. C. Hansen, Proc. Natl. Acad. Sci. U. S. A., 2012, 109, 21259–21264 CrossRef CAS PubMed
.
- T. L. Malkin, B. J. Murray, C. G. Salzmann, V. Molinero, S. J. Pickering and T. F. Whale, Phys. Chem. Chem. Phys., 2015, 17, 60–76 RSC
.
- J. Lekner, Phys. B, 1997, 240, 263–272 CrossRef CAS
.
- J. Lekner, Phys. B, 1998, 252, 149–159 CrossRef CAS
.
- Z. Raza, K. Alfe, C. G. Salzmann, J. Klimes, A. Michaelides and B. Slater, Phys. Chem. Chem. Phys., 2011, 13, 19788–19795 RSC
.
- S. Hirata, K. Gilliard, X. He, J. Li and O. Sode, Acc. Chem. Res., 2014, 47, 2721–2730 CrossRef CAS PubMed
.
- P. Geiger, C. Dellago, M. Macher, C. Franchini, G. Kresse, J. Bernard, J. N. Stern and T. Loerting, J. Phys. Chem. C, 2014, 118, 10989–10997 CAS
.
- M. D. Ben, J. V. Vondele and B. Slater, J. Phys. Chem. Lett., 2014, 5, 4122–4128 CrossRef PubMed
.
- S. J. Clark, M. D. Segall, C. J. Pickard, P. J. Hasnip, M. I. J. Probert, K. Refson and M. C. Payne, Z. Kristallogr., 2005, 220, 567–570 CAS
.
- B. Hammer, L. B. Hansen and J. K. Norskov, Phys. Rev. B: Condens. Matter Mater. Phys., 1999, 59, 7413–7421 CrossRef
.
- D. D. Klug and E. Whalley, J. Glaciol., 1978, 21, 55–63 CrossRef CAS
.
- M. Marchi, J. S. Tse and M. L. Klein, J. Chem. Phys., 1986, 85, 2414–2418 CrossRef CAS
.
- J. C. Li and D. K. Ross, Nature, 1993, 365, 327–329 CrossRef CAS
.
- J. S. Tse and D. D. Klug, Phys. Lett. A, 1995, 198, 464–466 CrossRef CAS
.
- S. Klotz, T. Strassle, C. G. Salzmann, J. Philippe and S. F. Parker, Europhys. Lett., 2005, 72, 576–582 CrossRef CAS
.
- P. Zhang, L. Tian, Z. P. Zhang, G. Shao and J. C. Li, J. Chem. Phys., 2012, 137, 044504–044508 CrossRef CAS PubMed
.
- P. Zhang, S. H. Han, H. Yu and Y. Liu, RSC Adv., 2013, 3, 6646–6649 RSC
.
- T. H. G. Carr, J. J. Shephard and C. G. Salzmann, J. Phys. Chem. Lett., 2014, 5, 2469–2473 CrossRef CAS PubMed
.
- J. C. Li, J. Chem. Phys., 1996, 105, 6733–6755 CrossRef CAS
.
- J. C. Li, D. K. Ross, L. Howe, P. G. Hall and J. Tomkinson, Phys. B, 1989, 156, 376–379 CrossRef
.
- A. H. Hardin and K. B. Harvey, Spectrochim. Acta, Part A, 1973, 29, 1139–1151 CrossRef CAS
.
- N. Ockman, Adv. Phys., 1958, 7, 199–220 CrossRef CAS
.
- M. J. Taylor and E. Whalley, J. Chem. Phys., 1964, 40, 1660–1664 CrossRef CAS
.
- E. Whalley, Can. J. Chem., 1997, 55, 3429–3441 CrossRef
.
Footnote |
| † Electronic supplementary information (ESI) available. See DOI: 10.1039/c7ra04332e |
| This journal is © The Royal Society of Chemistry 2017 |

