 Open Access Article
Mn4+ doped fluorotitanate phosphors: synthesis, optical properties and application in LED devices†
Qiang Zhoua,
Huiying Tana,
Qiuhan Zhanga,
Nan Wanga,
Qianwen Weia,
Zhengliang Wang *a,
Meizhu Rongb and
Qin Wang*b
aKey Laboratory of Comprehensive Utilization of Mineral Resource in Ethnic Regions, Joint Research Centre for International Cross-border Ethnic Regions Biomass Clean Utilization in Yunnan, School of Chemistry and Environment, Yunnan Minzu University, Kunming, 650500, P. R. China. E-mail: wangzhengliang@foxmail.com
bCollege of Chemistry and Chemical Engineering, Yunnan Normal University, Kunming, 650500, P. R. China. E-mail: wangqinynnu@163.com
First published on 23rd June 2017
Abstract
In this work, we report an optimized cation exchange route for the production of a narrow-band A2TiF6:Mn4+ (A = K, Na and Cs) red emitting phosphor using a small amount of non-toxic HAc solution instead of volatile and corrosive HF liquid. The crystal structure, morphology and doping amount of the A2TiF6:Mn4+ products were characterized by powder X-ray diffraction (XRD), scanning electron microscopy (SEM), energy-dispersive X-ray spectroscopy (EDS) and atomic absorption spectrophotometry (AAS) in detail. The influence of the molar ratio of the raw materials, HAc concentration and reaction time on the photoluminescence behavior has been systematically investigated. Moreover, the role of HAc in the formation process is discussed in detail. By revealing its application in white light-emitting diodes (WLEDs) with tunable chromaticity coordinates and correlated color temperature, we confirm that the substitution of HAc for HF will increase the large scale production feasibility of the A2TiF6:Mn4+ red phosphor for the WLED industry.
1. Introduction
In October 2014, Isamu Akasaki, Hiroshi Amano and Shuji Nakamura jointly won the Nobel Prize in Physics because of their successful and creative work in “the invention of efficient blue light-emitting diodes which has enabled bright and energy-saving white light sources” from the early 1990s.1 Bright blue light beams emitted from blue LED chips can be absorbed by a yellow phosphor to produce white light.2,3 Nowadays, the most popular commercial yellow phosphor, yttrium aluminum garnet (YAG, Y3Al5O12:Ce3+), has been widely used as the fundamental manufacturing constituent in the white light-emitting diode (WLED) illumination industry.4,5 However, the scarcity of red light makes the white light dazzling and uncomfortable to people's eyes, which results from its high correlated color temperature (CCT, Tc > 4500 K) and low color rendering index (CRI, Ra < 80).6,7 To overcome this drawback, considerable efforts have been devoted to exploring Mn4+ doped oxide and fluoride red phosphors, in which the energy levels of Mn4+ split and a distinct 2Eg → 4A2g transition occurs.8,9 This is why Mn4+ doped phosphors emit red light under blue light illuminations. Two typical examples are Mg2TiO4:Mn4+ and K2TiF6:Mn4+ phosphors. Merging them with YAG powders, cold white light will be balanced to warm. However, the emissions of Mg2TiO4:Mn4+ located between 650 and 720 nm, which are too far red-shifted for high luminous efficiency warm WLEDs. Therefore, a number of research attentions have been paid on Mn4+ doped fluoride phosphors, since their broad excitation and intense emission properties in the blue and red regions.10Recently, a variety of methods have been proposed to fabricate valance-stable Mn4+/Mn6+ doped red phosphors.11 Particularly for the preparation of Mn4+ doped hexa-fluorotitanate phosphor, the group of Chen fabricated K2TiF6:Mn4+ red phosphor through an ion exchange method between K2MnF6 and K2TiF6 in HF solution.12 Pan and her colleagues demonstrated the synthesis of K2TiF6:Mn4+ and BaTiF6:Mn4+ red phosphors in high-concentrated HF acid reaction medium.13,14 Xu and his co-workers prepared K2TiF6:Mn4+ product by a two-step co-precipitation approach in HF solution.15 In our previous work, we also prepared Na2TiF6:Mn4+ and Cs2TiF6:Mn4+ red phosphors in 40% HF solution.16,17 Despite these successes, it should be noted that all of these approaches employed an excess amount of corrosive HF solution in the preparation process, in order to synthesize high brightness fluorotitanate red phosphors. That is because high HF concentration is favorable for the formation of [MnF6]2− group.18 However, taking safe operation and environmental protection during the preparation process into account, it appears very urgent to develop a safe and environmental friendly solvent as the reaction medium to substitute HF solution for the fabrication of Mn4+ doped fluoride red phosphors, to avoid the extensive usage of HF acid and the resulting pollution.
In this work, we demonstrate an optimized ion exchange procedure for the fabrication of Mn4+ doped fluorotitanate (A2TiF6:Mn4+, A = K, Na and Cs) red phosphors, with the employment of green HAc acid instead of corrosive HF acid. The reaction conditions, optical properties and performance are carefully investigated in detail. All of the obtained products can present wide blue light absorption, sharp red line emission, excellent thermal stability and high color purity characteristics, implying HAc would be an efficient and feasible solvent for large scale production of A2TiF6:Mn4+ red phosphor for WLED application.
2. Experimental
2.1. Materials
All source materials in this work, including potassium hydrogen bifluoride (KHF2), potassium permanganate (KMnO4), hydrogen peroxide (H2O2, 30%), hexafluorotitanic acid (H2TiF6, 50%), potassium fluoride (KF), sodium fluoride (NaF), cesium fluoride (CsF), glacial acetic acid (HAc, 99.5%), acetone and absolute alcohol were of analytical grade and used as obtained without any further purification. The YAG yellow phosphor was commercially purchased from Shenzhen Quanjing Photon Co. Ltd., China.2.2. Materials preparation
Different from other ion exchange reaction occurred in corrosive HF solution, in this work, the formation of A2TiF6:Mn4+ products were carried out in green HAc solution. In a typical synthesis, 2.0 mmol H2TiF6 was added into 5.0 ml HAc solution with magnetic stirring in a 50 ml plastic beaker. It should be noted that HAc solution consists of a certain amount of glacial acetic acid and deionized water. Then 0.1 mmol K2MnF6 was put into the above mixture solution, followed by 5 mmol KF was added into the colorless transparent solution. After 30 min magnetic stirring, the precipitation was collected, washed with absolute alcohol for three times and dried at 60 °C for 2.0 h. For comparison, A2TiF6:Mn4+ products were prepared with different initial molar ratios between H2TiF6 and K2MnF6 (denoted as TMR, ratios are 5, 10, 15, 20, 30 and 40), and different glacial acetic acid volume of 0, 0.05, 0.1, 0.5, and 1.0 ml. Additionally, the preparation of Mn4+ precursor K2MnF6 is according to Bode's method.192.3. Fabrication of LEDs
The as-prepared A2TiF6:Mn4+ red phosphor, commercially purchased YAG yellow phosphor and blue GaN chip were used to fabricate WLED devices. Different amount of A2TiF6:Mn4+ and YAG phosphors were mixed with epoxy resin thoroughly, followed by a coating process of phosphor-epoxy resin mixture on the surface of GaN chip. The obtained WLED devices were operated and measured under a forward current of 20 mA.2.4. Material characterization
Powder X-ray diffraction (XRD, D8 Advance, Bruker, Germany) equipped with graphite monochromatized Cu Kα radiation (λ = 0.15406 nm) was used to measure the crystal structure of the as-prepared A2TiF6:Mn4+ product, which was operated at 40 kV and 20 mA from 15° to 70°. Surface morphology was observed from a scanning electron microscopy (SEM, FEI Quanta 200 Thermal FE Environment scanning electron microscopy) with an attached energy-dispersive X-ray spectrometer (EDS). Compositional analysis was performed on a Shimadzu AA-6300 atomic absorption spectrophotometer (AAS). The Diffuse Reflectance Ultraviolet-Visible spectra (DRS) and decay curve were recorded on an Cary 5000 UV-Vis-NIR spectrophotometer and an Edinburgh FLS920 combined fluorescence lifetime and steady state spectrometer with a 450 W xenon lamp and 60 W μF flash lamp, respectively. PLE and PL properties were examined on a Cary Eclipse FL1011M003 (Varian) spectrofluorometer, which employs a xenon lamp as the excitation source. A high accurate array spectrometer (HSP6000) was used to investigate the performance of WLED devices.3. Results and discussion
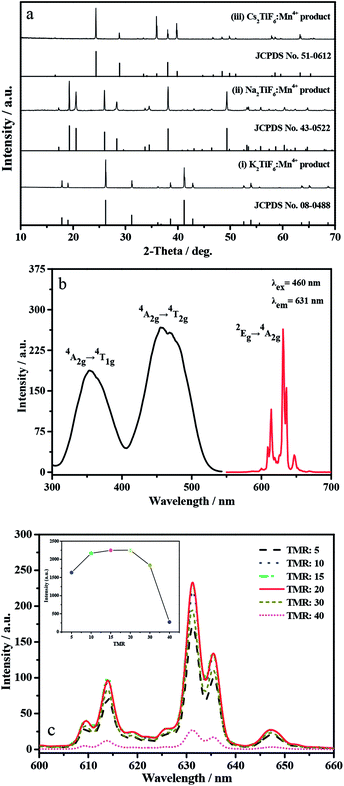
It has been reported previously that during the formation process of A2TiF6:Mn4+ phosphor, HF acid plays not only an important F source, but also prevents the hydrolysis of [MnF6]2− group. Nevertheless, the characteristics of hypertoxicity and potential fatal damage to human body make the reaction medium HF acid urgently to be replaced in the synthesis process. The group of Wang has done some useful explorations in this field.20,21 In this work, we aimed to use simple inorganic/organic acid as reaction medium during the ion exchange process. Therefore, typical normal acids, such as HNO3, H2SO4, H3PO4, HCl, and HAc were investigated and the results were displayed in Fig. S1a (see ESI†). Obviously, no matter what kinds of acid was used, K2TiF6:Mn4+ product was prepared successfully. However, it should be noted that with the same volume amount of acid in reaction system, the obtained K2TiF6:Mn4+ products exhibit different emission intensity (Fig. S1b†). It can be clearly observed that K2TiF6:Mn4+ product prepared from strong acidic environment such as H2SO4, HCl and HNO3, presents weaker PL intensity than that of HAc. Taking safe operation and environmental friendly into account, HAc is chosen as the reaction medium for the following preparation of K2TiF6:Mn4+ product.Fig. 1a shows the representative XRD pattern of the K2TiF6:Mn4+, Na2TiF6:Mn4+ and Cs2TiF6:Mn4+ products, along with the standard diffraction cards of their corresponding hosts. Clearly from curve (i), all the diffraction peaks match perfectly with the JCPDS card of K2TiF6 (No. 08-0488), which belongs to the hexagonal structure (ICSD No. 24659) with P![[3 with combining macron]](https://www.rsc.org/images/entities/char_0033_0304.gif) m1 space group. In this compound, Ti4+ ion is located at the center of the octahedral [TiF6]2− group. Since the ionic radius of Mn4+ (r = 0.530 Å) is close to that of Ti4+ (r = 0.605 Å) ion and their coordination number are same (CN = 6), the Mn4+ ions would occupy the octahedral core sites of Ti4+ in this compounds, resulting in the replacement of Mn4+ for Ti4+ in the center of [TiF6]2− octahedron. Additionally, curve (ii) and (iii) also suggest that the obtained Na2TiF6:Mn4+ and Cs2TiF6:Mn4+ products exhibit pure-phases.
m1 space group. In this compound, Ti4+ ion is located at the center of the octahedral [TiF6]2− group. Since the ionic radius of Mn4+ (r = 0.530 Å) is close to that of Ti4+ (r = 0.605 Å) ion and their coordination number are same (CN = 6), the Mn4+ ions would occupy the octahedral core sites of Ti4+ in this compounds, resulting in the replacement of Mn4+ for Ti4+ in the center of [TiF6]2− octahedron. Additionally, curve (ii) and (iii) also suggest that the obtained Na2TiF6:Mn4+ and Cs2TiF6:Mn4+ products exhibit pure-phases.
Fig. 1b displays the PLE and PL spectra of the above K2TiF6:Mn4+ product. In PLE spectrum, two broad excitation bands peaking at 353 and 460 nm can be clearly observed, which are ascribed to the spin-allowed transitions of Mn4+ from ground state 4A2g to excited states 4T1g and 4T2g respectively.21 The latter one, peaking at 460 nm, not only accords with the strongest adsorption peak of DRS result in Fig. S2 (ESI†), but also exhibits broader full width at half maximum (FWHM, 68 nm) than that of blue GaN chip emission (∼20 nm). This reveals the K2TiF6:Mn4+ phosphor can absorb blue light emissions from GaN chip efficiently. In PL part, red emissions are resulted from the spin-forbidden d–d transition of Mn4+ from 2Eg to 4A2g. The five peaks locating at 614, 619, 631, 635, and 647 nm are originated from the anti-Stokes v4, v6 and Stokes v4, v6 and v3 vibronic emissions.22 Among the five peaks, the strongest one locates at 631 nm.
Fig. 1c shows the PL spectra of K2TiF6:Mn4+ phosphors prepared with different TMRs. Apparently, the emission intensity firstly increases and then decreases with the TMR from 5 to 40. When TMR is 20, the obtained K2TiF6:Mn4+ phosphor emits the strongest red light. This may because higher TMR value means lower Mn4+ concentration and less doping amount. So, when the TMR dropped from 40 to 20, the doping amount of Mn4+ contrarily rose up from 1.42% to 2.84%, which resulting in an increase trend of the PL intensity. Continually decreasing TMR from 20 to 5, more and more Ti4+ ions were substituted until the concentration quenching phenomenon occurred, which leads to the following decrease tendency of the PL intensity. This is in agreement with the doping amount of Mn4+ in these six products, according the results of AAS (Table 1). Actually, in the case of other phosphors Na2TiF6:Mn4+ and Cs2TiF6:Mn4+, the same rise–fall phenomenon was also observed (Fig. S3 in ESI†). In a word, at this TMR of 20, the obtained K2TiF6:Mn4+ phosphor emits the brightest red light.
| Samples | TMR | Doping amount of Mn4+ (mol%) |
|---|---|---|
| i | 5 | 8.84 |
| ii | 10 | 6.41 |
| iii | 15 | 5.16 |
| iv | 20 | 2.84 |
| v | 30 | 1.99 |
| vi | 40 | 1.42 |
Fig. 2a shows the SEM image of the above K2TiF6:Mn4+ product. It clearly exhibits that the particles have a particulate morphology with an apparent large size of ca. 40 μm. Additionally, we can clearly observe the smooth surfaces, clear edges and corners on these particles, implying the sample has been well crystallized into crystals.23 From the corresponding EDS spectrum, the elements of F, Ti, K, and Mn, as well the absence of O element, can be clearly recognized (Fig. S4†). This result suggests that the Mn element has been successfully doped into the crystal structure of K2TiF6 matrix to occupy the lattice site of Ti, and no MnO2 was produced during the entire preparation process. This result is line with the above PL results. Using HAc solution as reaction medium, Na2TiF6:Mn4+ and Cs2TiF6:Mn4+ products were also obtained and presented the same characteristic of particulate morphologies (Fig. 2d and e). Moreover, observed by naked eyes, the K2TiF6:Mn4+ sample shows a striking yellow color under natural light illumination (Fig. 2b) whist emits brilliant red light under blue light (460 nm) illumination (Fig. 2c).
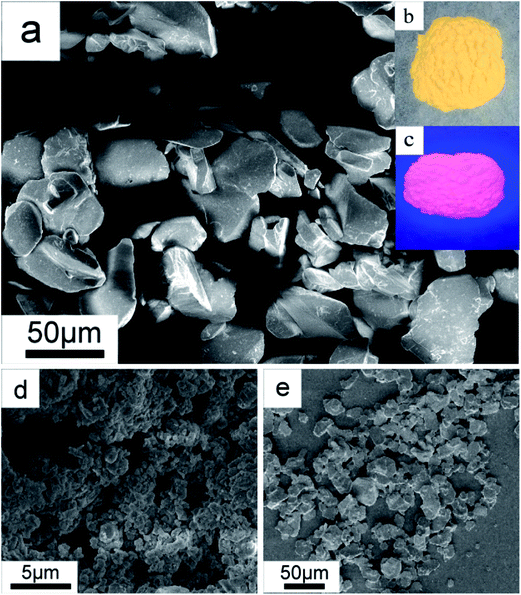 | ||
| Fig. 2 K2TiF6:Mn4+ red phosphor: (a) SEM image with typical photos illuminated under (b) natural and (c) 460 nm blue light. (d) and (e) are SEM images of Na2TiF6:Mn4+ and (c) Cs2TiF6:Mn4+ products. | ||
As it known, for a product prepared using this wet-chemical synthesis route, it is essential to investigate the influence of some general reaction conditions on the optical properties. Firstly, the influence of HAc concentration on the PL property of K2TiF6:Mn4+ phosphor was investigated and shown in Fig. S5.† Similar to the above result, all the K2TiF6:Mn4+ phosphors emit red light as well. Moreover, HAc concentration of 0 means the reaction solvent is deionized water, in which [MnF62−] may hydrolyze and produce impurities, leading to its poor emission intensity. Increasing HAc concentration from 0 to 2%, more and more H+ was produced to suppress the hydrolysis of [MnF62−] group. At 2%, the obtained K2TiF6:Mn4+ phosphor emits the brightest red light. Keeping the pace of addition, excessive HAc molecules in reaction solution resulted in the less generation of H+ and emission intensity reduction of K2TiF6:Mn4+ phosphor. The relationship between HAc volume and the relative integral emission intensity of K2TiF6:Mn4+ phosphor is illustrated in the inset of Fig. S5.†
Secondly, the effect of synthesis time on the PL properties of K2TiF6:Mn4+ red phosphor is investigated and the results are shown in Fig. 3. It is very clear that the shapes of these PL spectra are similar to above. As illustrated above, they are attributed to the spin-forbidden transition of Mn4+ from 2Eg to 4A2g. Secondly, the ZPL emission is hardly to be observed. This is exactly the same as that of Cs2TiF6:Mn4+, but completely different with that of Na2TiF6:Mn4+, in which ZPL emission is the main part (Fig. S6†).24 Moreover, it is obvious that the emission intensity can be enhanced by increasing the reaction time from 5 to 30 min, which may be resulted from the improved doping amount of Mn4+. Further prolongation of reaction time causes a downward trend of emission intensity. It is possible that too much Ti4+ ions have been substituted by Mn4+ ions, which resulting in the concentration quenching of Mn4+ in K2TiF6 host.25 The same quenching phenomenon also can be observed from the time-dependent PL spectra of Cs2TiF6:Mn4+ and Na2TiF6:Mn4+ phosphors (Fig. S6†). The relationship between reaction time and the relative integral emission intensity of K2TiF6:Mn4+ phosphor is presented in the inset figure of Fig. 3.
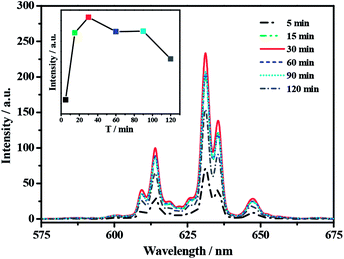 | ||
| Fig. 3 PL spectra for K2TiF6:Mn4+ products prepared with different reaction time (λex = 460 nm). The insert figure is the relationship between reaction time and relative integral emission intensity. | ||
Therefore, on the basis of the above discussion, we can conclude that HAc solution is an acceptable, safe using and environmental friendly reaction solvent for the ion exchange formation of K2TiF6:Mn4+ red phosphor. The corresponding optimum reaction conditions are: TMR is 20, 2% HAc solution, reacted at room temperature for only 30 min. Consequently, this optimized sample, in which the doping amount of Mn4+ is 2.84 mol%, was chosen for the following decay curve, thermal behavior, temperature-dependence and WLED performance investigations.
Fig. S7a† displays the PL decay curve of the emitting state 2Eg of Mn4+ in the optimum K2TiF6:Mn4+ phosphor examined at room temperature. Obviously, this curve is well fitted into a single-exponential function with lifetime τ value of 5.71 ms. Thermal stability of this sample was examined on a thermogravimetric (TG) instrument. The result is shown in Fig. S7b† and two valleys can be clearly observed. In the former valley, a weak endothermic peak with weight loss about 5% at a temperature below 100 °C can be found, which is mainly attributed to the adsorbed moisture. The mass of the sample begins to be lost at 385 °C accompanied with an endothermic peak, which indicates that the phosphor decomposes at temperatures higher than 385 °C. Thus, the sample is thermally stable under ambient atmosphere for WLED applications.
The influence of temperature on the PL properties of the optimum K2TiF6:Mn4+ red phosphor at 20–180 °C under 460 nm blue light excitation was investigated and the representative results are presented in Fig. 4. Apparently, it can be clearly observed that with the temperature rising from 40 to 180 °C, the emission intensity exhibits a lower tendency because of the increasing non-radiative transition processes. Furthermore, with the temperature increasing, not only emission spectrum gradually becomes broader, but also the main emission peak positions exhibit swiftly red-shift. This is due to the expansion of unit cell and the enhancement of vibration modes of [MnF6]2− octahedron in hot environment. This result is in agreement with the previous reports.26,27 Furthermore, the relationship between temperature and integral emission intensity is inserted in Fig. 4, which displays considerable stability for K2TiF6:Mn4+ phosphor with working temperature increases from 20 to 120 °C. When the temperature is 120 °C, nearly 117% of the integral emission intensity can be achieved, compared with that at 20 °C. Up to 140 °C, the relative integral intensity still preserve about 107%. This can be attributable to the integral anti-Stokes emission intensity increased with temperature, whereas the integral Stokes emission intensity remained basically unchanged.12
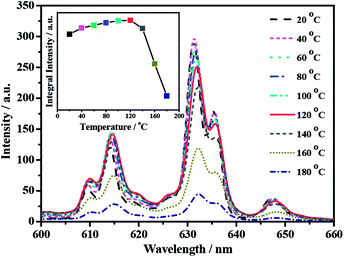 | ||
| Fig. 4 Temperature-dependent emission spectra of K2TiF6:Mn4+ phosphor and relative intensity of emission spectrum by integrating the spectral area (λex = 460 nm). | ||
As reported previously, the FWHM of the emission band for GaN chip in the blue-light region is about 20 nm, which is much narrower than that of the above K2TiF6:Mn4+ phosphor (∼68 nm).28 Additionally, they share the similar emission peak locations. This results in the K2TiF6:Mn4+ phosphor was chosen to cooperate with YAG yellow phosphor and GaN chip in a WLED device to possess warm white light. In this device, K2TiF6:Mn4+ and YAG phosphors can absorb the blue light emissions of GaN chip to illuminate bright red and yellow light respectively, in which the blue, yellow and red light can mix and possess warm white light to our eyes. Thus, from a practical point of view, it is necessary to investigate the optical performance of this WLED devices and the results were shown in Fig. 5, which is the electro-luminescent (EL) spectra of a series of LEDs fabricated by merging YAG, various amount of K2TiF6:Mn4+ and epoxy resin on blue GaN chips recorded at 20 mA drive current. Obviously, only with a single YAG component, the obtained white light exhibits weak emissions in the red region with high Tc (5139 K) and low Ra (71.8) with a super-excellent luminous efficiency (189.98 lm W−1). After the introduction of K2TiF6:Mn4+, obvious red light emission in the spectra can be observed. Increasing its addition amount from 0 to 25%, a noticeable stronger tone of the emitting red light can be observed. The chromaticity coordinates of these WLED devices are labeled in or close to the white light region in CIE 1931 color spaces as points of (a–f) in Fig. S9 in ESI.† Photographs of the lighting LEDs are shown in the insert image of Fig. 5. Their corresponding Tc, Ra and luminous efficiency data are compared listed in Table S1 in ESI.† The EL spectra reconfirm the sharp emission lines of K2TiF6:Mn4+ phosphor and more red components with lower CCTs. Furthermore, by adding K2TiF6:Mn4+ phosphor into the YAG powders with its addition amount from 0 to 25%, the Tc data dropped from 5139 to 2969 K and Ra improved from 71.8 to 94.1. In a word, the Ra and Tc of the warmest WLED are 94.1 and 2969 K whist keeping an excellent luminous efficiency of 156.04 lm W−1. Moreover, introducing Na2TiF6:Mn4+ or Cs2TiF6:Mn4+ into the YAG system, obvious improvements on Ra and CCT level also can be obtained (Fig. S8, Tables S2 and S3 in ESI†).
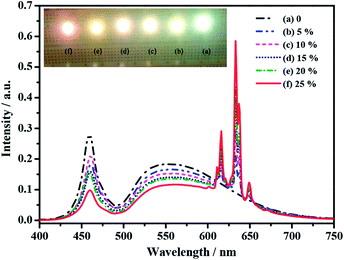 | ||
| Fig. 5 Electroluminescent (EL) spectra and photographs of six LED devices recorded at 20 mA drive current. | ||
4. Conclusions
In summary, we have developed a simplified and non-toxic ion exchange strategy for the formation of narrow-band red emitting A2TiF6:Mn4+ phosphors using HAc liquor as reaction solvent. The influence of synthesis conditions, including TMR, HAc concentration and reaction time on the PL properties of K2TiF6:Mn4+ product have been investigated in detail. Results show that the optimal TMR is 20, reacted in 2% HAc solution for 30 min, whist the optimal doping concentration of Mn4+ is 2.84 mol%. Because of these properties, by integrating these red phosphors with commercial YAG and commercial blue chip, we can observe warm white light with high CRI (Ra = 94.1), low CCT (Tc = 2969 K) and excellent luminous efficiency of 156.04 lm W−1 from WLED device working at 20 mA driven current and 5 V voltage.Acknowledgements
We are gratefully acknowledge the financial supports from the National Natural Science Foundation of China (51662039 and 21661033), the Applied Basic Research Project of Yunnan Province (2014FB147), Graduate Innovation Foundation of Yunnan Minzu University (2015YJCXY277), Program for Innovative Research Team (in Science and Technology) in University of Yunnan Province (2011UY09) and Yunnan Provincial Innovation Team (2011HC008).References
- S. Nakamura, Ann. Phys., 2015, 54, 7770 CAS.
- H. D. Nguyen, C. C. Lin and R. S. Liu, Angew. Chem., Int. Ed., 2015, 54, 10862 CrossRef CAS PubMed.
- W. T. Chen, H. S. Shen, R. S. Liu and J. P. Attfield, J. Am. Chem. Soc., 2012, 134, 8022 CrossRef CAS PubMed.
- E. H. Song, J. Q. Wang, S. Ye, X. F. Jiang, M. Y. Peng and Q. Y. Zhang, J. Mater. Chem. C, 2016, 4, 2480 RSC.
- Q. Zhou, Y. Y. Zhou, Y. Liu, L. J. Luo, Z. L. Wang, J. H. Peng, J. Yan and M. M. Wu, J. Mater. Chem. C, 2015, 3, 3055 RSC.
- C. C. Lin and R. S. Liu, J. Phys. Chem. Lett., 2011, 2, 1268 CrossRef CAS PubMed.
- L. L. Wei, C. C. Lin, Y. Y. Wang, M. H. Fang, H. Jiao and R. S. Liu, ACS Appl. Mater. Interfaces, 2015, 7, 10656 CAS.
- T. Takahashi and S. Adachi, J. Electrochem. Soc., 2008, 155, E183 CrossRef CAS.
- Y. K. Xu and S. Adachi, J. Electrochem. Soc., 2011, 158, J58 CrossRef CAS.
- J. H. Li, J. Yan, D. W. Wen, W. U. Khan, J. X. Shi, M. M. Wu, Q. Su and P. A. Tanner, J. Mater. Chem. C, 2016, 4, 8611 RSC.
- X. W. Zhang, Y. Li, C. X. Liao, Z. Chen and J. R. Qiu, Nanotechnology, 2017, 28, 025604 CrossRef PubMed.
- H. M. Zhu, C. C. Lin, W. Q. Luo, S. T. Shu, Z. G. Liu, Y. S. Liu, J. T. Kong, E. Ma, Y. G. Cao, R. S. Liu and X. Y. Chen, Nat. Commun., 2014, 5, 4312 CAS.
- L. F. Lv, Z. Chen, G. K. Liu, S. M. Huang and Y. X. Pan, J. Mater. Chem. C, 2015, 3, 1935 RSC.
- X. Y. Jiang, Z. Chen, S. M. Huang, J. G. Wang and Y. X. Pan, Dalton Trans., 2014, 43, 9414 RSC.
- F. Tang, Z. C. Su, H. G. Ye, M. Z. Wang, X. Lan, D. L. Phillips, Y. G. Cao and S. J. Xu, J. Mater. Chem. C, 2016, 4, 9561 RSC.
- Z. L. Wang, Y. Liu, Y. Y. Zhou, Q. Zhou, H. Y. Tan, Q. H. Zhang and J. H. Peng, RSC Adv., 2015, 5, 58136 RSC.
- Q. Zhou, Y. Y. Zhou, Y. Liu, Z. L. Wang, G. Chen, J. H. Peng, J. Yan and M. M. Wu, J. Mater. Chem. C, 2015, 3, 9615 RSC.
- L. F. Lv, X. Y. Jiang, S. M. Huang, X. A. Chen and Y. X. Pan, J. Mater. Chem. C, 2014, 2, 3879 RSC.
- H. Bode, H. Jenssen and F. Bandte, Angew. Chem., 1953, 65, 304 CrossRef CAS.
- L. Huang, Y. W. Zhu, X. J. Zhang, R. Zou, F. J. Pan, J. Wang and M. M. Wu, Chem. Mater., 2016, 28, 1495 CrossRef CAS.
- Y. W. Zhu, L. Huang, R. Zou, J. H. Zhang, J. B. Yu, M. M. Wu, J. Wang and Q. Su, J. Mater. Chem. C, 2016, 4, 5690 RSC.
- X. Q. Li, X. M. Su, P. Liu, J. Liu, Z. L. Yao, J. J. Chen, H. Yao, X. B. Yu and M. Zhan, CrystEngComm, 2015, 17, 930 RSC.
- J. H. Oh, H. Kang, Y. J. Eo, H. K. Park and Y. R. Do, J. Mater. Chem. C, 2015, 3, 607 RSC.
- T. Arai and S. Adachi, J. Appl. Phys., 2011, 110, 063514 CrossRef.
- C. X. Liao, R. P. Cao, Z. J. Ma, Y. Li, G. P. Dong, K. N. Sharafudeen and J. R. Qiu, J. Am. Ceram. Soc., 2013, 96, 3552 CrossRef CAS.
- L. L. Wei, C. C. Lin, M. H. Fang, M. G. Brik, S. F. Hu, H. Jiao and R. S. Liu, J. Mater. Chem. C, 2015, 3, 1655 RSC.
- M. Peng, X. Yin, P. A. Tanner, C. Liang, P. Li, Q. Zhang and J. Qiu, J. Am. Ceram. Soc., 2013, 96, 2870 CrossRef CAS.
- R. Kasa and S. Adachi, J. Appl. Phys., 2012, 112, 013506 CrossRef.
Footnote |
| † Electronic supplementary information (ESI) available: Details to the XRD patterns of K2TiF6:Mn4+ product prepared from different reaction medium, the DRS, EDS, decay and TG results of the optimum K2TiF6:Mn4+, PL properties of Cs2TiF6:Mn4+ and Na2TiF6:Mn4+, WLED performance and corresponding CIE chromaticity diagram data. See DOI: 10.1039/c7ra04369d |
| This journal is © The Royal Society of Chemistry 2017 |

