
 Open Access Article
 This Open Access Article is licensed under a
 Creative Commons Attribution 3.0 Unported Licence
Synthesis and characterization of Al-substituted LiNi0.5Co0.2Mn0.3O2 cathode materials by a modified co-precipitation method
Xinxin Zhaoabc,
Guangchuan Liang *abc and
Dan Linabc
*abc and
Dan Linabc
aInstitute of Power Source and Ecomaterials Science, Hebei University of Technology, Tianjin 300130, China
bKey Laboratory of Special Functional Materials for Ecological Environment and Information, Hebei University of Technology, Ministry of Education, Tianjin 300130, China
cKey Laboratory for New Type of Functional Materials in Hebei Province, Hebei University of Technology, Tianjin 300130, China
First published on 31st July 2017
Abstract
An Al-substituted LiNi0.5Co0.2Mn0.3O2 (Al-NCM) cathode material was synthesized by a modified co-precipitation method followed by heat treatment process. The obtained materials were extensively characterized by X-ray diffraction (XRD), scanning electron microscopy (SEM), galvanostatic charge/discharge tests, cyclic voltammetry (CV) and electrochemical impedance spectroscopy (EIS). The results indicated that the as-prepared Al-NCM sample exhibited a well hexagonal α-NaFeO2 structure, lower cation mixing, higher crystallinity, a more homogeneous spherical structure, lower charge transfer resistance and a higher lithium ion diffusion coefficient, thus leading to enhanced electrochemical performance. The effects of Al substitution on rate capability, cycling stability and low-temperature performance of LiNi0.5Co0.2Mn0.3O2 (NCM) were evaluated by coin cells and 14500 full batteries. Specifically, the Al-NCM sample delivered discharge specific capacities of 159.7, 147.4, 139.8, 135.7, 126.9 and 111.3 mA h g−1 at 0.5C, 1C, 2C, 3C, 5C, and 10C rates, respectively, with capacity retention ratio of 86.6% after 100 cycles at 1C rate under the voltage range of 3.0–4.3 V. The 14500 battery utilizing Al-NCM material as the cathode delivered a discharge capacity of 803.55 mA h at 1C rate in the potential range of 2.7–4.2 V, with capacity retention of 89.30% after 200 cycles. Moreover, the 14500 battery fabricated with Al-NCM as the cathode delivered a discharge capacity of 590.06 mA h at 1C rate at −20 °C, much higher than 471.30 mA h of the battery assembled with NCM as the cathode.
Introduction
On account of high energy and power density, lithium ion batteries have been widely utilized as the most attractive power source for portable electronic products, electronic vehicles and energy storage.1–4 To satisfy the demand of increased capacity and energy densities for lithium ion batteries, three-component layered LiNixCoyMn1−x−yO2 positive electrode materials have become one of the most promising cathode candidates due to their relatively high energy density and capacity, low cost and low toxicity.5–7 Among the series of LiNixCoyMn1−x−yO2, the Ni-rich compound LiNi0.5Co0.2Mn0.3O2 has drawn much attention because of its good comprehensive properties.8 However, the poor rate capability, the inferior cycle performance and the poor low-temperature performance of LiNi0.5Co0.2Mn0.3O2 cathode materials caused by severe cation mixing between Li+ and Ni2+, instability of the structure during cycling process and low lithium ion diffusion coefficient largely limited its further applications.9–12Many strategies including ion doping and surface modification were extensively investigated to overcome the above issues. Among them, doping method has attracted more attention due to the effectiveness of dopants in stabilizing the structure of materials (even little amounts) induced to enhancement of the electrochemical performance and the thermal stability. Numerous dopant ions, such as Na+, Ce4+, Zr4+, Ti4+, Al3+, Mg2+, Nb5+ and Eu3+ have been introduced to improve the stability of cathode materials, to enhance the rate capability and cycling performance.13–20 The safety and energy density of the Al substituted LiNi1/3Co1/3−zAlzMn1/3O2 materials was improved due to the stabilized structure and the reduced cation mixing.17 Generally speaking, the crystallinity, the particle morphology and the grain size of materials are dependent on the synthesis method, which have an important influence on their electrochemical properties.21–23 Therefore, the synthesis method is important to prepare excellent LiNixCoyMn1−x−yO2 materials, also important to the method of doping.
Heteroatoms doping cathode materials usually prepared by the traditional solid state method, which might be result in an inhomogeneous structure or impure phase. To avoid these disadvantages, some soft-chemistry method including co-precipitation,17 sol–gel method24 and hydrothermal process25 have been developed. Whereas for to satisfy the demands of industrial production and cost saving, the process based on co-precipitation method is desirable. In the present paper, a modified co-precipitation process was proposed to prepare the Al-substituted transition metal hydroxide precursor which was subjected to the post-heat treatment to obtain the final products. In particular, Al(OH)3 was first formed, and then act as crystal nuclei of the following co-precipitation process, thus leading to a highly crystalline and homogeneous structure. The as-prepared materials were characterized, the influence of aluminium on the structure, morphology, lithium ion kinetics and electrochemical performances were intensively studied and its processability was investigated via 14500 full batteries. The results indicate that Al-NCM sample exhibited well structure and good processability, the electrochemical properties (including rate capability, cycling stability and low-temperature performance) are significantly improved. Our research may provide a strategy based on co-precipitation method for the design of ion-doping cathode materials, which could be useful for industrial production.
Experimental
Preparation of the samples
The Al substituted LiNi0.5Co0.2Mn0.3O2 was prepared via a modified co-precipitation method followed by a heat treatment. First, a 2 M sulfate solution was prepared by dissolving the stoichiometric (cationic molar ratio of 5![[thin space (1/6-em)]](https://www.rsc.org/images/entities/char_2009.gif) :1.5:3) three sulfates (NiSO4·H2O, CoSO4·H2O, MnSO4·H2O) into amount of distilled water (label as solution 1). Second, corresponding proportion Al2(SO4)3·18H2O (cationic molar ratio of 0.05) was dissolute into distilled water, following part of the 4 M NaOH solution was dropped into the solution to form suspension, and then desired amount of NH4OH solution was dropped into the suspension, which was labeled as solution 2. Third, the solution 2 was pumped into a continuous stir tank reactor under the N2 atmosphere, and then the solution 1 and NaOH solution was dropped into solution 2 simultaneously. The reaction was performed 10 h with the temperature was maintained at 60 °C and the pH value was controlled at 11.0. Subsequently the co-precipitated precursor powder was filtered, washed and dried at 110 °C. The obtained precursor was mixed with 5 wt% excess of Li2CO3 by ball milling. The mixture was then preheated at 500 °C for 4 h and calcined at 850 °C for 12 h. The obtained product was marked as Al-NCM.
:1.5:3) three sulfates (NiSO4·H2O, CoSO4·H2O, MnSO4·H2O) into amount of distilled water (label as solution 1). Second, corresponding proportion Al2(SO4)3·18H2O (cationic molar ratio of 0.05) was dissolute into distilled water, following part of the 4 M NaOH solution was dropped into the solution to form suspension, and then desired amount of NH4OH solution was dropped into the suspension, which was labeled as solution 2. Third, the solution 2 was pumped into a continuous stir tank reactor under the N2 atmosphere, and then the solution 1 and NaOH solution was dropped into solution 2 simultaneously. The reaction was performed 10 h with the temperature was maintained at 60 °C and the pH value was controlled at 11.0. Subsequently the co-precipitated precursor powder was filtered, washed and dried at 110 °C. The obtained precursor was mixed with 5 wt% excess of Li2CO3 by ball milling. The mixture was then preheated at 500 °C for 4 h and calcined at 850 °C for 12 h. The obtained product was marked as Al-NCM.
For comparison, the LiNi0.5Co0.2Mn0.3O2 sample was prepared by the same process above in which the second process were removed. The obtained sample was flagged as NCM.
Characterization and electrochemical measurements
The crystal structure of the samples was identified by X-ray diffraction (XRD, D/max-2500, PHILIPS, Holland) with Cu Kα radiation source (λ = 0.15406 nm). The XRD patterns were acquired in the 2θ range of 10–80° at a scanning rate of 8° min−1. The particle morphology was observed by scanning electron microscopy (SEM, PHILIPS XL30). The particle size distribution was measured by the Laser Particle Sizer (LS800).The electrochemical performances of Al-NCM and NCM samples were measured by CR2430 coin cells. The cells were assembled in an argon-filled glove box utilizing as-prepared materials as the positive electrode, lithium foil as the counter electrode, Celgard 2400 as the separator, and 1 M lithium hexafluorophosphate (LiPF6) dissolved in the solvents of dimethyl carbonate (DMC) and ethylene carbonate (EC) (1:1 v/v) as the electrolyte. The positive films were prepared by mixing 80 wt% active materials, 15 wt% acetylene black and 5 wt% polytetrafluoroethylene (PTFE). The film was dried at 120 °C for 30 min and then was cut into disk with diameter of 12 mm.
The electrochemical performances of the Al-NCM and NCM were further confirmed by 14500 full batteries. The fabrication of the full Li-ion battery contains various steps including positive/negative pole piece preparation, welding the tabs, winding process, adding the electrolyte, and packing. The positive electrode with an active mass loading of ∼420 g m−2 was prepared by coating a N-methyl-2-pyrrolidone (NMP)-based slurry containing NCM/Al-NCM, polyvinylidene fluoride (PVDF) and super-P carbon and KS-6 (95:2:1.5:1.5 by weight) onto aluminium foil. The negative electrode with the double surface density of ∼210 g m−2 was prepared by coating a water-based slurry of graphite, carboxyl methyl cellulose (CMC), super-P carbon and styrene butadiene rubber (SBR) (95:1.5:1:2.5 by weight) onto copper foil. The positive and the negative electrodes were dried at 120 °C for 12 h in a vacuum oven. And the 14500 batteries were assembled by the winding machine with Celgard 2400 as the separator, following the batteries were packaged by aluminium film. The actual capacity of the battery was approximately 800 mA h with a 1.05 capacity ratio of the negative electrode to the positive electrode.
The fabricated coin cells were first galvanostatic charged to 4.3 V and subsequently discharged to 3.0 V at a current density of 0.5C (1C = 200 mA g−1) at room temperature. The rate capability tests were performed at different current densities of 0.5–10C rates and the cycling performance was tested at 1C rate between 3.0 and 4.3 V. The electrochemical properties of 14500 cells were executed under the potential range of 2.7–4.2 V at 1C rate. The low temperature performance of the Al-NCM and NCM samples were measured at a high–low temperature box (YSGDW-150, Shanghai, China). After the first two galvanostatic charge/discharge cycles at 25 °C, the cell was full charged at 1C rate, then the batteries were placed to the high–low temperature box for 10 h at −20 °C, subsequently discharged at 1C rate.
Electrochemical impedance spectroscopy (EIS) measurements were executed after 3 cycles by an electrochemical workstation (CH Instruments, Inc., Shanghai, China) in the frequency range of 105 to 10−2 Hz with an amplitude voltage of 5 mV. The cyclic voltammograms (CV) tests were operated at 0.1 mV s−1 between 2.5 and 4.5 V using the electrochemical workstation.
Results and discussions
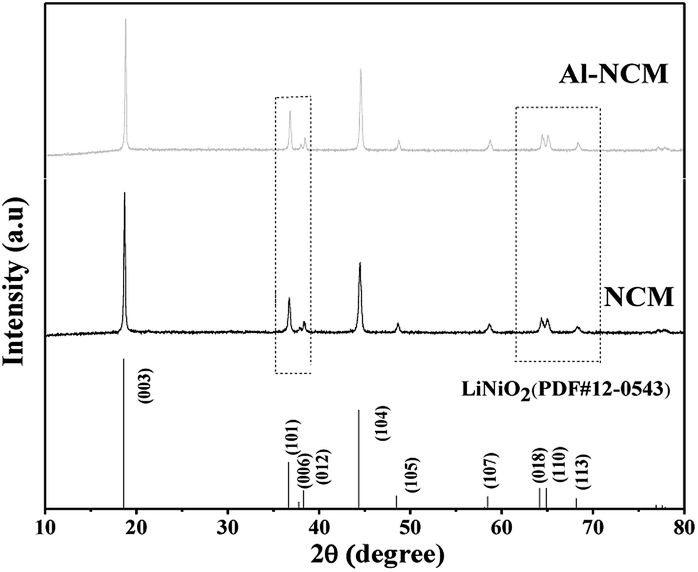
The crystal structures of the Al-NCM and NCM sample were analysed by XRD, as presented in Fig. 1. All diffraction peaks can indexed to a layered hexagonal α-NaFeO2 structure with R![[3 with combining macron]](https://www.rsc.org/images/entities/char_0033_0304.gif) m space group, whereas no impurity peak was detected, indicating that Al3+ ions were successfully incorporated into the crystal of the NCM. The slight peak shifts (the inset in Fig. 1) implied that the crystal structure has been little changed after Al substituted for parts of Co. The more obvious distinct splitting of (006)/(102) and (108)/(110) peaks of the Al-NCM manifested that the Al-NCM sample exhibited highly crystallite, this may be due to the formation of Al(OH)3 before the precipitation of metal ions, which play the role of the crystal nucleus in the process of co-precipitation, induced to the improvement of crystalline.
m space group, whereas no impurity peak was detected, indicating that Al3+ ions were successfully incorporated into the crystal of the NCM. The slight peak shifts (the inset in Fig. 1) implied that the crystal structure has been little changed after Al substituted for parts of Co. The more obvious distinct splitting of (006)/(102) and (108)/(110) peaks of the Al-NCM manifested that the Al-NCM sample exhibited highly crystallite, this may be due to the formation of Al(OH)3 before the precipitation of metal ions, which play the role of the crystal nucleus in the process of co-precipitation, induced to the improvement of crystalline.
 | ||
| Fig. 1 XRD patterns of the NCM and Al-NCM samples. | ||
The lattice parameters were listed in Table 1. The lattice parameters, a, c and V of Al-NCM were smaller than NCM, this might be attributed to the smaller size of Al3+ (rAl3+ = 0.053 nm) than that of Co3+ (rCo3+ = 0.054 nm). Generally, the c/a value can be associated with the degree of trigonal distortion: a high c/a value is preferred for well-ordered hexagonal α-NaFeO2 structure.26 The Al-NCM exhibited higher c/a value, indicated that the Al-NCM has better layered structure than Al-NCM. The ratio of I(003)/I(104) is regarded as an evaluation of the cation mixing in the layered structure. With the degree of cation mixing increased, the ratio of I(003)/I(104) is decreased. The higher value of I(003)/I(104) of Al-NCM (1.9217) indicated that the Al substitution reduced the degree of cation mixing. Therefore, the substitution of Co3+ by Al3+ resulted in a better ordered layered structure and a lower cation mixing degree in Al-NCM. Additionally, the bond dissociation energy of Al–O (512 kJ mol−1) is stronger than that of Co–O (368 kJ mol−1), thus introduction of Al3+ in the host structure could improve the structural stability.
| Sample | a (Å) | c (Å) | c/a | I003/I104 | V (Å3) |
|---|---|---|---|---|---|
| NCM | 2.8680 | 14.2376 | 4.9643 | 1.4526 | 101.42 |
| Al-NCM | 2.8619 | 14.2043 | 4.9667 | 1.9217 | 100.75 |
To further investigate the effect of Al-substitution on the lattice parameters of NCM materials, the patterns of the both samples were analyzed by Rietveld refinement utilizing RIETAN-2000 soft, the results are presented in Fig. 2 and Table 2. It is assumed that lithium ions, transition metal ions, aluminum ions and oxygen ions are located at 3a sites (0, 0, 0), 3b sites (0, 0, 0.5) and 6c sites (0, 0, 0.2411), respectively. The cation mixing exists due to the similar radius of Ni2+ and Li+. According to the value of Rwp and S (Rwp < 10, S < 1.5), the results of refinement are reliable. As a result, the lattice parameters a and c of Al-NCM are smaller than NCM, and the cation mixing degree is reduced by aluminum substitution. Moreover, the thickness of inter-slab space (lithium slab) I(LiO2) and the thickness of slab space (transition metal slab) S(MO2) are obtained from Rietveld analysis,27 and the results are listed in Table 2. Obviously, the lithium slab thickness and the transition metal slab thickness are shown little decrease after aluminium substitution, which might be attributed to the smaller radius of Al3+ and the larger bonding energy of Al–O.
 | ||
| Fig. 2 Rietveld refinement of the NCM (a) and Al-NCM (b) samples. | ||
| Sample | a (Å) | c (Å) | Li/Ni disorder (%) | I(LiO2) (Å) | S(MO2) (Å) | Rwp | S |
|---|---|---|---|---|---|---|---|
| NCM | 2.860 | 14.227 | 5.23 | 2.624 | 2.118 | 8.87 | 1.42 |
| Al-NCM | 2.851 | 14.204 | 2.68 | 2.620 | 2.115 | 6.69 | 1.39 |
The morphology of the Al-NCM and NCM samples are displayed in Fig. 3. It can be observed that both the two materials consist of sphere-like particles with a homogeneous distribution and an average particle size of around 7 μm. However, the morphology of Al-NCM samples was more uniform and smooth. This might be attributed to the form of Al(OH)3 particles, which resulted in the integrity of the precipitation.
 | ||
| Fig. 3 SEM images of the NCM and Al-NCM samples. | ||
The particle size distribution curves of two samples are presented in Fig. 4 and the particle size parameters are listed in Table 3. It can be seen from Fig. 4 that the curve of the Al-NCM sample is sharper and narrower, indicated that the sample had relatively uniform particle size distribution, which is beneficial for the fabrication ability of the materials. In contrast, NCM sample shows a broader size distribution curve, implied a non-uniform particle size distribution. The test results are in good agreement with the SEM images (Fig. 3). The larger particle size obtained from the particle size analysis compared to the SEM analysis may be due to the aggregation of the particles. Together with the results of XRD and SEM, it can be concluded that the morphology of NCM is maintained while its structure becomes more complete with the insertion of Al3+ ions. According to the relationship between structure and performances, the improved electrochemical properties such as high rate capacity and cycling property could be predicted.
 | ||
| Fig. 4 Particle size distribution curves of NCM and Al-NCM samples. | ||
| Sample | D10 (μm) | D50 (μm) | D90 (μm) | (D90 − D10)/D50 |
|---|---|---|---|---|
| NCM | 4.03 | 10.28 | 18.80 | 1.44 |
| Al-NCM | 4.42 | 11.22 | 16.74 | 1.10 |
To evaluate the effect of Al substitution on the electrochemical performances, the electrodes of all samples were carried out charge–discharge tests by coin cells under 0.5–10C rates in the voltage range of 3.0–4.3 V at room temperature. Fig. 5a shows the first charge/discharge curves of the Al-NCM and NCM sample at 0.5C rate. The first discharge capacity of Al-NCM was 159.7 mA h g−1, slightly lower than the value for NCM (164.2 mA h g−1). Whereas, the coulombic efficiency of Al-NCM was 88.5%, slightly higher than the value for NCM (86.2%). The slightly reduced initial discharge capacity of Al-NCM samples may be ascribed to lower amount of Co3+, and the slightly improved coulombic efficiency of Al-NCM may be attributed to the increase of reversibility.
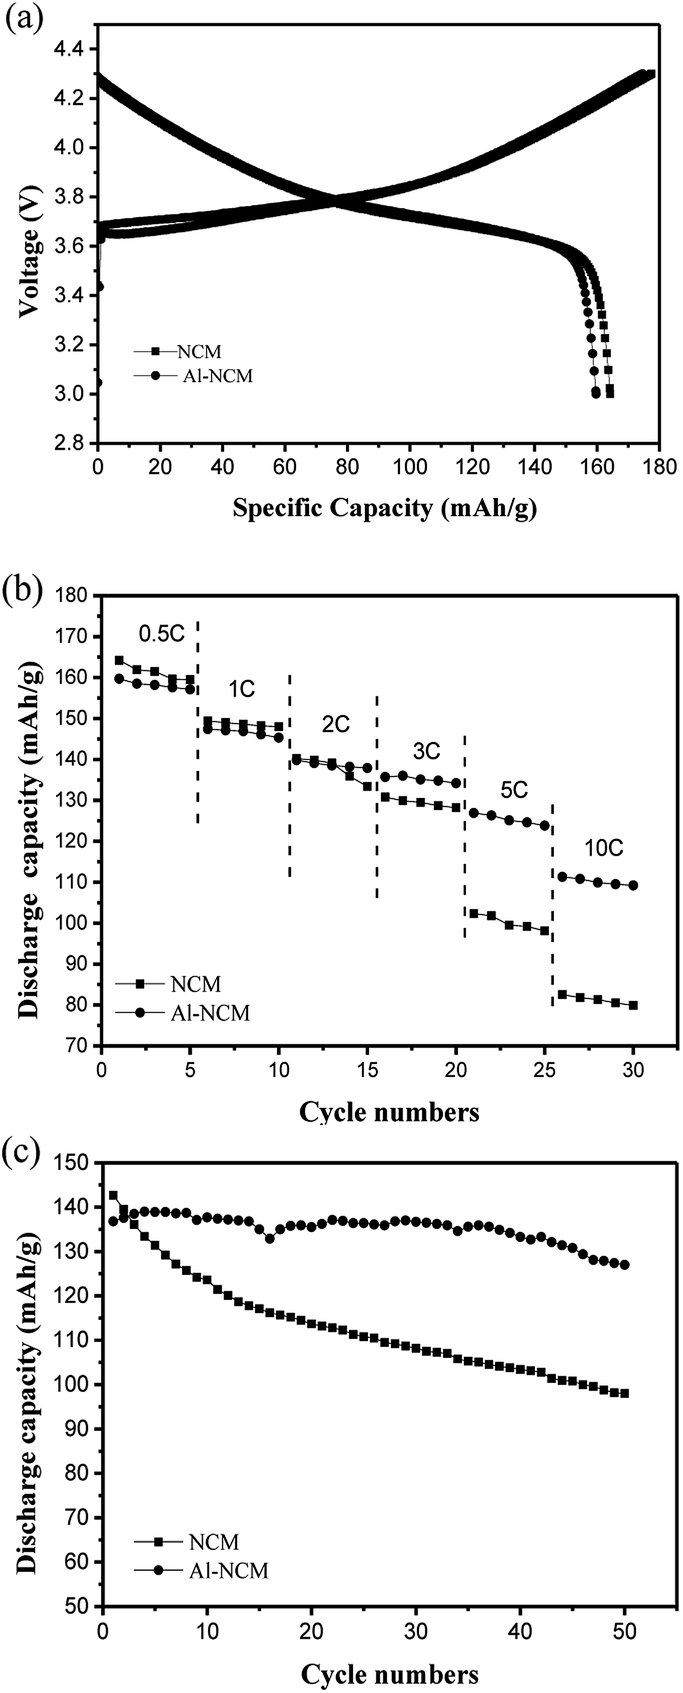 | ||
| Fig. 5 (a) Initial charge–discharge curves at 0.5C rate; (b) discharge capacity curves at different rates; (c) cycling performance curves at 1C rate of NCM and Al-NCM samples. | ||
The rate capability of Al-NCM and NCM cathodes were measured at various current densities and the results are presented in Fig. 5b. It is obvious that the discharge capacity of the two samples decreases with increasing C-rate due to a polarization effect. It is clearly observed that capacity of the NCM is higher than that of Al-NCM at 0.5C, 1C and 2C discharge rates. As the current increases, the capacity of Al-NCM exceeds that of NCM, implying that Al-NCM exhibited superior high rate performance, which delivered discharge capacities of 126.9 mA h g−1 and 111.3 mA h g−1 at 5C and 10C rate, respectively.
The effect of Al substitution on the cycling performance was carried out between 3.0 V and 4.3 V at 1C rate by the galvanostatic charge–discharge cycling tests. As presented in Fig. 5c, the NCM samples delivered the higher initial discharge capacity, whereas only remains 78.6 mA h g−1 with capacity retention of 54.96% after 100 cycles. In contrast, though the Al-NCM cathode exhibited lower initial discharge capacity, the capacity retention is as high as 86.56% after 100 cycles. Thus, the cyclability of NCM materials was improved by aluminium substitution, which could be related to the aluminium substituted ions located at cobalt metal layer can prevent the bulk structure collapse during cycling process.
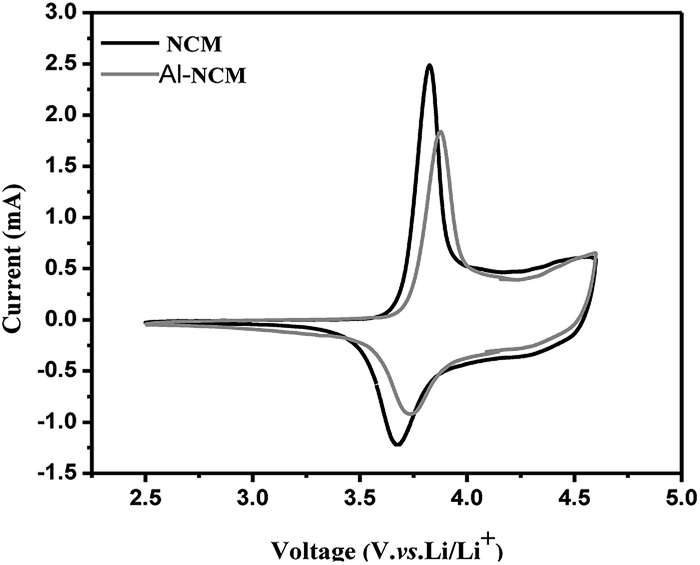
Fig. 6 shows the cyclic voltammograms of the two samples at a range of 2.5–4.5 V with a scan rate of 0.1 mV s−1. In general, the peaks in the CV curve corresponding to the lithium insertion and extraction process. Only one redox couple can be observed for both materials from Fig. 6, demonstrating that no phase transition exist from hexagonal to monoclinic during the extraction/insertion of lithium ions. It is well known that the potential difference (ΔΦ) between the oxide peak (Φox) and reduction peak (Φred) represents the electrochemical reversibility. As shown in Table 4, the Φox and Φred of Al-NCM sample are higher than NCM, while the ΔΦ is lower than NCM sample, which implies that the Al substitution is in favour of reducing the electrochemical polarization and improving the electrochemical performance.
 | ||
| Fig. 6 Cyclic voltammetry curves of the NCM and Al-NCM samples. | ||
| Sample | Φox (V) | Φred (V) | ΔΦ (V) |
|---|---|---|---|
| NCM | 3.825 | 3.667 | 0.158 |
| Al-NCM | 3.875 | 3.743 | 0.132 |
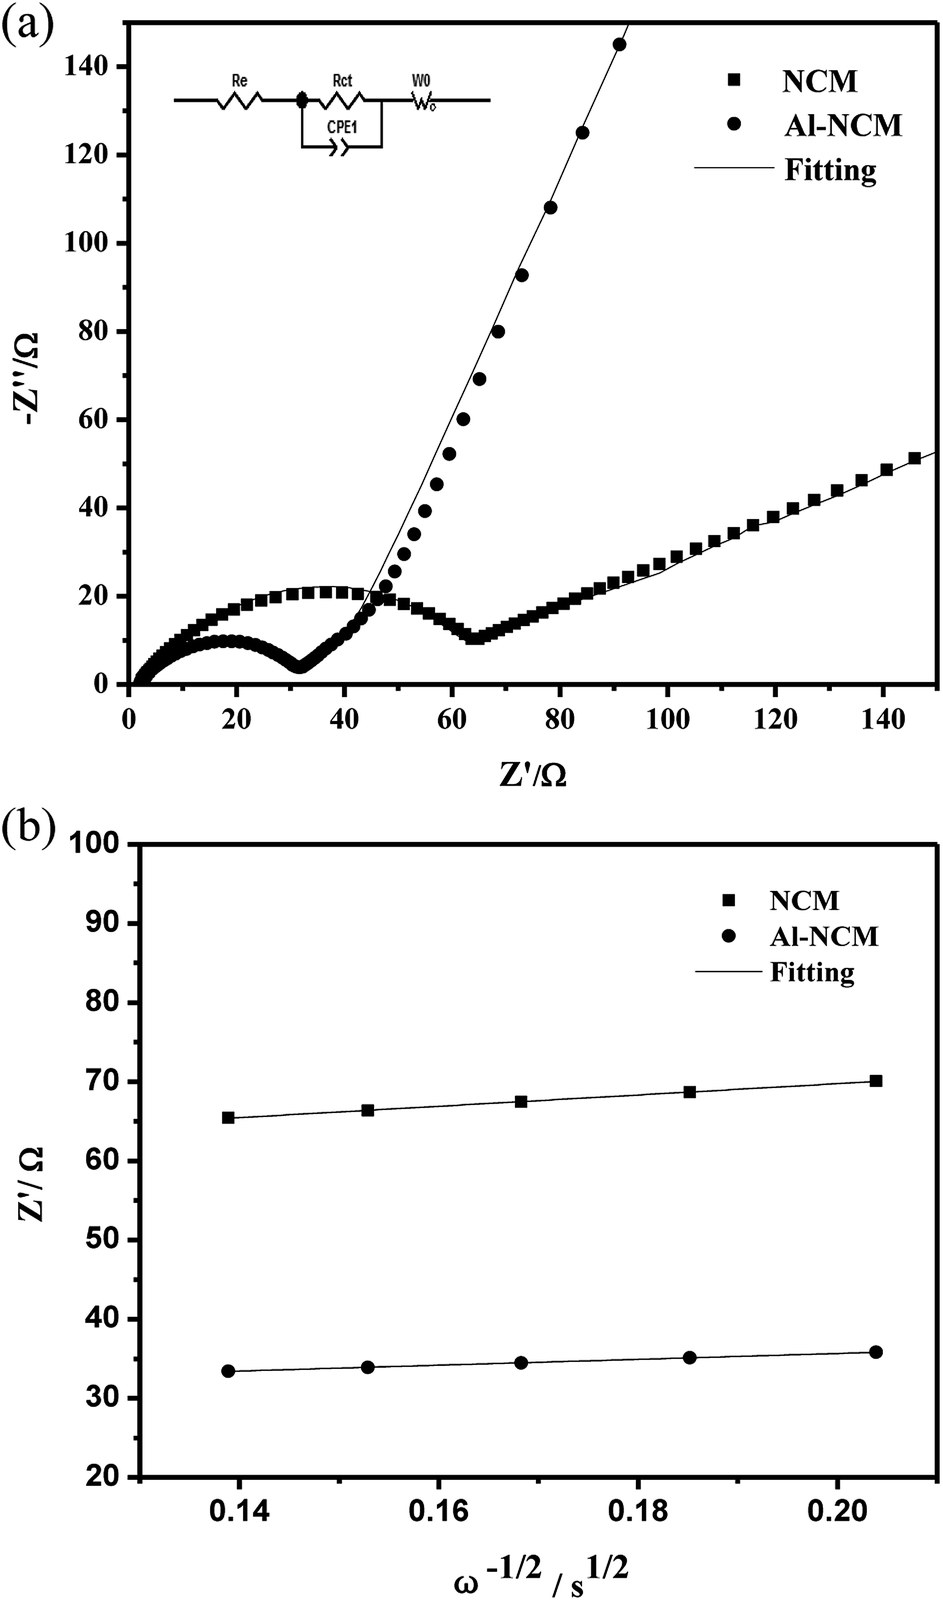
The electrochemical impedance spectroscopy (EIS) measurements of the two samples after 50 cycles in a charge state of 4.3 V was performed to study the electrode kinetics of materials. Nyquist curves of the Al-NCM and NCM materials are displayed in Fig. 7. All Nyquist plots consist of a semicircle in the high frequency region and an oblique line in the low frequency region. In generally, the intercept in Z′-axis at the Nyquist curve represents the ohmic resistance (Rs), whereas the semicircle at high frequency reflect the charge transfer resistance and capacitance in the electrochemical reaction (Rct), the oblique line at low frequency reflects the lithium ion diffusion between the particles, namely, Warburg impedance (Wo).28 On the basis of the equivalent circuit (inset, Fig. 7a), the simulated results are shown in Table 5. The Rct of the NCM sample is 69.62 Ω after 50 cycles, while the Al-NCM sample shown lower Rct of 31.62 Ω, suggesting that the Al-NCM own a higher lithium ion conductivity than the NCM sample. The lithium ion diffusion coefficient can be calculated with eqn (1) and (2):
 | (1) |
| Z′ = Re + Rct + σω−1/2 | (2) |
 | ||
| Fig. 7 Electrochemical impedance measurements of NCM and Al-NCM cathode materials (a) Nyquist plots and fitting-figures of both samples, (b) graphs of Z′ plotted against ω−1/2 for both samples. | ||
| Sample | Rct (Ω) | σw (Ω s−0.5) | D (cm2 s−1) |
|---|---|---|---|
| NCM | 69.62 | 71.44817 | 4.93921 × 10⁻¹² |
| Al-NCM | 31.62 | 37.00517 | 2.57208 × 10⁻¹¹ |
Usually, the D is known as an intrinsic property for a given positive electrode, which depends only on the structure of active material in the charge state. As shown in Table 5, the D of the Al-NCM is twenty times larger than that of NCM, indicating that the Al-NCM can offer more transport paths of the lithium ion to the ionic transport in the intercalation and deintercalation reaction at large charge and discharge current.
The 14500 batteries were assembled with Al-NCM and NCM as cathodes, to identify the processability of materials and to verify the effect of Al substitution on the electrochemical performances. Fig. 8a presented the discharge capacity curves of 14500 batteries at 1C rate, under potential range of 2.7–4.2 V, delivers discharge capacity of 803.55 mA h and 819.34 mA h for the Al-NCM and NCM, respectively. The cycling performances of the 14500 batteries with the Al-NCM and NCM as cathode at 25 °C at 1C current density are illustrated in Fig. 8b. It can be calculated that the capacity retention of battery with Al-NCM as positive maintains 89.3% after 200 cycles, higher than that value of battery with NCM as cathode. These results were in keeping with the results of coin cells, further verifying that the materials of Al substitution part of Co synthesized by the modified co-precipitation method can improve the rate capability and cycling performance of the LiNi0.5Co0.2Mn0.3O2 cathode materials.
 | ||
| Fig. 8 (a) Charge–discharge curves of the 14500 batteries with NCM and Al-NCM as cathode at 1C rate; (b) cycling performance curves of the 14500 batteries with NCM and Al-NCM as cathode at 1C/1C at room temperature; (c) discharge curves of the 14500 batteries with NCM and Al-NCM as cathode at 1C at −20 °C. | ||
As we all know, good low-temperature performance is desirable for expand the range of applications of the LiNi0.5Co0.2Mn0.3O2 materials. The impact of Al substitution on the low-temperature performance was investigated by 14500 batteries. Fig. 8c presented the discharge curves of the 14500 batteries with Al-NCM and NCM as cathodes at −20 °C at 1C rate. The battery with Al-NCM as cathode exhibited a higher discharge capacity of 590.1 mA h, which is 73.5% of the same discharge rate at 25 °C, whereas the discharge capacity of the battery with NCM as cathode is 471.3 mA h, which is 57.5% of the same discharge rate at 25 °C. The result demonstrated that the 14500 battery with Al-NCM as cathode exhibited excellent low-temperature performance. In other words, the Al substitution can improve the low-temperature performance of LiNi0.5Co0.2Mn0.3O2, which may be attributed to the higher lithium ion diffusion coefficient, lower cation mixing and reduced charge transfer resistance.
To explore the major reasons for the positive effect of Al substitution on the low temperature performance of NCM. EIS is carried out at 25, 0, −10 and −20 °C, respectively. The 14500 batteries were measured at the fully discharged state after one cycle (1C/1C) between 2.7–4.2 V at different temperatures. As shown in Fig. 9, each of Nyquist plots consist of a small semicircle in the high frequency region, a large middle-frequency semicircle and an oblique line in the low frequency region. In generally, the intercept in Z′-axis at the Nyquist curve represents the ohmic resistance (Rs), the small circle at high frequency can be attributed to the resistance of lithium ion migration through the solid electrolyte interface film (RSEI), whereas the larger semicircle at high frequency reflect the charge transfer resistance and capacitance in the electrochemical reaction (Rct), the oblique line at low frequency reflects the lithium ion diffusion between the particles, namely, Warburg impedance (Wo). On the basis of the equivalent circuit (inset, Fig. 9), the fitting results are shown in Table 6.
 | ||
| Fig. 9 Nyquist plots of the NCM (a) and Al-NCM (b) electrodes at different temperature; the variation in the logarithm of Rct as a function of T−1 (c). | ||
| Sample | NCM | Al-NCM | ||||
|---|---|---|---|---|---|---|
| Rs/mΩ | RSEI/mΩ | Rct/mΩ | Rs/mΩ | RSEI/mΩ | Rct/mΩ | |
| 25 °C | 47.3 | 4.8 | 27.2 | 37.6 | 49.2 | 25.1 |
| 0 °C | 53.6 | 93.8 | 264.2 | 37.7 | 50.5 | 196.3 |
| −10 °C | 261.2 | 226.0 | 937.7 | 259.3 | 280.3 | 550.4 |
| −20 °C | 279.3 | 300.0 | 2842.0 | 267.7 | 291.1 | 1360.2 |
As shown in Table 6, Rs, RSEI and Rct are increased when temperature is decreased from 25 to −20 °C. Rs and RSEI increased slightly with the temperature decrease and the values of NCM and Al-NCM displayed little differences, whereas Rct increased significantly as temperature is decreased and the values of Al-NCM are smaller than that of NCM, indicating that the charge transfer reaction has important effect on the low temperature performance of NCM. The activation energy for transport can be calculated via the eqn (3):29
 | (3) |
The relationship between lnRct and 1/T is linear, and the activation energy for transport can be obtained from the slope of the fitting line (Fig. 9c). The activation energy for transport of NCM is 73.59 kJ mol−1, which decreased to 64.46 kJ mol−1 after Al substituted. According to Arrhenius equation, the lower activation energy a reaction has, the less sensitively it is influenced by temperature, which also illustrated why the Al-NCM material exhibited excellent low-temperature performance.
Conclusion
The layered Al-NCM cathode material for lithium ion battery has been synthesized by a modified co-precipitation method followed by post-heat treatment. For comparison, the NCM sample was also prepared by traditional co-precipitation method followed by post-heat treatment. The electrochemical results of both coin cells and 14500 batteries are displayed that the electrochemical performances including high rate capability, cycling stability and low-temperature performance of LiNi0.5Co0.2Mn0.3O2 materials were enhanced by aluminum substitution. The Al-NCM samples exhibited a discharge specific capacity of 111.3 mA h g−1 at 10C current density under the voltage range of 3.0–4.3 V, with capacity retention of 86.6% after 100 cycles at 1C rate. The 14500 battery with Al-NCM as the cathode exhibits a discharge capacity of 803.55 mA h at 1C rate in the potential range of 2.7–4.2 V, with a capacity retention of 89.3% after 200 cycles. Moreover, the 14500 battery exhibited better low-temperature performance with discharge capacity of 590.06 mA h at 1C rate at −20 °C. On account of the analysis of XRD, SEM, CV and EIS, the superior electrochemical performance could be attributed to the lower degree of the cation mixing, the higher crystalline, the more homogenous particle size distribution, the lower charge transfer resistance and the higher lithium ion diffusion coefficient.References
- J.-M. Tarascon and M. Armand, Nature, 2001, 414, 359 CrossRef CAS PubMed.
- M. Armand and J.-M. Tarascon, Nature, 2008, 451, 652 CrossRef CAS PubMed.
- P.-G. Bruce, B. Scrosati and J.-M. Tarascon, Angew. Chem., Int. Ed., 2008, 47, 2930 CrossRef CAS PubMed.
- J.-B. Goodenough and Y. Kim, Chem. Mater., 2010, 22, 587 CrossRef CAS.
- Y.-K. Sun, S.-T. Myung, M.-H. Kim, J. Prakash and K. Amine, J. Am. Chem. Soc., 2005, 127, 13411 CrossRef CAS PubMed.
- H.-J. Noh, S. Youn, C.-S. Yoon and Y.-K. Sun, J. Power Sources, 2013, 233, 121 CrossRef CAS.
- K.-M. Shaju and P.-G. Bruce, Adv. Mater., 2006, 18, 2330 CrossRef CAS.
- L. Wang, J. Li, X. He, W. Pu, C. Wan and C. Jiang, J. Solid State Electrochem., 2009, 13, 1157 CrossRef CAS.
- S.-S. Zhang, K. Xu and T.-R. Jow, J. Power Sources, 2003, 115, 137 CrossRef CAS.
- G. Zhao, K. Wen, W. Lv, X. Zhou, Y. Liang, F. Yang, Z. Chen and M. Zou, J. Power Sources, 2015, 300, 29 CrossRef.
- F. Wu, J. Tian, Y. Su, Y. Guan, Y. Jin, Z. Wang, T. He, L. Bao and S. Chen, J. Power Sources, 2014, 269, 747 CrossRef CAS.
- S.-K. Jung, H. Gwon, J. Hong, K.-Y. Park, D.-H. Seo, H. Kim, J. Hyun, W. Yang and K. Kang, Adv. Eng. Mater., 2014, 4, 1 Search PubMed.
- S.-W. Woo, S.-T. Myung, H. Bang, D.-W. Kim and Y.-K. Sun, Electrochim. Acta, 2009, 54, 3851 CrossRef CAS.
- C.-H. Chen, J. Liu, M.-E. Stoll, G. Henriksen, D.-R. Vissers and K. Amine, J. Power Sources, 2004, 128, 278 CrossRef CAS.
- D. Wang and X.-H. Li, Electrochim. Acta, 2016, 188, 48 CrossRef CAS.
- Z.-G. Yang, W. Xiang, Z.-G. Wu, F.-G. He, J. Zhang, Y. Xiao, B.-H. Zhong and X.-D. Guo, Ceram. Int., 2017, 43, 3866 CrossRef CAS.
- F. Zhou and X.-M. Zhao, Electrochem. Commun., 2008, 10, 1168 CrossRef CAS.
- G.-Y. Li, Z.-L. Huang and Z.-C. Zuo, J. Power Sources, 2015, 281, 69 CrossRef CAS.
- W.-B. Hua, J.-B. Zhang and Z. Zheng, Dalton Trans., 2014, 43, 14284 RSC.
- Y. Zeng, K.-H. Qiu, Z.-Q. Yang, F.-D. Zhou, L. Xia and Y.-L. Bu, Ceram. Int., 2016, 42, 10433 CrossRef CAS.
- L. Xia, K.-H. Qiu and Y.-Y. Gao, J. Mater. Sci., 2015, 50, 2914 CrossRef CAS.
- M. Roberts and J. Owen, ACS Comb. Sci., 2011, 13, 126 CrossRef CAS PubMed.
- S. Zhang, Electrochim. Acta, 2007, 52, 7337 CrossRef CAS.
- Q.-Y. Chen, C.-Q. Du, D.-Y. Qu, X.-H. Zhang and Z.-Y. Tang, RSC Adv., 2015, 5, 75248 RSC.
- Y.-J. Li, Q.-Y. Su, Q. Han, P.-L. Li, L. Li, C.-R. Xu, X.-L. Cao and G.-L. Cao, Ceram. Int., 2017, 43, 3483 CrossRef CAS.
- J.-Z. Kong, F. Zhou, C.-B. Wang, X.-Y. Yang, H.-F. Zhai, H. Li, J.-X. Li, Z. Tang and S.-Q. Zhang, J. Alloys Compd., 2013, 554, 221 CrossRef CAS.
- C.-H. Lu and B.-J. Shen, J. Alloys Compd., 2010, 497, 159 CrossRef CAS.
- N. Tran, L. Crognennec, C. Jordy, P. Biensan and C. Delmas, Solid State Ionics, 2005, 17, 1539 CrossRef.
- X.-Y. Qiu, Q.-C. Zhuang, Q.-Q. Zhang, R. Cao, Y.-H. Qiang, P.-Z. Ying and S.-G. Sun, J. Electroanal. Chem., 2012, 687, 35 CrossRef CAS.
| This journal is © The Royal Society of Chemistry 2017 |