 Open Access Article
Aqueous extract of Cordyceps sinensis potentiates the antitumor effect of DDP and attenuates therapy-associated toxicity in non-small cell lung cancer via IκBα/NFκB and AKT/MMP2/MMP9 pathways†
Xiaowei Huo ad,
Chenqi Liuab,
Xuelian Baiab,
Wenjia Lic,
Jing Lic,
Xuefeng Huc and
Li Cao*a
aInstitute of Medicinal Plant Development, Chinese Academy of Medical Sciences and Peking Union Medical College, Beijing 100193, China. E-mail: lcao@implad.ac.cn; Tel: +86-10-57833222
bResearch Center on Life Sciences and Environmental Sciences, Harbin University of Commerce, Harbin 150076, China
cKey Laboratory of State Administration of Traditional Chinese Medicine, Sunshine Lake Pharma Co., LTD, Dongguan, 523850, China
dCollege of Pharmaceutical Science, Key Laboratory of Pharmaceutical Quality Control of Hebei Province, Hebei University, Baoding 071002, China
First published on 1st August 2017
Abstract
Cordyceps sinensis is reported as an invigorant with pleiotropic biological effects that has potential for tumor therapy. Here, we focused on a combined therapy using aqueous extract of C. sinensis (AECS) along with cis-diamminedichloroplatinum(II) (DDP) to potentiate the inhibitory effect of DDP and, meanwhile, reduce therapy-associated toxicity on NSCLC. We initially examined the in vitro antitumor effect of AECS, in vivo antitumor and toxicity-reduced effects of the combined treatment in a Lewis xenograft mice model, and further evaluated the potential mechanisms of action of the combined treatment. The synergistic antitumor activity and toxicity-attenuated effect of the combined treatment were further evaluated in zebrafish models. We found that AECS exhibited significant antitumor effects against various cancer cells in vitro. AECS, particularly AECS1, substantially potentiated the antitumor effect of DDP, as evidenced by a significant decrease in tumor growth, a prolongation of the survival time, and also alleviated toxicity in the Lewis xenograft mice model, accompanied by attenuated NFκB and AKT/MMP2/MMP9 pathways. Moreover, a remarkable increase of tumor inhibition in an A549 xenograft zebrafish model was observed with the combined therapy when compared to DDP treatment alone, and alleviated toxicity in zebrafish was also observed when treated with the combined therapy. Collectively, our results indicate that the combination of AECS1 and DDP should be a novel therapeutic modality to improve the efficacy of DDP-based chemotherapy and reduce therapy-associated toxicity, possibly by inhibiting IκBα/NFκB and AKT/MMP2/MMP9 pathways.
Introduction
Lung cancer is the primary cause of cancer-related mortality worldwide, among which non-small cell lung cancer (NSCLC) with poor prognosis accounts for approximately 80–85% of cases.1,2 Surgery, chemotherapy, radiotherapy, and biological therapy are primary therapeutic strategies for lung cancer.3 Surgical resection in particular plays a central role in the treatment of NSCLC at the localized early stages, however, lung cancer at the early stage is largely asymptomatic, and as a result, tumors are often diagnosed in a progressive and inoperable phase which is considered too late for surgical treatment.4–6 Chemotherapy-based pharmacological therapy, therefore, becomes the primary approach for the management of advanced NSCLC.Currently, cis-diamminedichloroplatinum(II) (DDP) becomes the chemotherapeutic agent of first choice in the therapy of NSCLC, which has been demonstrated effective against advanced and metastatic NSCLC with a significant survival improvement and better symptoms control compared with supportive care only.7–9 DDP-based chemotherapy is best known for the capacity to interact with DNA to form DNA intrastrand and interstrand crosslink adducts, thus activating DNA damage response that induces apoptotic cell death. Recent evidence, furthermore, suggests that DDP can also activate cytoplasmic signaling pathways that ultimately contributes to the apoptotic or necrotic demise of cancer cells characterized by an oxidative/metabolic burst, and, at least in some cases, the upregulation of pro-apoptotic members of BCL-2 family, thus resulting in the activation of the mitochondria apoptotic pathway.10–12 However, acquired resistance and therapy-associated systemic toxicity, such as vascular toxicity, anemia, neurotoxicity and nephrotoxicity, remains a concern, confining the application of DDP in chemotherapeutics.13–15 Consequently, excellent combination regimens with new agents that could improve therapeutic efficacy and simultaneously limit therapy-associated toxicity in patients with advanced NSCLC are urgently warranted.
Cordyceps sinensis (Berk.) Sacc, a composite consisting of the stromata of the fungus C. sinensis and its infected larvae (Family: Hepialidae), has been used extensively as an invigorant for subhealth people in Asia that offers many health benefits.16–18 Accumulated evidences from both animal and human studies indicate that extract of C. sinensis comprising numerous bioactive constituents such as cordycepin, polysaccharides, and nucleosides,19–21 exhibits various pharmacological actions, including anti-inflammatory, hepatoprotective, and antioxidant properties, thus highlighting its potency in human cancer therapy.22–24 Herein, we hypothesize that the combination with extract of C. sinensis and DDP will be beneficial to improve antitumor efficacy of DDP and, meanwhile, reduce therapy-related toxicity in human NSCLC. Particularly, aqueous extract of Cordyceps was extensively investigated for the antitumor activity,25 we, therefore, choose the combination with aqueous extract of C. sinensis (AECS) and DDP to conduct our investigation. Moreover, AECS1 and AECS2 obtained by two different extraction methods were evaluated in the present study to identify an extraction method with better antitumor activity.
To the best of our knowledge, no detailed studies have addressed the synergistic antitumor activity of AECS in combination with DDP against human NSCLC. The present study, was therefore, designed to investigate the influence of AECS on DDP-based treatment and further understand the underlying mechanism. Our results demonstrated that AECS, particularly AECS1, showed a direct inhibitory effect against various cancer cell lines, and it also potentiated the inhibitory effect of DDP and attenuated therapy-associated toxicity in vivo, which was mostly dependent on the attenuation of IκBα/NFκB and AKT/MMP2/MMP9 pathways. Thus, AECS1 may be a promising agent to be used in combination with DDP for the improvement of clinical results.
Materials and methods
Reagents
cis-Diamminedichloroplatinum(II) was purchased from Sigma-Aldrich (St Louis, MO, USA); berbamine hydrochloride was purchased from Shanghai Yuanye Biotechnology Co., Ltd (Shanghai, China); vinorelbine Tartrate Injection was purchased from Jiangsu Hansoh pharmaceutical Group Co., Ltd (Jiangsu, China); alanine aminotransferase (ALT) assay kit, aspartate aminotransferase (AST) assay kit, creatinine assay kit, and urea assay kit were purchased from Roche Pharmaceutical Ltd (Basel, Switzerland); antibodies against β-actin, NF-κB, p-IκB-α, TNF-α, COX-2, MMP2, MMP9, Bcl-2, Bcl-xl, and Bax were purchased from Santa Cruz Biotechnology (Santa, USA); antibodies against p-AKT, pro-caspase 3, and cleaved-caspase 3 were purchased from Cell Signaling Technology (Danvers, MA); all secondary antibodies were purchased from Cowin Biotech (Beijing, China).Material and extraction procedure
C. sinensis was cultured and provided by Sunshine Lake Pharma Co., Ltd (Dongguan, China). 500 g of C. sinensis samples were weighed out and cryogenically ground. 5000 mL distilled water was added to the sample. The mixture was homogenized in ice bath at 5000–6000 rpm for 30 min, and then in an ultrasonic bath for 30 min to obtain a uniform matrix. The matrix was stored at −20 °C for 1 h, followed by an ultrasonic bath again for 30 min. After extraction, the mixture was centrifuged at 8000 rpm for 15 min to obtain extract. The extract was lyophilized to obtain AECS1, which were stored at 4 °C and used for evaluating the antitumor activity against various cells and in vivo models in the following experiments.C. sinensis (30 g) was extracted with distilled water (300 mL) using a Soxhlet extractor at 100 °C for 5 h. The extract was then concentrated with a rotary evaporator under reduced pressure. Then, the filtrate was collected and lyophilized to obtain AECS2. Both AECS1 and AECS2 were diluted with the mobile phase (1![[thin space (1/6-em)]](https://www.rsc.org/images/entities/char_2009.gif) :
:![[thin space (1/6-em)]](https://www.rsc.org/images/entities/char_2009.gif) 1) and filtered through a 0.22 μm nylon syringe filter prior to injection into the HPLC system for analysis.
1) and filtered through a 0.22 μm nylon syringe filter prior to injection into the HPLC system for analysis.
HPLC analysis
HPLC analysis of AECS1 and AECS2 was performed using Waters HPLC system (Waters Corporation, USA) equipped with Waters 515 HPLC pump, Waters 717 plus autosampler, and Waters 2487UV detector. Separation was performed in a symmetry C18 150 mm × 4.6 mm ID, 5 μm column (Agilent ZORBAX SB-AQ, USA) by maintaining the isocratic low rate (0.8 mL min−1) of the mobile phase (0.4 M KH2PO4, pH 3.7![[thin space (1/6-em)]](https://www.rsc.org/images/entities/char_2009.gif) :
:![[thin space (1/6-em)]](https://www.rsc.org/images/entities/char_2009.gif) methanol 90
methanol 90![[thin space (1/6-em)]](https://www.rsc.org/images/entities/char_2009.gif) :
:![[thin space (1/6-em)]](https://www.rsc.org/images/entities/char_2009.gif) 10) and peaks were detected at 260 nm absorbance. Peaks of various compounds in the sample were identified by their retention times and co-injection tests with corresponding standard compounds. In addition, the content of polysaccharide was detected using the phenol-sulfuric acid method (ESI Table S1†).
10) and peaks were detected at 260 nm absorbance. Peaks of various compounds in the sample were identified by their retention times and co-injection tests with corresponding standard compounds. In addition, the content of polysaccharide was detected using the phenol-sulfuric acid method (ESI Table S1†).
Cell lines and cell culture
Human A549 and Lewis lung cancer cells were obtained from Chinese Academy of Medical Sciences Basic Medicine Cell Center (Beijing, China). Cells were cultured in RPMI-1640 media supplemented with 10% fetal bovine serum (FBS), 100 U mL−1 penicillin, and 100 μg mL−1 streptomycin at 37 °C in a 5% CO2 atmosphere.Cell viability
Cell viability was measured by MTT assay which is based on conversion of yellow tetrazolium salt to purple-formazan crystals by metabolically active cells, providing a quantitative determination of viable cells. Briefly, cells cultured in 96-well plates at a density of 8 × 10³ cells per well were treated with different concentrations of AECS1 and AECS2 for 24 h. Then, 10 μL MTT reagent at concentration of 5 mg mL−1 was added to the media and allowed to incubate for another 4 h at 37 °C in an atmosphere of 5% CO2. The medium was then removed and 100 μL DMSO was added to dissolve MTT crystals. Cell viability was quantified by reading the plates at an absorbance of 540 nm using a microplate reader.Lewis xenografts mice model
Male C57BL/6 mice weighing 16–18 g were obtained from Vital River Laboratory Animal Technology Co., Ltd. (Beijing, China). Mice were housed under standard conditions with freedom to water and food, and were subjected to a 12 h light/dark cycle. All mice protocols were approved by the Animal Ethics Committee at the Institute of Medicinal Plant Development, Chinese Academy of Medical Sciences (No. SLXD-2016091334) and were in compliance with Chinese Association for Laboratory Animal Sciences guidelines. Mice were randomly allocated into seven groups of ten mice each: control group (Group I), model group (Group II), DDP (2 mg kg−1) group (Group III), DDP (2 mg kg−1) + AECS2 (200 mg kg−1) (Group IV), DDP (2 mg kg−1) + AECS2 (800 mg kg−1) (Group V), DDP (2 mg kg−1) + AECS1 (200 mg kg−1) (Group VI), DDP (2 mg kg−1) + AECS1 (800 mg kg−1) group (Group VII). Mice in Group IV–Group VII were pretreated orally with AECS2 (200 mg kg−1), AECS2 (800 mg kg−1), AECS1 (200 mg kg−1), and AECS1 (800 mg kg−1), respectively for 7 days, and mice in Group I–Group III were pretreated orally with vehicle. On day 8, a total of 1 × 10⁶ of Lewis cells were inoculated subcutaneously on the right flanks of mice in Group II–Group VII. On day 9, mice in Group III–Group VII were intraperitoneally injected with DDP (10 mL kg−1, 1 time/2 d), and, meanwhile, orally administrated with vehicle, AECS2 (200 mg kg−1), AECS2 (800 mg kg−1), AECS1 (200 mg kg−1), and AECS1 (800 mg kg−1), respectively (1 time/d). From day 22 to day 36, tumor xenografts were monitored every 2 day with an electronic caliper measurements and tumor volume (V) was calculated using the formula V = (L × W2)/2, where L is the largest diameter and W is the diameter perpendicular to the largest diameter.Organ index and tumor inhibition rate
The effect of the combined treatment on mice organs was evaluated based on lung index, heart index, spleen index, thymus index and kidney index. All animals surviving on day 36 were weighted, followed by blood taken. Mice were then sacrificed and tumor, spleen, thymus, heart, lung, and kidney were isolated and weighted to calculate tumor inhibition rates and organ indexes. All samples were then collected and immediately frozen in liquid nitrogen and stored at −80 °C for further analysis. The tumor inhibition rates and organ indexes were calculated by the following formula: tumor inhibition rate (%) = (the average tumor weight of model group − the average tumor weight of treated group)/the average tumor weight of model group × 100%, organ index = organ weight (mg)/body weight (g).Serum biochemistry
Serum alanine aminotransferase (ALT), aspartate aminotransferase (AST), creatinine, and urea were assayed using commercially available test kits with a biochemistry analyzer system according to the manufacturer's instructions.A549 xenografts zebrafish model
A549 xenografts zebrafish model was established according to the method described previously,26 with minor modification. Wild-type AB zebrafishes, maintained in Zebrafish Research Center at Hunter Biotechnology, Inc (Hangzhou, China), were incubated with E3 medium (pH 7.2) under a 14 h light–10 h dark cycle at 28 °C. Embryos were obtained by natural crossing. All zebrafish protocols were approved by the Animal Ethics Committee at Hunter Biotechnology, Inc (no. IACUC-1452, no. IACUC-1546) and were in compliance with Chinese Association for Laboratory Animal Sciences guidelines. Tumor cells were introduced into blastula stage embryos using a standard cell transplantation methodology. Briefly, CM-Dil labeled A549 cells were injected in the yolk of zebrafish embryos (2 dpf). After implantation, embryos were randomly divided into eight groups (n = 30): Group I (model group), Group II (DDP 2 ng), Group III (AECS1 7.81 μg mL−1), Group IV (AECS1 15.63 μg mL−1), Group V (AECS1 31.25 μg mL−1), Groups VI (DDP 2 ng + AECS1 7.81 μg mL−1), Groups VII (DDP 2 ng + AECS1 15.63 μg mL−1), and Groups VIII (DDP 2 ng + AECS1 31.25 μg mL−1). DDP was injected, and AECS1 was dissolved in the water medium. After zebrafishes were administered for 3 days, fluorescence images were taken with a fluorescence microscope (AZ100, Nikon) and fluorescence intensity was analyzed using the NIS-Elements D 3.10 software. Tumor inhibition rates (%) = (fluorescence intensity of model group-fluorescence intensity of drug treated group)/fluorescence intensity of model group × 100%.Gastrointestinal toxicity induced by DDP in zebrafish
2 ng DDP was injected intravenously into wild-type AB zebrafish embryos (3 dpf) to induce gastrointestinal toxicity. Zebrafishes (including normal zebrafishes without DDP injection) were subsequently divided into five groups: Group I (normal zebrafishes without DDP injection), Group II (model zebrafishes, DDP 2 ng), Group III (DDP 2 ng + AECS1 3.47 μg mL−1), Group IV (DDP 2 ng + AECS1 10.42 μg mL−1), Group V (DDP 2 ng + AECS1 31.25 μg mL−1). AECS1 was dissolved in the water medium. After administered for two days, zebrafishes (5 dpf) were observed and images were taken with a microscope (SMZ645, Nikon). The diameter of the intestinal wall was calculated. The improvement of gastrointestinal toxicity was calculated by the following formula: improvement of gastrointestinal toxicity (%) = (the diameter of intestinal wall of drug treated group − the diameter of intestinal wall of model group)/the diameter of intestinal wall of model group × 100%.Neurotoxicity induced by DDP in zebrafish
2 ng DDP was injected intravenously into mutant Albino zebrafish embryos (3 dpf) to induce neurotoxicity. Zebrafishes (including normal zebrafishes without DDP injection) were subsequently divided into five groups: Group I (normal zebrafishes without DDP injection), Group II (model group, DDP 2 ng), Group III (DDP 2 ng + AECS1 3.47 μg mL−1), Group IV (DDP 2 ng + AECS1 10.42 μg mL−1), Group V (DDP 2 ng + AECS1 31.25 μg mL−1). AECS1 was dissolved in the water medium for zebrafishes. After administered for two days, zebrafishes were stained with acridine orange and observed under a fluorescence microscope (AZ100, Nikon). Nikon NIS-Elements D 3.10 software was used to analyze the images and calculate apoptotic bodies in brains of zebrafishes. The improvement of neurotoxicity was calculated by the following formula: improvement of neurotoxicity (%) = (apoptotic bodies in model group − apoptotic bodies in drug treated group)/apoptotic bodies in model group × 100%.Neutropenia induced by vinorelbine tartrate in zebrafish
0.625 ng vinorelbine tartrate was injected intravenously into transgenic zebrafish embryos (MPO-GFP, 2 dpf) that express GFP (green fluorescent protein) within their neutrophils to induce neutropenia. Zebrafishes (including normal zebrafishes without vinorelbine tartrate injection) were subsequently divided into six groups: Group I (normal zebrafishes), Group II (model zebrafishes, vinorelbine tartrate 0.625 ng), Group III (vinorelbine tartrate 0.625 ng + berberine hydrochloride 17.0 μg mL−1), Group IV (vinorelbine tartrate 0.625 ng + AECS1 55.6 μg mL−1), Group V (vinorelbine tartrate 0.625 ng + AECS1 166.7 μg mL−1), Group VI (vinorelbine tartrate 0.625 ng + AECS1 500 μg mL−1). AECS1 was dissolved in the water medium for zebrafishes. After administered until embryos grow to 3 dpf, zebrafishes were observed under a fluorescence microscope (AZ100, Nikon). Nikon NIS-Elements D 3.10 software was used to analysize the images and calculate the number of neutrophils. The improvement of neutropenia was calculated by the following formula: improvement of neutropenia (%) = (number of neutrophils in drug treated group − number of neutrophils in model group)/number of neutrophils in model group × 100%.Western blot analysis
The levels of p-AKT, MMP2, MMP9, p-IκBα, NFκB, TNFα, COX-2, Bcl-2, Bax, Bcl-xl, pro-caspase 3, and cleaved-caspase 3 were determined by western blot analysis. Briefly, tumor tissues were homogenized in a standard RIPA ice-cold RIPA buffer containing protease and phosphatase inhibitor cocktail purchased from Cowin Biotech (Beijing, China). A BCA protein estimation kit (Cowin Biotech Co., Ltd., Beijing, China) was used to determine protein concentrations. Equal amount of protein was separated by SDS-PAGE and then transferred to a polyvinylidene fluoride (PVDF) membrane. The membrane was blocked with 5% nonfat milk dissolved in TBST for 2 h and then probed with primary antibody (1![[thin space (1/6-em)]](https://www.rsc.org/images/entities/char_2009.gif) :
:![[thin space (1/6-em)]](https://www.rsc.org/images/entities/char_2009.gif) 500) overnight at 4 °C. After washing with TBST twice, the membrane was subsequently incubated with secondary antibodies (1
500) overnight at 4 °C. After washing with TBST twice, the membrane was subsequently incubated with secondary antibodies (1![[thin space (1/6-em)]](https://www.rsc.org/images/entities/char_2009.gif) :
:![[thin space (1/6-em)]](https://www.rsc.org/images/entities/char_2009.gif) 3000) for 2 h, washed with TBST, and then detected by enhanced chemiluminescence method using a commercial ECL kit (Cowin Biotech Co., Ltd.). The levels of protein expression were quantified by image J software (National Institutes of Health, Bethesda, MD, USA) and normalized to the relative internal standards.
3000) for 2 h, washed with TBST, and then detected by enhanced chemiluminescence method using a commercial ECL kit (Cowin Biotech Co., Ltd.). The levels of protein expression were quantified by image J software (National Institutes of Health, Bethesda, MD, USA) and normalized to the relative internal standards.
Statistical analysis
Statistical and graphical analyses were performed using GraphPad Prism 5 (GraphPad Software, La Jolla, CA, USA). Results were reported as mean ± standard deviation of the indicated number of independent experiments. P values were analyzed using ANOVA, and P < 0.05 was considered significant.Results
Bioactive ingredients of AECS1 and AECS2
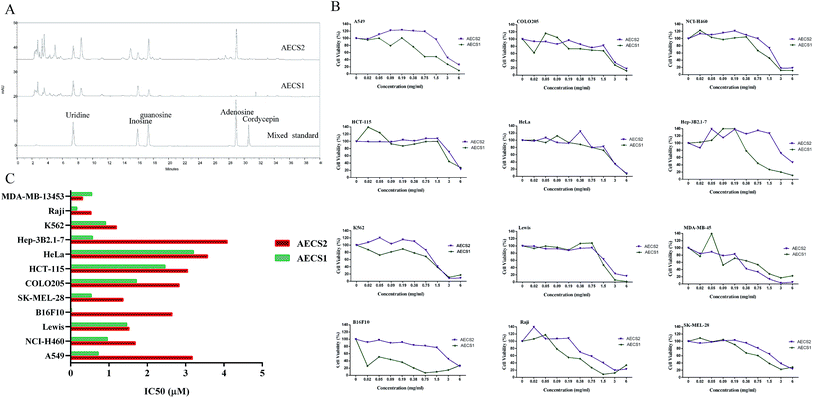
Nucleosides, as a major bioactive component of C. sinensis, has been reported to be a valuable chemical marker for quality control of C. sinensis,27 thus the present study was focused on detection of nucleosides in C. sinensis. The components of AECS1 and AECS2 were verified by comparing HPLC retention times with mixed standards. The chromatographic profiles of the components of AECS1 and AECS2 were shown in Fig. 1A. Both AECS1 and AECS2 contain high levels of uridine, inosine, and guanosine, however, that of other bioactive compounds previously identified in C. sinensis such as cordycepin was not detectable largely due to that their concentrations in the extract sample were below the detection limit.Cell viability
We determined cytotoxicity of AECS1 and AECS2 against various cancer cell lines, which were exposed to AECS1 or AECS2, at different concentrations, for 24 hours. As shown in Fig. 1B, both AECS1 and AECS2 dose-dependently reduced the growth and survival of A549, CoLo205, NCI-H460, HCT-115, HeLa, Hep 3B2.1-7, K562, Lewis, MDA-MB-13453, B16F10, Raji, and SK-MEL-28. IC50 values of AECS2 ranged from 0.31 to 4.08 mg mL−1, and that of AECS1 ranged from 0.02 to 3.2 mg mL−1 (Fig. 1C). These results demonstrated that, when administered alone, both AECS1 and AECS2 exhibited significant and broad antitumor activity in vitro, however, in contrast, the IC50 values of AECS1 were lower than that of AECS2, indicating more significant antitumor activity of AECS1 in vitro.AECS potentiated antitumor effect of DDP on Lewis xenograft tumors
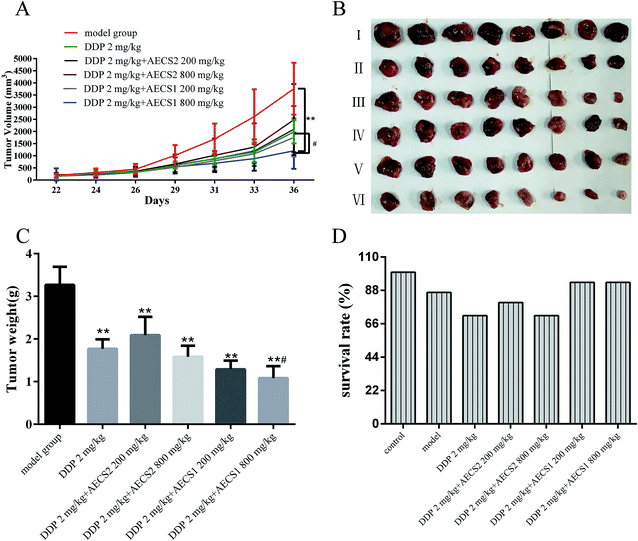
We next performed an animal experiment using Lewis cells in a murine xenograft model, to further test for AECS potentiation of the anti-cancer properties of DDP in vivo. Lewis cells were injected subcutaneously into mice to establish Lewis xenograft mouse model, and tumor formation was monitored every two days. The mice were euthanized and tumor weights were measured. Our results showed that a significant reduction of the tumor volume and tumor weight was observed during DDP treatment, a standard-of-care chemotherapy agent in NSCLC, in comparison with vehicle model group (Fig. 2A–C). Additionally, tumor volume and tumor weight were also remarkably reduced by the combination with AECS and DDP compared to vehicle model group (Fig. 2A–C). Moreover, the tumor volume and the average tumor weight from the combination group with DDP and AECS1 (800 mg kg−1) was significantly decreased when compared with that derived from DDP group (Fig. 2A–C). Results in Fig. 2D showed that DDP combined with AECS1 could improve the survival rates of mice bearing Lewis xenografts in comparison with DDP treatment alone during the observation period, however, with no significant difference. These results indicated that in mice bearing Lewis tumors, treatment with DDP plus AECS1 (800 mg kg−1) resulted in significant tumor inhibition than that achieved with DDP treatment alone. Thus, combination treatment with DDP plus AECS1 was chosen for further experiments.Effect of AECS on organ indexes and serum biochemistry of Lewis xenograft mice
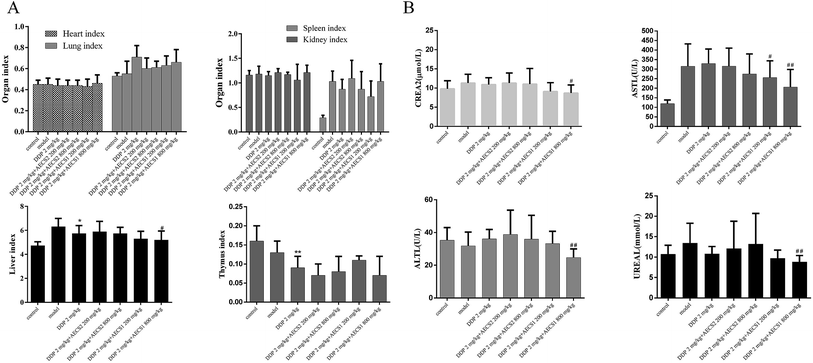
The toxicity attenuation of the combined treatment was investigated in Lewis xenograft models. As shown in Fig. 3A, there was no significant difference of the thymus index, heart index, lung index, kidney index, and spleen index between the DDP-treated group and the combination-treated group. Furthermore, levels of AST, ALT, creatinine, and urea were measured to confirm the hepatoprotective and renal protective effect of AECS1 and AECS2. A significant decrease of the levels of AST, ALT, creatinine, and urea in serum was observed in the combination group with DDP and AECS1, as compared to DDP monotherapy, confirming protective effect of the combined treatment. These results strongly indicated that DDP combined with AECS, particularly AECS1, could reduce toxicity to liver and kidney.Effect of AECS on IκBα/NFκB and AKT/MMP2/MMP9 pathways in Lewis xenografts
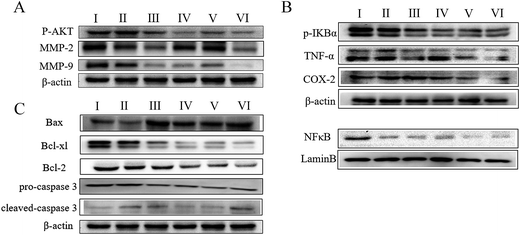
To understand the mechanism by which AECS potentiated the antitumor effects of DDP, we examined the expression of proteins associated with IκBα/NFκB and AKT/MMP2/MMP9 pathways in tumor lysates from Lewis xenograft models by western blot analysis. As shown in Fig. 4A, treatment with AECS1 + DDP, AECS2 + DDP significantly decreased expression of p-Akt, MMP2, and MMP9, compared with vehicle or DDP monotherapy (Fig. 4A). In addition, expression of p-IκBα, TNFα, COX-2 and nucleus translocation of NFκB was significantly decreased in Lewis xenografts when AECS plus DDP was administered in combination, compared to either vehicle or DDP monotherapy (Fig. 4B). Furthermore, expression of Bax was increased and expression of Bcl2 and Bcl-xl was decreased in harvested tumors following AECS1 + DDP, and AECS2 + DDP treatment, compared to vehicle or single-DDP treated tumors (Fig. 4C). Results in Fig. 4C also illustrated that AECS1 (800 mg kg−1) + DDP treatment increased expression of cleaved caspase 3 and decreased expression of pro-caspase 3 compared to vehicle control treatment group. Overall, these results suggested that the synergistic antitumor effect when AECS was combined with DDP was due, in part, to the regulation of IκBα/NFκB and AKT/MMP2/MMP9 pathways.AECS1 potentiated antitumor effect of DDP in zebrafish xenograft model
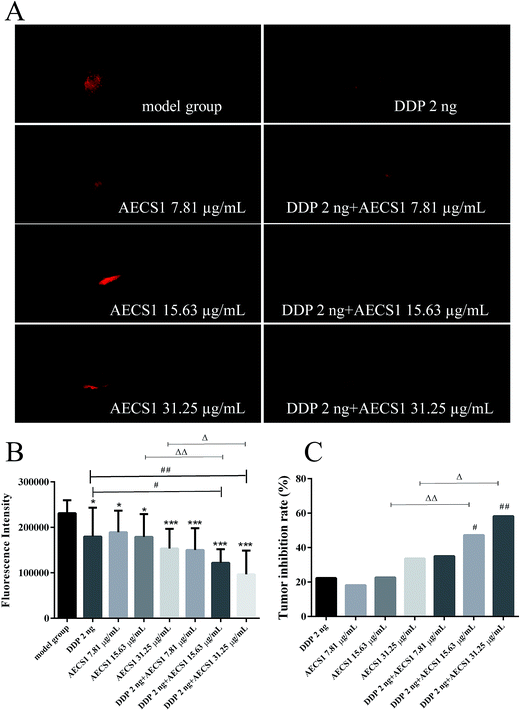
We extended our study to a zebrafish xenograft model to better understand the enhanced antitumor efficacy of the combined treatment in vivo. After inoculation with A549 cells, zebrafish embryos (2 dpf) were treated with DDP, AECS1, or their combination. AECS1 was dissolved in water medium for zebrafish. After administered for 3 days, zebrafish embryos (5dpf) were imaged under a fluorescence microscope. Notably, all treatment exhibited anticancer effect in this A549 xenograft model, by contrast, AECS1 combined with DDP potently inhibited tumor growth more visible and significant compared to single-agent treated groups, as indicated by decreased fluorescence intensity reflecting tumor volume (Fig. 5A and B). Results in Fig. 5C showed that AECS1 combined with DDP significantly increased tumor inhibition rates, in comparison to single-agent treatment. In this model, both monotherapy and combined treatment with DDP and AECS1 were well tolerated as there was no zebrafish death over the course of the experiments. Together, these data indicated that the antitumor activity of monotherapy using DDP or AECS1 treatment alone in A549 xenograft models was enhanced by the combined treatment of both agents.Effect of AECS1 on gastrointestinal toxicity induced by DDP in zebrafish
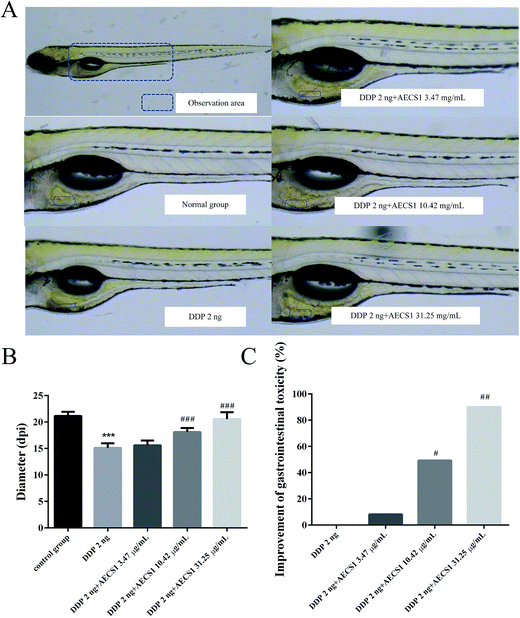
We next performed a separate set of experiments to test whether the combined treatment with AECS1 plus DDP had a direct effect on gastrointestinal toxicity induced by DDP in zebrafish. Results in Fig. 6A showed that treatment with DDP (2 ng/fish) resulted in thinner intestinal wall than that observed in the normal control group. Fortunately, AECS1 at doses of 10.42 and 31.25 μg mL−1 strikingly improved the gastrointestinal toxicity induced by DDP, as evidenced by the thickened intestinal wall when both agents were combined. Consistently, results in Fig. 6B showed that diameter of the intestinal wall was significantly decreased in animals that received DDP monotherapy, however, AECS1 at doses of 10.42 and 31.25 μg mL−1 markedly increased the diameter of the intestinal wall. Results in Fig. 6C showed that AECS1 at doses of 10.42 and 31.25 μg mL−1 significantly improved gastrointestinal toxicity induced by DDP. These results indicated that AECS1 significantly attenuated DDP-induced neurotoxicity.Effect of AECS1 on neurotoxicity induced by DDP in zebrafish
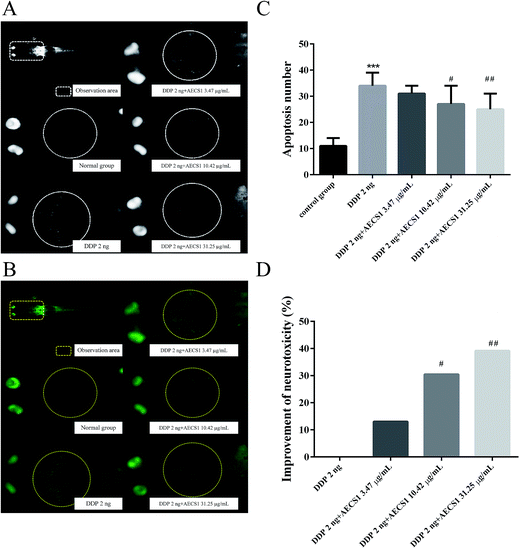
In order to evaluate the effect of AECS1 on reversing neurotoxicity induced by DDP, a zebrafish model was established. As shown in Fig. 7A and B, single-agent therapy with DDP (2 ng/fish) induced abundant apoptotic bodies, and the apoptotic bodies almost disappeared after zebrafishes were treated with AECS1 at doses of 10.42 μg mL−1 and 31.25 μg mL−1. Results in Fig. 7C also showed that single-agent therapy with DDP (2 ng/fish) significantly increased the number of apoptotic bodies in the brain area of zebrafishes, AECS1 at doses of 10.42 and 31.25 μg mL−1, however, markedly decreased the number of apoptotic bodies induced by DDP. Results in Fig. 7D showed that AECS1 at doses of 10.42 and 31.25 μg mL−1 significantly improved the neurotoxicity induced by DDP. These results suggested that AECS1 may protect against DDP-induced neurotoxicity.Effect of AECS1 on neutropenia induced by vinorelbine tartrate in zebrafish
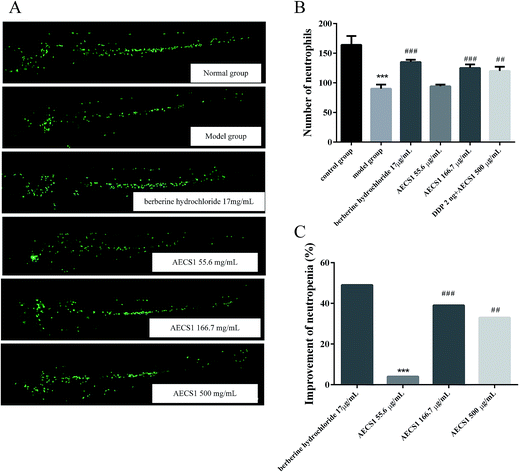
Neutropenia was another severe side effect caused by chemotherapy treatment, compromising the therapeutic efficacy. Hence, effect of AECS1 on neutropenia was further investigated in vinorelbine tartrate-induced zebrafish. As shown in Fig. 8A and B, vinorelbine tartrate treatment resulted in marked decrease of neutrophils in zebrafishes, whereas berberine hydrochloride, the positive control, significantly increased the number of neutrophils in vinorelbine tartrate-induced zebrafishes. AECS1 at doses of 166.7 and 500 μg mL−1 also substantially reversed the reduction of neutrophils induced by vinorelbine tartrate, comparable to that achieved by berberine hydrochloride. Results in Fig. 8C were consistent with that observed in Fig. 8A and B, showing that AECS1 at doses of 166.7 and 500 μg mL−1 significantly improved the neutropenia induced by vinorelbine tartrate. These results demonstrated the effect of AECS1 on reversing neutropenia induced by vinorelbine tartrate in zebrafish model.Discussion
In the present study, we observed that AECS exhibited significant anticancer effects on various cell lines in vitro. AECS, particularly AECS1, also enhanced the therapeutic effects of DDP on a mouse Lewis xenograft model, and meanwhile, reduced its toxicity in this model via regulating IκBα/NFκB and AKT/MMP2/MMP9 pathways. Additionally, the enhanced antitumor effect of the combined treatment with AECS1 and DDP was confirmed by conducting an another in vivo study using A549 tumor xenografts. Further study revealed that AECS1 reduced DDP- or vinorelbine tartrate-induced toxicity in larval zebrafish models. To the best of our knowledge, this study for the first time demonstrated that AECS1 enhanced the therapeutic effects of DDP, highlighting its clinical use in NSCLC therapy.NFκB, a crucial mediator of tumor promotion, is proposed as an inducible transcription factor that transcriptionally controls a large set of target genes regulating the fate of cells such as programmed cell death, cell survival and proliferation, cell invasion and tumorigenesis. It is frequently activated in various cancers, including NSCLC.28,29 NF-κB is normally stabilized in the cytoplasm in an inactive form by its negative regulator IκB.30 Once stimulated, IκB is phosphorylated by the IκB kinase (IKK), which triggers degradation of IκB, allowing the release and nuclear translocation of NFκB to activate various target genes.31,32 Consistently, in the present study, we found that in murine Lewis xenograft model, AECS combined with DDP significantly attenuated NFκB pathways, via the inhibition of p-IκBα, thus decreasing nuclear translocation of NFκB and expression of its downstream proteins, including TNFα and COX-2, which might be responsible for its antitumor activity in vivo.
It is well established that the PI3K-AKT pathway is another significant signal transduction pathway involved in the regulation of multiple cellular functions including cell proliferation, apoptosis, adhesion, and motility.33 Enhanced PI3K signaling is regarded to be an important signaling pathway associated with oncogenesis, which has been proposed to implicate in multiple human malignancy including NSCLC.34–36 In addition to its contribution to tumourigenesis, aberrant PI3K/AKT signaling is correlated with altered sensitivity to various chemotherapeutic agents.37 The primary effector molecule of the PI3K signaling cascade is Akt. Aberrant activation of AKT is required for constitutive activation of NF-κB, once activated, Akt transiently translocates into the nucleus where it affects the activity of NF-κB via IKK.38 Akt also targets BCL-2, Bad, Bim, caspase-9, MMP2, MMP9 to affect the survival and apoptotic state of the cells.34,39 Therefore, this pathway becomes a desirable target which might serve as a therapeutic option in the treatment of NSCLC. Previous studies have confirmed that cordyceps and its combination with chemotherapeutics exhibited significant antitumor activity via regulating PI3K/AKT pathway and caspase-associated pathway.25,40 Consistently, in the present study, we found that AECS combined with DDP markedly inhibited phosphorylation of AKT, decreased the expression of the downstream proteins including MMP2, MMP9, Bcl-2, and Bcl-XL, and, meanwhile, increased expression of pro-apoptotic protein Bax. The imbalance between the anti-apoptotic proteins Bcl-2, Bcl-XL, and pro-apoptotic protein Bax resulted in upregulation of cleaved-caspase 3, thus leading to cell apoptosis.
Murine models of xenotransplantation, as the gold standard for in vivo xenotransplantation, have been used for decades, however, concern remains when using the mouse as a xenograft model. These include the long duration of time to visible engraftment of human cells, the difficulties in imaging of single or small amounts of engrafting cells and the engraftment heterogeneity between samples requiring laborious experiments with large amounts of animals.41 Most recently, Zebrafish (Danio rerio) has become an attractive research model for the analysis of tumor development and for chemical screens. Zebrafish is a freshwater vertebrate providing unique opportunities to visualize tumor cell behavior due to the feasibility of xenotransplanting cancer cells into zebrafish embryos and the transparency of their larvae, allowing imaging of cancer progression and, meanwhile, monitoring their response to a range of treatments in real time.42,43 Here, we used both murine and zebrafish models of xenotransplantation to evaluate enhanced antitumor effect of the combined treatment. We also used zebrafish models to test reduced toxicity by the combined treatment. We found that AECS1 significantly enhanced the antitumor effect of DDP, as evidenced by decreased tumor volume and reduced tumor weight in these two models. AECS1 also significantly alleviated gastrointestinal toxicity, neurotoxicity and neutropenia induced by DDP or vinorelbine tartrate in zebrafish.
In conclusion, the studies described herein are the first to demonstrate the synergistic antitumor activity of AECS in combination with DDP. Additionally, the combination with AECS, particularly AECS1, and DDP is highly effective for attenuating toxicity induced by DDP therapy both in a murine xenograft model and zebrafish model. The synergistic antitumor effect of the combined treatment in Lewis xenograft was associated with the attenuation of the IκBα/NFκB and AKT/MMP2/MMP9 pathways. These finding emphasizes the possibility of using AECS1 in combination with DDP in the management of NSCLC.
Conflict of interest
The authors declare no conflict of interest.Acknowledgements
This work was supported by Key Laboratory of Bioactive Substances and Resources Utilization of Chinese Herbal Medicine, Ministry of Education, and by Beijing Key Laboratory of Innovative Drug Discovery of Traditional Chinese Medicine (Natural Medicine) and Translational Medicine, Institute of Medical Plant Development, Peking Union Medical College and Chinese Academy of Medical Sciences.References
- A. Jemal, R. C. Tiwari, T. Murray, A. Ghafoor, A. Samuels, E. Ward, E. J. Feuer, M. J. Thun and S. American Cancer, Ca-Cancer J. Clin., 2004, 54, 8–29 CrossRef PubMed.
- M. Chougule, A. R. Patel, P. Sachdeva, T. Jackson and M. Singh, Lung Cancer, 2011, 71, 271–282 CrossRef PubMed.
- T. Ren, J. Shan, Y. Qing, C. Qian, Q. Li, G. Lu, M. Li, C. Li, Y. Peng, H. Luo, S. Zhang, W. Zhang, D. Wang and S. F. Zhou, Drug Des., Dev. Ther., 2014, 8, 2517–2529 CrossRef CAS PubMed.
- C. Centers for Disease and Prevention, Morb. Mortal. Wkly. Rep., 2002, 51, 49–53 Search PubMed.
- C. J. Beadsmoore and N. J. Screaton, Eur. J. Radiol., 2003, 45, 8–17 CrossRef CAS PubMed.
- W. Liu, J. Zhang, C. Ying, Q. Wang, C. Yan, Y. Jingyue, Y. Zhaocai, X. Yan, S. Heng-Jun and J. Lin, Int. J. Biomed. Sci., 2012, 8, 28–35 CAS.
- D. H. Johnson, Chest, 2000, 117, 133S–137S CrossRef CAS PubMed.
- G. Wang, E. Reed and Q. Q. Li, Oncol. Rep., 2004, 12, 955–965 CAS.
- J. H. Schellens, A. S. Planting, N. van Zandwijk, J. Ma, M. Maliepaard, M. E. van der Burg, M. de Boer-Dennert, E. Brouwer, A. van der Gaast, M. J. van den Bent and J. Verweij, Br. J. Cancer, 2003, 88, 814–821 CrossRef CAS PubMed.
- A. Mandic, J. Hansson, S. Linder and M. C. Shoshan, J. Biol. Chem., 2003, 278, 9100–9106 CrossRef CAS PubMed.
- M. Berndtsson, M. Hagg, T. Panaretakis, A. M. Havelka, M. C. Shoshan and S. Linder, Int. J. Cancer, 2007, 120, 175–180 CrossRef CAS PubMed.
- P. Vandenabeele, L. Galluzzi, T. Vanden Berghe and G. Kroemer, Nat. Rev. Mol. Cell Biol., 2010, 11, 700–714 CrossRef CAS PubMed.
- C. Gridelli, A. Rossi and P. Maione, Oncogene, 2003, 22, 6629–6638 CrossRef CAS PubMed.
- W. N. Rom, J. G. Hay, T. C. Lee, Y. Jiang and K. M. Tchou-Wong, Am. J. Respir. Crit. Care Med., 2000, 161, 1355–1367 CrossRef CAS PubMed.
- J. Y. Douillard, J. Eckardt and G. V. Scagliotti, Lung Cancer, 2002, 38(suppl. 4), 21–28 CrossRef PubMed.
- D. T. Wu, G. P. Lv, J. Zheng, Q. Li, S. C. Ma, S. P. Li and J. Zhao, Sci. Rep., 2016, 6, 37668 CrossRef CAS PubMed.
- J. N. Mi, J. R. Wang and Z. H. Jiang, Sci. Rep., 2016, 6, 20870 CrossRef CAS PubMed.
- D. W. Zhang, Z. L. Wang, W. Qi and G. Y. Zhao, BMC Complementary Altern. Med., 2014, 14, 484 CrossRef PubMed.
- K. Yue, M. Ye, Z. Zhou, W. Sun and X. Lin, J. Pharm. Pharmacol., 2013, 65, 474–493 CrossRef CAS PubMed.
- H. S. Tuli, A. K. Sharma, S. S. Sandhu and D. Kashyap, Life Sci., 2013, 93, 863–869 CrossRef CAS PubMed.
- X. Zhou, Z. Gong, Y. Su, J. Lin and K. Tang, J. Pharm. Pharmacol., 2009, 61, 279–291 CrossRef CAS PubMed.
- F. Zhong, X. Liu, Q. Zhou, X. Hao, Y. Lu, S. Guo, W. Wang, D. Lin and N. Chen, Nephrol., Dial., Transplant., 2012, 27, 556–565 CrossRef PubMed.
- Y. Peng, K. Huang, L. Shen, Y. Y. Tao and C. H. Liu, Acta Pharmacol. Sin., 2016, 37, 204–216 CrossRef CAS PubMed.
- L. W. Shao, L. H. Huang, S. Yan, J. D. Jin and S. Y. Ren, Oncol. Lett., 2016, 12, 995–1000 Search PubMed.
- J. Song, Y. Wang, M. Teng, S. Zhang, M. Yin, J. Lu, Y. Liu, R. J. Lee, D. Wang and L. Teng, Mol. Med. Rep., 2016, 13, 5132–5140 CAS.
- L. Hamilton, K. R. Astell, G. Velikova and D. Sieger, Zebrafish, 2016, 13, 523–534 CrossRef CAS PubMed.
- J. H. Xiao, Y. Qi and Q. Xiong, Recent Pat. Biotechnol., 2013, 7, 153–166 CrossRef CAS PubMed.
- M. Karin and F. R. Greten, Nat. Rev. Immunol., 2005, 5, 749–759 CrossRef CAS PubMed.
- S. Nair, S. T. Doh, J. Y. Chan, A. N. Kong and L. Cai, Br. J. Cancer, 2008, 99, 2070–2082 CrossRef CAS PubMed.
- X. Huo, L. Zhang, L. Gao, Y. Guo, L. Zhang, L. Li, J. Si and L. Cao, Biol. Pharm. Bull., 2015, 38, 1328–1336 CAS.
- M. Karin, J. Biol. Chem., 1999, 274, 27339–27342 CrossRef CAS PubMed.
- S. Hirai, S. Horii, Y. Matsuzaki, S. Ono, Y. Shimmura, K. Sato and Y. Egashira, Life Sci., 2014, 117, 1–6 CrossRef CAS PubMed.
- L. M. Neri, A. Cani, A. M. Martelli, C. Simioni, C. Junghanss, G. Tabellini, F. Ricci, P. L. Tazzari, P. Pagliaro, J. A. McCubrey and S. Capitani, Leukemia, 2014, 28, 739–748 CrossRef CAS PubMed.
- I. Vivanco and C. L. Sawyers, Nat. Rev. Cancer, 2002, 2, 489–501 CrossRef CAS PubMed.
- J. Jiang, Y. Zhang, Y. Guo, C. Yu, M. Chen, Z. Li, S. Tian and C. Sun, Oncotarget, 2015, 6, 6359–6372 Search PubMed.
- P. Y. Yip, Transl. Lung Cancer Res., 2015, 4, 165–176 CAS.
- P. L. Tazzari, A. Cappellini, F. Ricci, C. Evangelisti, V. Papa, T. Grafone, G. Martinelli, R. Conte, L. Cocco, J. A. McCubrey and A. M. Martelli, Leukemia, 2007, 21, 427–438 CrossRef CAS PubMed.
- L. S. Steelman, W. H. Chappell, S. L. Abrams, R. C. Kempf, J. Long, P. Laidler, S. Mijatovic, D. Maksimovic-Ivanic, F. Stivala, M. C. Mazzarino, M. Donia, P. Fagone, G. Malaponte, F. Nicoletti, M. Libra, M. Milella, A. Tafuri, A. Bonati, J. Basecke, L. Cocco, C. Evangelisti, A. M. Martelli, G. Montalto, M. Cervello and J. A. McCubrey, Aging, 2011, 3, 192–222 CAS.
- J. A. Engelman, J. Luo and L. C. Cantley, Nat. Rev. Genet., 2006, 7, 606–619 CrossRef CAS PubMed.
- Y. H. Chen, J. Y. Wang, B. S. Pan, Y. F. Mu, M. S. Lai, E. C. So, T. S. Wong and B. M. Huang, OncoTargets Ther., 2013, 6, 983–998 CAS.
- M. Konantz, T. B. Balci, U. F. Hartwig, G. Dellaire, M. C. Andre, J. N. Berman and C. Lengerke, Ann. N. Y. Acad. Sci., 2012, 1266, 124–137 CrossRef PubMed.
- J. Spitsbergen, Nat. Methods, 2007, 4, 548–549 CrossRef CAS PubMed.
- K. Stoletov, V. Montel, R. D. Lester, S. L. Gonias and R. Klemke, Proc. Natl. Acad. Sci. U. S. A., 2007, 104, 17406–17411 CrossRef CAS PubMed.
Footnote |
| † Electronic supplementary information (ESI) available. See DOI: 10.1039/c7ra04716a |
| This journal is © The Royal Society of Chemistry 2017 |

