 Open Access Article
Preparation and characterization of a TiO2-NT/SnO2–Sb tubular porous electrode with long service lifetime for wastewater treatment process†
Anlin Xu,
Xiang Dai,
Kajia Wei,
Weiqing Han *,
Jiansheng Li,
Xiuyun Sun,
Jinyou Shen and
Lianjun Wang*
Key Laboratory of Jiangsu Province for Chemical Pollution Control and Resources Reuse, School of Environment and Biological Engineering, Nanjing University of Science and Technology, Nanjing 210094, China. E-mail: hwqnjust@aliyun.com; wanglj@mail.njust.edu.cn; Fax: +86-25-84315795; Fax: +86-25-84315941; Tel: +86-25-84315795 Tel: +86-25-84315941
First published on 1st August 2017
Abstract
The broad application of highly electrocatalytic SnO2–Sb electrodes for wastewater treatment is limited by their short service lifetime. Herein, a novel substrate structure, tubular porous titanium, was applied to prepare a TiO2-NT/SnO2–Sb electrode, which could greatly improve the stability of the electrode for electrochemical oxidation process. Based on the analysis conducted using a field emission scanning electron microscope (FE-SEM), linked with an energy dispersive spectrometer (EDS), it was demonstrated that a solid solution between Sn and Sb presented a smooth surface of the tubular porous electrode. The crystalline structure and chemical composition of the electrode coating are determined by X-ray diffraction (XRD). Accelerated service life test reveals that under the 0.2 A cm−2 current density in a 0.5 M H2SO4 solution, the TiO2-NT/SnO2–Sb tubular porous electrode has the longest accelerated service lifetime of 68.9 h, which is 10.9 times that of the TiO2-NT/SnO2–Sb plate electrode. Cyclic voltammetry curves (CVs) and linear sweep voltammetry curves (LSVs) reveal the enhanced electroactive surface area and higher oxygen evolution potential (OEP = 1.85 V vs. Ag/AgCl) of the electrode. Moreover, the TiO2-NT/SnO2–Sb tubular porous electrode has the larger outer voltammetric charge q*. During the electrochemical oxidation of pyrimidine, the tubular system constructed using the TiO2-NT/SnO2–Sb tubular porous electrode as the anode also exhibited best electrocatalytic performance, and 97.9% pyridimine removal efficiency and 79.4% COD removal efficiency at 6 h were achieved.
1 Introduction
Anticancer drugs that are produced to inhibit cell growth or directly kill cells are proven to have potential carcinogenic, genotoxic, mutagenic, and teratogenic properties.1 Pyrimidine, as a typical pharmaceutical intermediate of commercial anticancer drugs, has properties similar to those of the anticancer drugs. In particular, pyrimidine belongs to nitrogenous heterocyclic compounds and has complete resistance for biodegradation.2 Therefore, the conventional treatment used for the removal of pyrimidine from wastewater could be replaced by some advanced oxidation technologies.As a method of advanced oxidation technologies, electrochemical oxidation attracts significant interests in the field of wastewater treatment due to its high oxidation efficiency, easy operation, and environmental compatibility.3,4 These methods are based on the in situ generation of hydroxyl radical (˙OH), which has a high standard reduction potential (Eo(˙OH/H2O) = 2.80 V/SHE) and can non-selectively react with most organic compounds.
The selection of anode materials has a deep influence on the ˙OH production during the electrochemical oxidation processes; thus, the selection of a proper anode material becomes a key factor in the study of electrochemical oxidation.5,6 An ideal anode material needs to fulfill four requirements: superior electrochemical activity, excellent stability, good conductivity, and high oxygen evolution potential.7 Compared to several materials including Pt,8 RuO2,9 IrO2,10 PbO2,11 and SnO2,12,13 Sb-doped SnO2 (SnO2–Sb) is considered to be a suitable anode material to treat refractory biodegradable organic contaminants because of its higher OEP and excellent electrocatalytic performance.14,15 However, the poor stability of the SnO2–Sb electrodes hinders their wide spread applications. The researchers have explored a number of methods for improving the performance of SnO2–Sb electrodes. TiO2 nanotubes anodized on the surface of a Ti sheet,14 SnO2–Sb-doped PTFE,16 and nanocomposite SnO2 have been successfully applied to improve the performance of SnO2–Sb electrodes.17
Generally, the strengthened combination between a Ti substrate and SnO2–Sb coating is considered as one of the main factors to promote the loading amount of the SnO2–Sb electrode and its stability.18,19 In the abovementioned methods, some researchers prepared TiO2 nanotubes on the surface of a Ti sheet to improve the combination between the substrate and the coating. After the TiO2 nanotubes (NTs) were filled with SnO2–Sb, the Ti sheet and coating combined firmly via the ordered-stake microstructure. Therefore, the service lifetime of the SnO2–Sb electrode was greatly improved.20 TiO2-NTs can be synthesized via electrochemical anodization, hydrothermal treatment, and template-assisted method.21,22 The electrochemical anodization method is widely adopted because the fabricated TiO2-NTs are highly ordered and the dimension of nanotubes can be easily controlled.23–25 Cui et al. had fabricated TiO2-NTs on the Ti sheet and then embedded SnO2–Sb into it via sol–gel and thermal deposition methods.26 Chen et al. prepared a TiO2-NT/SnO2–Sb electrode via electrochemical anodization, electrodeposition, and annealing.14 Both electrodes displayed superior electrochemical performance and longer service lifetime.
The conventional SnO2–Sb electrode based on a Ti sheet suffers from inefficient efficiency of electrochemical oxidation that is caused by the weak mass transfer of the molecule.27 In recent years, many efforts have been devoted to solving this problem. It has been confirmed that the mass transfer is enhanced as the turbulence is promoted by the rotating cylinder electrode28 or the reactor design.29 The mass transport process is also determined according to the mass transfer coefficient, diffusion coefficient, its velocity, viscosity, and characteristic length. The diffusion coefficient mostly affects the ratio of degradation. Based on this, a tubular porous electrode was fabricated to establish a tubular electrochemistry system for improving the diffusion coefficient and the degradation efficiency of electrochemical oxidation. In our previous study, the reactor consisting of tubular porous electrodes was found to be a good choice due to its large electrochemical surface area and high mass transfer efficiency via the pump.30–32 Moreover, the tubular porous electrode showed excellent performance in terms of electrochemical oxidation efficiency. There are very few studies focusing on the testing of lifetime and electrocatalytic performance of the modified electrodes on different bases.
In this study, we designed a new substrate structure to improve the lifetime of a SnO2–Sb electrode by combining the features of a TiO2-NT/SnO2–Sb electrode and a tubular porous electrode. In detail, the TiO2-NTs were first fabricated on the surface of a porous Ti tube via electrochemical anodization, and then, SnO2–Sb was embedded into TiO2-NTs; this formed a sol–gel coating on the substrate. Finally, the TiO2-NT/SnO2–Sb tubular porous electrode was achieved after several high temperature calcinations. To explore the effects of the electrode substrate structure on the electrocatalytic performance, the TiO2-NT/SnO2–Sb electrode and Ti/SnO2–Sb tubular porous electrode, prepared under the same conditions, were compared with our electrode. The crystalline properties and morphology structure of the electrodes were characterized via field emission scanning electron microscopy (FE-SEM), EDS, XRD, and N2 adsorption/desorption isotherm. The stability of the electrodes was tested by the accelerated service lifetime test. Moreover, the electrochemical performance of the electrodes was examined by CVs and LSVs. Finally, pyrimidine was used as a pollutant to evaluate the electrochemical degradation capability of the electrode and the application of the proposed electrode in wastewater treatment.
2 Experimental
2.1 Chemical reagents
Materials used in the experiment involved industrial titanium tubular membrane with 5 μm pore size and titanium plate (99.9%), and stainless-steel plate and tube (Nanjing XiongKai Filtration Equipment Co., LTD). All the other chemicals including hydrochloric acid, sulfuric acid, SnCl4·5H2O, SbCl3, potassium fluoride, hydrofluoric acid, citric acid monohydrate, and so on were of analytical grade, which were purchased from Aladdin. Methanol was of HPLC grade (Aladdin), and deionized water was used during the experimental process.2.2 Fabrication of the TiO2-NTs on a porous Ti tube
A porous Ti tube was immersed in the HCl solution (18 wt%, 80 °C) for 25 min to remove the oxide layer. Then, the tube was successively degreased by sonicating in acetone and distilled water. Subsequently, the porous Ti tube was anodized by a concentric structure device with a stainless-steel tube as the cathode. The porous Ti tube (diameter: 3 cm) was placed in the center of the stainless-steel tube (diameter: 5 cm), and the distance between the cathode and anode was 1 cm. Electrochemical anodization was carried out in the electrolyte (0.1 M KF, 0.075 M HF, and 1 M H2SO4) at 20 V for 30 min, and the TiO2-NTs were fabricated on the surface of the tubular porous substrate. After anodization, the porous Ti tube was cleaned with distilled water and dried at room temperature for 12 h, and then, it was annealed at 500 °C in air for 1 h at a rate of 1.5 °C min−1 to obtain a stable TiO2-NTs on the tubular porous base.2.3 Preparation of the TiO2-NT/SnO2–Sb tubular porous electrode
The precursor solution was prepared through the Pechini method.33 Citric acid monohydrate, antimony trichloride, and tin chloride pentahydrate were successively added to ethylene glycol in a molar ratio of 30![[thin space (1/6-em)]](https://www.rsc.org/images/entities/char_2009.gif) :
:![[thin space (1/6-em)]](https://www.rsc.org/images/entities/char_2009.gif) 9
9![[thin space (1/6-em)]](https://www.rsc.org/images/entities/char_2009.gif) :
:![[thin space (1/6-em)]](https://www.rsc.org/images/entities/char_2009.gif) 1
1![[thin space (1/6-em)]](https://www.rsc.org/images/entities/char_2009.gif) :
:![[thin space (1/6-em)]](https://www.rsc.org/images/entities/char_2009.gif) 143, and the sol–gel solution was agitated at 80 °C. The porous titanium tube was then placed in a flask with a dropping funnel filled with the precursor solution. After exhausting the air, the funnel stopcock was opened, and the precursor solution was added to flask. With the help of atmospheric pressure, the micropores and the nanochannels of TiO2-NTs on the base were filled with the precursor solution. After being soaked in the precursor solution for 1 min, the sample was dried at 100 °C for 20 min and then heated in air for 1 h at 500 °C at a heating rate of 1.5 °C min−1. These operations were repeated 12 times to achieve a stable coating of the TiO2-NT/SnO2–Sb tubular porous electrode. Practically, for the first 6 times, the precursor solution was mixed with distilled water at a ratio of 1
143, and the sol–gel solution was agitated at 80 °C. The porous titanium tube was then placed in a flask with a dropping funnel filled with the precursor solution. After exhausting the air, the funnel stopcock was opened, and the precursor solution was added to flask. With the help of atmospheric pressure, the micropores and the nanochannels of TiO2-NTs on the base were filled with the precursor solution. After being soaked in the precursor solution for 1 min, the sample was dried at 100 °C for 20 min and then heated in air for 1 h at 500 °C at a heating rate of 1.5 °C min−1. These operations were repeated 12 times to achieve a stable coating of the TiO2-NT/SnO2–Sb tubular porous electrode. Practically, for the first 6 times, the precursor solution was mixed with distilled water at a ratio of 1![[thin space (1/6-em)]](https://www.rsc.org/images/entities/char_2009.gif) :
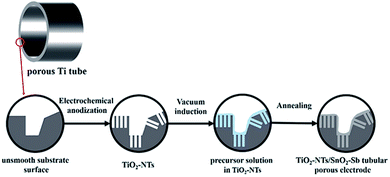
:![[thin space (1/6-em)]](https://www.rsc.org/images/entities/char_2009.gif) 1 prior to usage to guarantee its entry into the pores and nanochannels of the TiO2-NTs. For comparing the electrodes in different substrate structures, the TiO2-NT/SnO2–Sb electrode and SnO2–Sb tubular porous electrode were also prepared using the same methods. The details of the formation process of the TiO2-NT/SnO2–Sb tubular porous electrode are shown in Fig. 1.
1 prior to usage to guarantee its entry into the pores and nanochannels of the TiO2-NTs. For comparing the electrodes in different substrate structures, the TiO2-NT/SnO2–Sb electrode and SnO2–Sb tubular porous electrode were also prepared using the same methods. The details of the formation process of the TiO2-NT/SnO2–Sb tubular porous electrode are shown in Fig. 1.
2.4 Characterizations
The microstructure and morphology of the TiO2-NTs and electrode were characterized by FE-SEM (Zeiss Auriga) at a primary electron energy of 20 kV. The composition of the coating was evaluated by EDS and XRD (Bruker-AXS D8 Advance) with Cu-Kα radiation (0.154 nm). The scanning rate was 2° in the 2θ mode from 20° to 80° and analyzed by the JADE 6.0 software. Specific surface area of the electrode was measured by N2 adsorption/desorption isotherm (Micrometrics ASAP-2020). The amount of SnO2–Sb coating was calculated by the difference in the weight of the Ti substrate and the prepared electrodes.Accelerated service lifetime test was performed to test the stability of the electrode. Considering the time of the experiment, the test was carried out in 0.5 M H2SO4 at a anodic current density of 0.2 A cm−2. The electrode was considered as deactivated when the potential increased over its initial value. CVs and LSVs were obtained to evaluate the electrochemical performance of the electrodes. CVs were determined in the range of 0.0–2.0 V (vs. Ag/AgCl) at a scan rate of 10–250 mV s−1 in 0.5 M H2SO4 solutions through the electrochemical workstation (CH CHI660e) in a three-electrode system. LSVs of the anodes were measured in the range of 0.5–2.5 V (vs. Ag/AgCl) at a scan rate of 2 mV s−1 in a 0.1 M Na2SO4 solution using the same device. A platinum sheet was used as an auxiliary electrode and a silver–silver chloride electrode (Ag/AgCl) served as a reference electrode. The voltammetric charges (q*) were calculated by the graphical integration of the CVs.
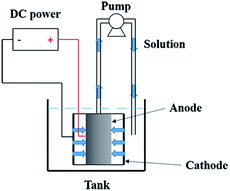
Electrochemical oxidation of pyrimidine was carried out in a electrocatalytic reactor that was composed of an anode (the prepared electrode), a cathode (stainless steel tube), a pump, a tank, and a DC power source. Schematic of the reactor is shown in Fig. 2. The length of both the anode and cathode was 20.0 mm. The applied current density was 10 mA cm−2. The solution of pyrimidine (400 mL, 100 mg L−1 pyrimidine and 5.0 g L−1 Na2SO4) was pumped from a beaker through the anode membrane at a flow rate of 8 mL s−1 that was controlled by a peristaltic pump. All experiments were conducted with circulation of the solution. The removal efficiency of pyrimidine was evaluated by high performance liquid chromatography (HPLC) using Waters 1525 system equipped with a diode array detector and a Boston ODS (5 lm, 4.6 mm × 250 mm) column. Chemical oxygen demand (COD) of the solutions was analyzed according to standard methods.
Pyrimidine removal efficiency (%), COD removal efficiency (%), and the electric energy consumption (EEC) were determined according to our previous works.34
3 Results and discussion
3.1 Structural and morphological characteristics
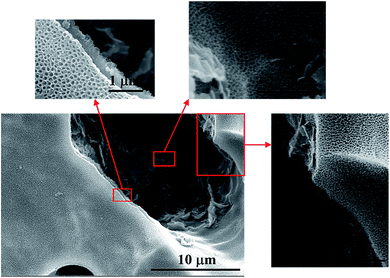
Fig. 3d shows the microstructures of a porous Ti tube obtained via FE-SEM; this tube was selected as a substrate for the SnO2–Sb electrode. It was observed that the porous Ti tube consisted of numerous Ti particles with rough surface. The structure contributed to be covered by more precursor solution. The pores between these Ti particles were well connected and formed a pore-network structure; this allowed the solution to flow through the porous Ti tube via a peristaltic pump. The morphology of the TiO2-NTs prepared on the porous Ti tube is shown in Fig. 4. It was observed that the TiO2-NTs were successfully fabricated on the porous Ti tube via electrochemical anodization, either on the surface of the substrate or on the bottom of the pore. These TiO2-NTs were well-ordered, with high-density, and vertically oriented, with circular and oval openings on the tube tops, and their diameters ranged in size from 80 nm to 100 nm with about 10 nm wall thickness. Different from the conventional TiO2-NTs on the Ti sheet, the TiO2-NTs prepared on the porous Ti tube grew in several directions and showed a 3-dimensional vertical structure as the surface undulates.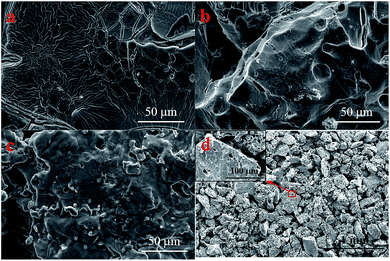 | ||
| Fig. 3 FE-SEM images of the (a) TiO2-NT/SnO2–Sb electrode; (b) SnO2–Sb tubular porous electrode; (c) TiO2-NT/SnO2–Sb tubular porous electrode; and (d) porous Ti tube. | ||
A comparison between three different electrodes in terms of their surface morphology was carried out, as shown in Fig. 3. The SnO2–Sb coating shown in Fig. 3a had wrinkled and cracked mud, which was ascribed to the non-uniformity in the brushing process. While the coating in tubular electrodes exhibited a smooth surface and no cracks, as shown in Fig. 3b. Apparently, a similar structure can be observed on the surface of the TiO2-NT/SnO2–Sb tubular porous electrode. The explanation could be that the coating surface morphology of the electrode was also affected by the structure of its substrate. Further explanation could be that the porous structure provided enough space to deal with the coating volume changes during the heating progress, and the coating could bear more stress. In short, the structure and morphology of titanium bases were crucial elements for the growth of the coating or the lifetime of the electrode. Therefore, the SnO2–Sb coating of the tubular porous electrode had a better coverage and lesser cracks; this could result in its super performance in terms of the service lifetime.
Fig. 5a shows the image of the TiO2-NT/SnO2–Sb tubular porous electrode after one time preparation process. As can be seen from the image, the precursor was induced into the channels of TiO2-NTs under the propulsive effect of vacuum pressure and capillary action. Some channels were fully covered, whereas some were still empty. This phenomena was also observed in Wei's research.35 The coating in the first 6 time preparation processes was not as thick as that in the last 6 time preparation processes, but the coating surfaces were smooth and compact during the entire process.
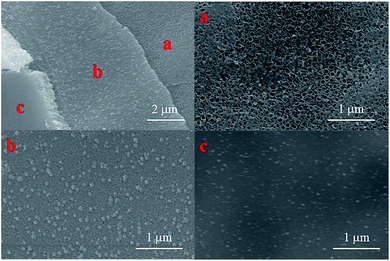 | ||
| Fig. 5 FE-SEM images of the TiO2-NT/SnO2–Sb tubular porous electrode with (a) 1 time preparation processes; (b) first 6 times preparation processes; and (c) last 6 times preparation processes. | ||
The elemental content of the electrodes were detected by EDS analysis. According to the EDS spectra shown in Fig. 6, the Sn, Sb, and O peaks for each electrode can be clearly observed, which indicate that the mixed oxides of Sn and Sb have been successfully coated on the surface of the electrode. Little Ti peaks were also found in the spectra. Table 1 shows the results of the quantitative analysis. The Ti content of the TiO2-NT/SnO2–Sb plate electrode was much less than that of the TiO2-NT/SnO2–Sb tubular porous electrode, and there were no significant differences in the O, Sb, and Sn contents among the three electrodes. The covering of SnO2–Sb on the tubular porous electrode was much better than that on the plate electrode; this result was consistent with the SEM results.
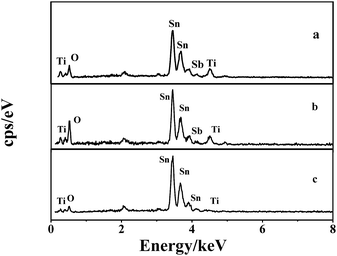 | ||
| Fig. 6 EDS spectrums of the (a) TiO2-NT/SnO2–Sb electrode; (b) SnO2–Sb tubular porous electrode; and (c) TiO2-NTs/SnO2–Sb tubular porous electrode. | ||
| Electrode | O (wt%) | Ti (wt%) | Sn (wt%) | Sb (wt%) |
|---|---|---|---|---|
| TiO2-NT/SnO2–Sb plate electrode | 40.41 | 5.26 | 51.75 | 2.58 |
| SnO2–Sb tubular porous electrode | 37.62 | 4.52 | 55.15 | 2.71 |
| TiO2-NT/SnO2–Sb tubular porous electrode | 17.94 | 0.78 | 76.56 | 4.72 |
XRD analysis was used to analyse the crystalline structure and chemical composition of the electrode coating, as shown in Fig. 7. The strong SnO2 diffraction peaks, which are assigned to the (110), (101), (200), and (211) crystal planes, can be clearly observed at 26.7°, 33.9°, 38.0°, and 51.9°, respectively. The diffraction peaks matched well with the data of the SnO2 card (JCPDS card no: 41-1445), indicating a tetragonal rutile structure. The Ti diffraction peaks corresponding to (101) and (103) were found at 2θ = 40.2° and 70.7°, respectively. The adaptation between the peak positions and reflection of Ti (JCPDS card no: 44-1294) represented a hexagonal structure of Ti. Moreover, the EDS analysis proved the existence of antimony, but the diffraction peaks corresponding to antimony oxides could not be found in any patterns. This is because the Sb phase is particularly well doped in the lattice of SnO2 and a metastable solid solution of SnO2–SbOx is formed.31
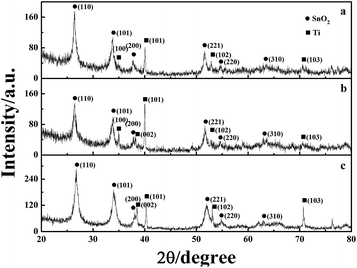 | ||
| Fig. 7 XRD patterns of the (a) TiO2-NT/SnO2–Sb tubular porous electrode; (b) SnO2–Sb tubular porous electrode; and (c) TiO2-NT/SnO2–Sb electrode. | ||
Specific surface areas of the electrodes were measured by the N2 adsorption/desorption method. The results are summarized in Table 2. The specific surface areas of the TiO2-NT/SnO2–Sb electrode, SnO2–Sb tubular porous electrode, and TiO2-NT/SnO2–Sb tubular porous electrode were 0.008 m2 g−1, 0.321 m2 g−1, and 0.387 m2 g−1, respectively. It can be found that the BET surface area of the tubular porous electrode is much larger than that of the plate electrode. Based on this result, the real effective surface of the tubular porous electrode was also larger than that of the plate electrode in the same geometrical areas, which was vital for improving the electrochemical activity of it.
| Electrode | Size (mm) | Weight (g) | BET surface area (m2 g−1) |
|---|---|---|---|
| TiO2-NT/SnO2–Sb plate electrode | 5 × 5 | 0.063 | 0.008 |
| SnO2–Sb tubular porous electrode | 5 × 5 | 0.096 | 0.321 |
| TiO2-NT/SnO2–Sb tubular porous electrode | 5 × 5 | 0.102 | 0.387 |
3.2 Electrochemical stability
Electrochemical stability of the electrode was evaluated by the accelerated lifetime test, which was a key instruction in practical application for wastewater treatment.14 As per the experimental results shown in Table 3, the accelerated lifetimes of the SnO2–Sb plate electrode, TiO2-NT/SnO2–Sb electrode, SnO2–Sb tubular porous electrode, and TiO2-NT/SnO2–Sb tubular porous electrode were 0.8 h, 6.3 h, 43.5 h, and 68.9 h, respectively. Obviously, the accelerated lifetime of the TiO2-NT/SnO2–Sb tubular porous electrode was 10.9 times than that of the TiO2-NT/SnO2–Sb plate electrode and 1.6 times than that of the SnO2–Sb tubular porous electrode. In other words, the tubular porous electrodes had better electrochemical stability than the plate electrodes, and the TiO2-NT-based SnO2–Sb electrodes had better electrochemical stability than the plate titanium-based SnO2–Sb electrodes.| Electrode | Loading amount of Sb–SnO2 (mg cm−2) | Service life (h) |
|---|---|---|
| SnO2–Sb plate electrode | 5.1 | 0.8 |
| TiO2-NT/SnO2–Sb plate electrode | 8.2 | 6.3 |
| SnO2–Sb tubular porous electrode | 40.0 | 43.5 |
| TiO2-NT/SnO2–Sb tubular porous electrode | 42.2 | 68.9 |
The two main factors i.e. the base type and TiO2-NT array were devoted to improve the combination between the coating and base, which could improve the Sb–SnO2 loading amount in consequence. Note that the Sb–SnO2 loading amounts of the plate electrode and TiO2-NT/SnO2–Sb electrode were 5.1 mg cm−2 and 8.2 mg cm−2, whereas those of the SnO2–Sb tubular porous electrode and TiO2-NT/SnO2–Sb tubular porous electrode were 40.0 mg cm−2 and 42.2 mg cm−2, respectively. Owing to the porous structure, the porous Ti tube could provide much more space for SnO2–Sb coatings than the Ti sheet. The huge SnO2–Sb loading amount in the tubular electrode was beneficial for prolonging the lifetime of the electrode. The surface increase in the tubular titanium was much larger than that in the TiO2-NT array. Hence, as compared to that of the SnO2–Sb plate electrode, the accelerated lifetime of the TiO2-NT/SnO2–Sb tubular porous electrode greatly increased as the Sb–SnO2 loading amount increased. It is also believed that the uneven interface between the Ti substrate and Sb–SnO2 coatings results in the exfoliation of the Sb–SnO2 coatings and reduction of the service lifetime.36 The TiO2-NTs were prepared on the tubular porous Ti substrate to establish a micro stake structure between TiO2-NTs and Sb–SnO2 coatings that could logically combine the substrate and SnO2 coatings firmly and uniformly. The service lifetime was enhanced as TiO2-NTs were used in different base materials. Hence, in the plate electrode, the accelerated lifetime of TiO2-NT/SnO2–Sb increased 7.9 times that of the Ti/SnO2–Sb electrode. Based on the abovementioned two effects, the TiO2-NT/SnO2–Sb tubular porous electrode achieved a much longer service lifetime of 68.9 h in all the SnO2–Sb electrodes, which was 10.9 times that of the TiO2-NT/SnO2–Sb plate electrode.
3.3 Electrochemical characteristics of the electrodes
OEP was used to evaluate the electrochemical performance of the electrodes in the electrochemical oxidation degradation. For the electrode, a higher OEP indicates fewer side oxygen evolution reactions (OER) and less power wastage, which also means higher electrocatalytic oxidation efficiency. LSV measurements were applied to detect the OEP of the electrode, as shown in Fig. 8. The OEP of the TiO2-NT/SnO2–Sb electrode was 1.67 V (vs. Ag/AgCl), which was lower than that of the SnO2–Sb tubular porous electrode. Moreover, the TiO2-NT/SnO2–Sb tubular porous electrode had the highest OEP of 1.85 V (vs. Ag/AgCl), indicating its better electrocatalytic performance among the three electrodes. The improvement of OEP was due to the larger surface areas of the TiO2-NT porous structure that provided more active reaction sites and less electroactivity for OER.37 As shown in Fig. 9, the increase of current density only formed by the OER can be observed, and no remarkable voltammetric feature appears in the CVs. The potential ranged from 0.3 V to 2.0 V in the case of electrode damage produced by the irreversible reduction of Sn oxide below 0.3 V.14,38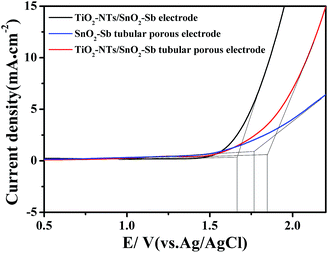 | ||
| Fig. 8 LSV curves of the TiO2-NT/SnO2–Sb electrode, SnO2–Sb tubular porous electrode, and TiO2-NT/SnO2–Sb tubular porous electrode. | ||
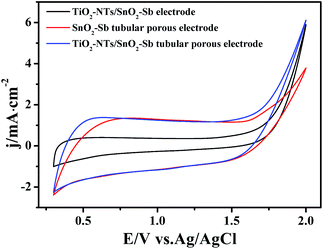 | ||
| Fig. 9 Cyclic voltammograms of the TiO2-NT/SnO2–Sb electrode, SnO2–Sb tubular porous electrode, and TiO2-NT/SnO2–Sb tubular porous electrode. | ||
The electrochemical performance is primarily affected by the electroactive surface area. Moreover, the voltammetric charge (q*) of an electrode is related to its electroactive surface area. Therefore, the voltammetric charge (q*) values can often evaluate the electrochemical performance of the electrodes. To explore the electrochemical performance, q* is usually measured by the CV method, which is calculated by the graphical integration of the CV curves. It has been reported that the potential scan rate has an impact on q*. As the potential scan rate (ν) is increased, the exchange of some charged components in less accessible parts of the electrode is hindered, and then, the voltammetric charge (q*) decreases.39,40 At high potential scan rates (ν → ∞), the electrolyte ions can only approach the most accessible electroactive sites on the outer surface of electrode, and the voltammetric charge (q*) tends to be the outer voltammetric charge  . As the potential scan rate (ν) approaches zero, all the electroactive sites take part in the charging process, and the voltammetric charge (q*) tends to be the total voltammetric charge
  . The difference between the total voltammetric charge
  and the outer voltammetric charge
  is the inner voltammetric charge
  , the charge related to the less accessible electroactive sites.
The total voltammetric charge  can be obtained by the extrapolation of q* to ν = 0 from the (q*)−1 versus ν1/2 plot according to the following equation:39
 | (1) |
As shown in Fig. 10a, it can be observed that the (q*)−1 was linearly related to ν1/2. Through the same method, the values of outer voltammetric charge  can be acquired from the extrapolation of the straight lines to ν = ∞ (ν−1/2 = 0) in the q* versus ν−1/2 plot according to the following equation:
 | (2) |
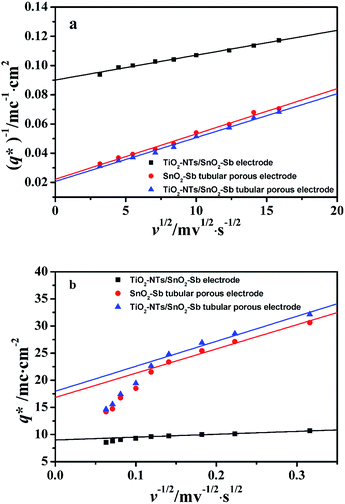 | ||
Fig. 10 Extrapolation of (a) the total voltammetric charge  and (b) the outer voltammetric charge and (b) the outer voltammetric charge  for different electrodes. for different electrodes. | ||
From Fig. 10b, some deviation can be found at high scan rates. This can be explained by the presence of some interfering factors, such as uncompensated ohmic drops in the coating or the irreversibility of the redox reaction on the electrode surface, decreasing the value of q*. Obviously, the electrochemical porosity for the electrode can be obtained through the ratio of the inner and the total charges  .
.
The  for different electrodes are summarized in the Table 4. It can be observed that the outer voltammetric charge
  of the TiO2-NT/SnO2–Sb tubular porous electrode was 17.97 mc cm−2, much higher than that of the TiO2-NT/SnO2–Sb electrode (8.98 mc cm−2), once again verifying a larger electrochemical surface area of the tubular porous electrodes. The inner voltammetric charge
  of the tubular porous electrodes greatly contributed to the increment of the total voltammetric charge
  ; this indicated a considerable amount of less accessible electroactive sites. In fact, most of these less accessible electroactive sites existed on the coating in the pores, and they were not as effective as those on specific surface area. In other words, only the coating on the outer surface of tubular porous electrode had good electrochemical activity. It was also noticed that the differences between the SnO2–Sb tubular porous electrode and TiO2-NT/SnO2–Sb tubular porous electrode in terms of
  were quite modest; this indicated that the TiO2-NTs had little effect on the electroactive surface areas for the tubular porous electrode.
3.4 Electrochemical degradation of pyrimidine
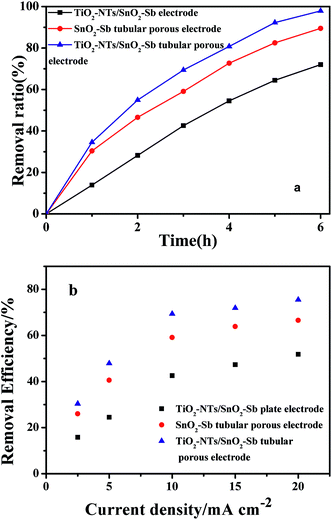
Pyrimidine was chosen as a model pollutant to further evaluate the electrocatalytic performance of the electrodes. The operation parameters, including a flow rate of 8 mL s−1, current density of 10 mA cm−2, electrolyte of 5.0 g L−1 Na2SO4, and pH of 7, were studied in our previous research34 and introduced in the experimental section. The degradation rates of 100 mg L−1 pyrimidine as a function of time in 6 h are shown in Fig. 11a. The removal efficiency at 6 h for TiO2-NT/SnO2–Sb electrode, SnO2–Sb tubular porous electrode, and TiO2-NT/SnO2–Sb tubular porous electrode was 72.0%, 89.5%, and 97.9%, respectively. Apparently, the TiO2-NT/SnO2–Sb tubular porous electrode had better electrocatalytic performance than the TiO2-NT/SnO2–Sb plate electrode at any time during the electrochemical degradation of pyrimidine. The improved electrocatalytic performance of the tubular electrode was mainly ascribed to two main reasons: the enhanced mass transfer due to faster convection and the lager active surface area.30 Therefore, pyrimidine in solution had more opportunity to contact the electrode surface; this means that the mass transfer was enhanced and the removal ratio was improved. However, as compared to the SnO2–Sb tubular porous electrode, the removal ratio for the TiO2-NT/SnO2–Sb tubular porous electrode was improved about 8.4%. This was ascribed to the fact that there was no obvious difference in the electrochemical performance owing to the similar specific surface area and Sb–SnO2 loading amount of both tubular porous electrodes.Furthermore, the pollution degradation rate was highly related to current density during electrochemical oxidation. Herein, we investigated the effect of current density ranging from 2.5 to 20 mA cm−2 at 3 hours on the removal efficiency of pyrimidine, as shown in Fig. 11b. It can be observed that the removal efficiency increased with an increase in current density owing to the accelerated electrochemical oxidation. However, the removal efficiency in all the systems gradually increased from 10 to 20 mA cm−2; this indicated the lower current efficiency of the process. One explanation could be that a large number of side reactions such as OER and electrolyte decomposition occurred at the electrode surface as the current density was significantly increased.41 In addition, high current could lead to thermal energy and result in a larger invalid charge consumption.30
TOC measurements of the degradation of pyrimidine solutions were conducted again, as shown in Fig. S1.† The energy consumptions were 1.32 W h L−1, 1.65 W h L−1, and 1.69 W h L−1. Compared to those of other SnO2–Sb electrodes,15 the energy consumptions in our studies were much smaller owing to the enhanced mass transfer, which was a key to improve the removal efficiency and decrease the energy consumption.
From the results of electrocatalytic oxidation for pyrimidine, it was obviously confirmed that the TiO2-NT/SnO2–Sb tubular porous electrode was superior to the TiO2-NT/SnO2–Sb plate electrode. The special porous structure of the electrode improved the electrocatalytic active sites and enhanced mass transfer via the pump. Pyrimidine could be degraded by 97.9% and COD was degraded by 79.4% in solution; this proved the excellent performance of the TiO2-NT/SnO2–Sb tubular porous electrode as compared to those of the other electrodes.
4 Conclusions
In this study, a novel TiO2-NT/SnO2–Sb tubular porous electrode was successfully prepared on a porous titanium tube with a TiO2-NT array. It was confirmed that different substrate structures have a crucial effect on the electrocatalytic performance and service lifetime of the electrode. Furthermore, the TiO2-NTs and porous tubular structure would increase the specific surface area and the Sb–SnO2 loading amount on the electrode, which could improve the electrocatalytic performance. The result of the accelerated service life test indicated that the TiO2-NT/SnO2–Sb tubular porous electrode had the longest lifetime due to the increased Sb–SnO2 loading amount and enhanced combination between the substrate and TiO2-NT coating. Moreover, the TiO2-NT/SnO2–Sb tubular porous electrode also showed best performance in the electrochemical degradation of pyrimidine owing to the enhanced mass transfer. Compared to other electrodes, the TiO2-NT/SnO2–Sb tubular porous electrode achieved 97.9% removal efficiency of pyrimidine at 6 h.Acknowledgements
This work was supported by the National Science Technology Support Plan of China (2014BAC08B03) and Natural Science Foundation of China (51578287).References
- K. Kümmerer, A. Haiß, A. Schuster, A. Hein and I. Ebert, Environ. Sci. Pollut. Res., 2016, 23, 14791–14804 CrossRef PubMed.
- J. O. Straub, Integr. Environ. Assess. Manage., 2010, 6, 540–566 CAS.
- C. A. Martinez-Huitle and S. Ferro, Chem. Soc. Rev., 2006, 35, 1324–1340 RSC.
- F. C. Walsh, Pure Appl. Chem., 2001, 73, 1819–1837 CrossRef CAS.
- D. Shao, X. L. Li, H. Xu and W. Yan, RSC Adv., 2014, 4, 21230–21237 RSC.
- T. Wu, G. H. Zhao, Y. Z. Lei and P. Q. Li, J. Phys. Chem. C, 2011, 115, 3888–3898 CAS.
- Y. Duan, Y. Chen, Q. Wen and T. G. Duan, J. Electroanal. Chem., 2016, 768, 81–88 CrossRef CAS.
- C. Bock and B. MacDougall, J. Electroanal. Chem., 2000, 491, 48–54 CrossRef CAS.
- X. M. Chen and G. H. Chen, Electrochim. Acta, 2005, 50, 4155–4159 CrossRef CAS.
- C. P. De Pauli and S. Trasatti, J. Electroanal. Chem., 2002, 538, 145–151 CrossRef.
- M. Panizza and G. Cerisola, Electrochim. Acta, 2004, 49, 3221–3226 CrossRef CAS.
- S. Ardizzone, C. L. Bianchi, G. Cappelletti, M. Ionita, A. Minguzzi, S. Rondinini and A. Vertova, J. Electroanal. Chem., 2006, 589, 160–166 CrossRef CAS.
- D. L. He and S. I. Mho, J. Electroanal. Chem., 2004, 568, 19–27 CrossRef CAS.
- Y. Chen, L. Hong, H. Xue, W. Han, L. Wang, X. Sun and J. Li, J. Electroanal. Chem., 2010, 648, 119–127 CrossRef CAS.
- J. Niu, Y. Li, E. Shang, Z. Xu and J. Liu, Chemosphere, 2016, 146, 526–538 CrossRef CAS PubMed.
- W. Wu, Z.-H. Huang and T.-T. Lim, RSC Adv., 2015, 5, 32245–32255 RSC.
- Y.-H. Cui, Q. Chen, J.-Y. Feng and Z.-Q. Liu, RSC Adv., 2014, 4, 30471 RSC.
- L. M. Da Silva, K. C. Fernandes, L. A. De Faria and J. F. C. Boodts, Electrochim. Acta, 2004, 49, 4893–4906 CrossRef CAS.
- V. Panic, A. Dekanski, V. B. Miskovic-Stankovic, S. Milonjic and B. Nikolic, J. Electroanal. Chem., 2005, 579, 67–76 CrossRef CAS.
- G. H. Zhao, X. Cui, M. C. Liu, P. Q. Li, Y. G. Zhang, T. C. Cao, H. X. Li, Y. Z. Lei, L. Liu and D. M. Li, Environ. Sci. Technol., 2009, 43, 1480–1486 CrossRef CAS PubMed.
- Y. L. Pang, S. Lim, H. C. Ong and W. T. Chong, Appl. Catal., A, 2014, 481, 127–142 CrossRef CAS.
- Y. Wang, Y. He, Q. Lai and M. Fan, J. Environ. Sci., 2014, 26, 2139–2177 CrossRef PubMed.
- H. Z. Cao, D. H. Lu, J. P. Lin, Q. Ye, J. J. Wu and G. Q. Zheng, Electrochim. Acta, 2013, 91, 234–239 CrossRef CAS.
- J. Wu, H. Xu and W. Yan, RSC Adv., 2015, 5, 19284–19293 RSC.
- H. Ou and S. Lo, Sep. Purif. Technol., 2007, 58, 179–191 CrossRef CAS.
- X. Cui, G. H. Zhao, Y. Z. Lei, H. X. Li, P. Q. Li and M. C. Liu, Mater. Chem. Phys., 2009, 113, 314–321 CrossRef CAS.
- J. Yoshida, K. Kataoka, R. Horcajada and A. Nagaki, Chem. Rev., 2008, 108, 2265–2299 CrossRef CAS PubMed.
- J. M. Grau and J. M. Bisang, Chem. Eng. Process., 2011, 50, 940–943 CrossRef CAS.
- T. R. Ralph, M. L. Hitchman, J. P. Millington and F. C. Walsh, Electrochim. Acta, 1996, 41, 591–603 CrossRef CAS.
- Y. Zhang, K. Wei, W. Han, X. Sun, J. Li, J. Shen and L. Wang, Electrochim. Acta, 2016, 189, 1–8 CrossRef CAS.
- D. Li, J. Tang, X. Zhou, J. Li, X. Sun, J. Shen, L. Wang and W. Han, Chemosphere, 2016, 149, 49–56 CrossRef CAS PubMed.
- A. Xu, W. Han, J. Li, X. Sun, J. Shen and L. Wang, Chem. Eng. J., 2016, 295, 152–159 CrossRef CAS.
- I. D. Santos, S. B. Gabriel, J. C. Afonso and A. J. B. Dutra, Mater. Res., 2011, 14, 408–416 CrossRef CAS.
- Y. Zhang, T. Yu, W. Han, X. Sun, J. Li, J. Shen and L. Wang, Electrochim. Acta, 2016, 220, 211–221 CrossRef CAS.
- K. Wei, Y. Wang, W. Han, J. Li, X. Sun, J. Shen and L. Wang, J. Power Sources, 2016, 318, 57–65 CrossRef CAS.
- P. Q. Li, G. H. Zhao, X. Cui, Y. G. Zhang and Y. T. Tang, J. Phys. Chem. C, 2009, 113, 2375–2383 CAS.
- L. C. Zhang, L. Xu, J. He and J. J. Zhang, Electrochim. Acta, 2014, 117, 192–201 CrossRef CAS.
- G. H. Chen, X. M. Chen and P. L. Yue, J. Phys. Chem. B, 2002, 106, 4364–4369 CrossRef CAS.
- F. Montilla, E. Morallon, A. De Battisti and J. L. Vazquez, J. Phys. Chem. B, 2004, 108, 5036–5043 CrossRef CAS.
- R. Berenguer, C. Quijada and E. Morallón, Electrochim. Acta, 2009, 54, 5230–5238 CrossRef CAS.
- M. Panizza, P. A. Michaud, G. Cerisola and C. Comninellis, J. Electroanal. Chem., 2001, 507, 206–214 CrossRef CAS.
Footnote |
| † Electronic supplementary information (ESI) available. See DOI: 10.1039/c7ra05127a |
| This journal is © The Royal Society of Chemistry 2017 |

