 Open Access Article
Preparation and characterization of microporous carbon spheres from high amylose pea maltodextrin†
Anastasia Anceschia,
Giuliana Magnaccaa,
Francesco Trottaa and
Marco Zanetti *ab
*ab
aUniversity of Turin, Department of Chemistry, NIS Centre, INSTM, Via P. Giuria 7, 10125 Torino, Italy. E-mail: marco.zanetti@unito.it
bUniversity of Turin, ICxT Centre, Lungo Dora Siena, 100, 10153 Torino, Italy
First published on 20th July 2017
Abstract
Porous carbon materials have attracted great interest for their many industrial applications. They have been synthetized using different routes in the way to tailor the physical properties of the materials. In this article, porous carbon materials have been prepared by direct pyrolysis of the hyper cross-linked polymer, known as a nanosponge, obtained by the reaction between Kleptose Linecaps® and pyromellitic dianhydride. The carbon produced shows a very narrow pore size distribution, in the range of 5–17 Å. Moreover, the porous carbon material has a spherical shape as revealed by SEM analysis. In the end, the TGA and the FT-IR analyses clarified the thermal behaviors of the material and demonstrated that the nanosponge is suitable precursor for the production of microporous carbon spheres.
Introduction
One of the approaches for mitigating potential global climate change due to anthropogenic emissions of CO2 and other greenhouse gases is the capture of CO2 from fossil fuels and storing it in geologic or oceanic reservoirs,1 which can then be used as a CO2 feedstock.2,3 Porous materials are becoming a well assessed strategy to capture gasses due to the possibility to tailor their properties based on specific applications. For this reason, many research groups study the novel synthesis or improvement in the performance of different classes of porous materials, such as metal organic framework (MOFs),4–6 porous organic polymers (POPs),7 zeolites,8 covalent organic framework (COFs)9 and porous carbons.10 Among these materials, porous carbon ones have received great attention due to their many applications such as gas separation and purification,11 catalyst support,12 fuel cell,13 and supercapacitors.14According to the IUPAC classification, the porous materials can be classified in three categories, based on their pore size:15 microporous materials having pores of diameter size less than 2 nm; mesoporous materials having pores with diameter size in the range from 2 to 50 nm and macroporous materials having pores with diameter size higher than 50 nm.
The structure of porous carbon materials can be described as a twisted network of defective hexagonal carbon layer planes cross-linked by aliphatic bridging groups. Thus, the material remains amorphous as the network inhibits reordering of the structure.16 Amorphous carbon is the term used for indicating the residue obtained after the pyrolysis of a carbonaceous matter and it has been described as sp2 hybridized graphite-like layers.17 The improvement in science and technology made possible to synthesize different kinds of porous carbon materials with well-defined structure and morphology. Typically, they are created through the thermal treatment of carbon precursor, such as mushrooms,18 corn,19 biomasses,20 fish scales,21 starch11 and polymers.22 After the carbonization, the porous carbon obtained could be activated in the way to increase the specific surface area and the porosity.17 Various methods have been applied for obtaining porous carbon materials, such as: chemical and physical activation and a combination of the two processes; pyrolysis of carbonaceous matters; catalytic activation of carbon precursor using metal salts or organometallic compounds; inorganic template synthesis.15 So far, many types of porous carbon materials with different morphology, specific surface area and porosity have been prepared through different processes using various precursors. Recently, researchers focused their attention on the transformation of polysaccharides into porous carbon materials. Many types of polysaccharides can be used as carbon source, actually starch. Starch is a polymeric carbohydrate consisting of anhydroglucose units linked together primarily through α-(1,4) glucosidic bonds. It contains two microstructures. The first is amylose, a linear structure of α-1,4 linked glucose units. The second is the amylopectin, a high branched structure composed by of short α-1,4 chains linked by α-1,6 bonds.23 The ratio of amylose/amylopectin depends on the source and age of the starch. Wang et al.24 prepared carbon spheres using porous starch as a precursor. However, the procedure was rather complex. In details, the porous starch was prepared mixing the corn-starch in an acetic acid–sodium acetate solution and, then, an enzyme mixture was added in order to create a porous structure. After that, the porous starch was mixed with various inorganic coating and heated up to 600 °C in a tubular furnace. After the carbonization, the coating agent has been removed with aqueous HF leaving mesoporous carbon spheres. Pang et al. reported the fabrication of porous carbon with a high specific surface area of 1239 m2 g−1 and a large pore volume of 1.40 cm3 g−1 from corn starch by a two-step process: hydrothermal carbonization followed by a chemical activation with H3PO4.25
A simpler methodology to prepare porous carbon from starch without any templating agent has been proposed by Budarin et al.26 They obtained mesoporous carbon with a pore size of 7 nm pyrolyzing under nitrogen flow a porous starch patented with the name of Starbone®. However, the total porosity of this carbon is not well known since the pore diameter was assessed by TEM while the specific surface area was not measured.
Therefore, our research group recently studied the possibility to produce porous carbon materials with a quite high specific surface area, 560 m2 g−1, and a narrow pore size distribution in the range of 5–16 Å pyrolyzing a hyper cross-linked polymer derived from polysaccharides, also known as nanosponges (NS),.27 NS can be made of many different organic and inorganic materials. The most common NS are made by cyclodextrins with several cross-linking agents; these include diisocyanates,28 diarylicarbonates and carbonyl diimidazoles,29 carboxylic acids dianhydride30 and 2,2-bis(acrylamido)acetic acid.31
In the present study, the synthesis of NS with a new polysaccharide, the Kleptose Linecaps® (LC)32 was considered. The LC is a soluble high amylose starch obtained by the partial hydrolysis of pea starch and it has a molecular weight of about 12 kDa. The LC is composed by 40% of amylose and the remaining 60% is glucose, oligosaccharides and polysaccahrides (amylopectin). It has a helical design with an inner hydrophobic surface and an outer hydrophilic surface. This particular structure allows the LC to be cross-linked with various agents, such as dianhydride, carbonyldiimidazoles and diisocyanates.32 By this reaction an hyper-crosslinked polymer is obtained and it is possible to call this structure nanosponge. In this paper, it is reported a method for preparing porous carbon materials with quite high surface area and a narrow pore size distribution using as carbon precursor the Linecaps nanosponges (LNS) synthetized by the reaction of the LC with the pyromellitic dianhydride (PMDA).
Materials and methods
Materials
The Kleptose Linecaps® (Lc) was provided by the Roquette Italia SPA (Cassano Spinola, Al, Italy) while the pyromellitic dianhydride (PMDA), dimethyl sulfoxide (DMSO), acetone and triethylamine were purchased from Sigma-Aldrich and used without any further purification.Synthesis of nanosponges
4.89 g of LC were solubilized under continued stirring in 20 mL of DMSO in a 100 mL flask. 5 mL of triethylamine and then 3.76 g of pyromellitic dianhydride were added. The molar ratio between the initial maltodextrin and pyromellitic dianhydride was 1![[thin space (1/6-em)]](https://www.rsc.org/images/entities/char_2009.gif) :
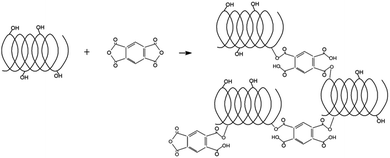
:![[thin space (1/6-em)]](https://www.rsc.org/images/entities/char_2009.gif) 0.57 expressed as molar ratio of one mole of glucose of the maltodextrin with respect to 0.57 moles of pyromellitic dianhydride. After a few minutes, the gelation process occurred. After 24 hours, the reaction was considered complete. In the following days, the polymer was ground in a mortar and washed with deionized water in a Buchner funnel. After the air drying, the polymer was purified in a Soxhlet extractor with acetone for a total time of about 14 hours. Scheme 1 represents the LC and the LNS.
0.57 expressed as molar ratio of one mole of glucose of the maltodextrin with respect to 0.57 moles of pyromellitic dianhydride. After a few minutes, the gelation process occurred. After 24 hours, the reaction was considered complete. In the following days, the polymer was ground in a mortar and washed with deionized water in a Buchner funnel. After the air drying, the polymer was purified in a Soxhlet extractor with acetone for a total time of about 14 hours. Scheme 1 represents the LC and the LNS.
Synthesis of the carbons
2 g of LC and LNS were put in an alumina combustion boat and then pyrolyzed using a Lenton 1200 tubular furnace. The samples were heated to 800 °C with a temperature ramp of 10 °C min−1 in nitrogen flux (65 mL min−1). The furnace was left cool under nitrogen flux until the room temperature was reached.Gas-volumetric analysis
The carbons obtained after the pyrolysis process were characterized by nitrogen adsorption–desorption isotherms at 77 K obtained with an automatic adsorption instrument (ASAP 2010, Micromeritics). The samples were outgassed at 300 °C and then cooled to nitrogen boiling temperature (77 K) and exposed at a series of precisely controlled doses of nitrogen gas (from 0 to 1 of nitrogen relative pressure). Each pressure is recorded and the universal gas law is applied to determine the quantity of gas adsorbed. The adsorption proceeds filling first micropores and, then, mesopores and macropores. The process ends to the point of bulk condensation of the analysis gas. Then, the desorption process begins. These two sets of data describe the adsorption and desorption isotherms. The analysis of the isotherms yields information about the surface extension of the material. Many models can be applied for evaluating the physical characteristic of the samples, in our case the models used for obtaining the specific surface area was the Langmuir equation, suitable for estensively microporous materials. The volume and the pore size distribution were determined with Density Functional Theory method (DFT) assuming a slit geometry of the pores.Attenuated total reflection
Attenuated total reflection (ATR) (Perkin-Elmer Spectrum 100) was used for collecting the spectra of the residues obtained at different temperatures after TGA experiments. In the typical experiment, 16 scans were recorded in the range of 4000–650 cm−1 at 4 cm−1 resolution (Globar source, DTGS detector).Scanning electron microscopy
The Scanning Electron Microscopy (SEM) was applied for investigating the morphology of the samples before and after the pyrolysis processes. Samples were mounted on metallic stubs with double-sided conductive tape and ion coated with gold by a sputter coater (Bal-tec SCD 050) for 60 s under vacuum at a current intensity of 40 mA (gold deposited layer of about 20 nm of thickness).Transmission electron microscopy
The structural characterization of the samples was carried out using a High Resolution Transmission Electron Microscopy (HRTEM) using a Jeol JEM 3010 (300 kV acceleration voltage) microscope equipped with a LaB6 filament. For the analysis, the sample was mounted on the copper grid covered by a porous carbon film. An Ultrascan 1000 camera was applied for the acquisition of the micrographs.Thermogravimetric analysis
The thermogravimetric analysis (TGA) was performed in a TGA 2950 balance (TA Inc.) on the LC and LC 1:0.57 PMDA. Specifically, 15 mg of the samples were placed in an alumina sample pan and then heated to 800 °C under nitrogen flow with a heating rate of 10 °C min−1.Results and discussion
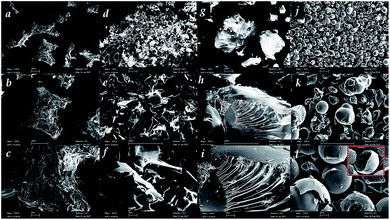
The Linecaps (LC) and the Linecaps nanosponges (LNS) were subjected to a pyrolysis process for obtaining carbons, named C-LC and C-LNS, respectively. SEM was used to characterize the morphology of all these materials at 100, 200 and 500 magnifications. In Fig. 1 panels a–c, the LC shows a granular morphology and at higher magnification it is possible to see that the surface is rough and jagged.The particle size distribution is quite homogeneous and the average size is about 20 μm. The carbon obtained from the pyrolysis of the LC is depicted in Fig. 1, panels d–f. The carbon particles have a very heterogeneous morphology with a broad particle size distribution varying from 5 to 10 μm. This peculiar morphology could relate to pathway followed by the LC in the thermal degradation. In details, during the heating treatment, the LC softens until the thermal degradation temperature is reached. This means that the pyrolysis process takes place on a fluid substrate and two competitive processes occur: volatilization, due to the breakage of the constituent bond, and charring, causing the reorganization of LC bonds. Thus, the morphology of the char is a consequence of the competition between escape of the volatile products and the solidification of the substrate. From the Fig. 1d–f, the volatiles have generated bubbles that burst before the solidification of the char.
In Fig. 1, panels g–i, it is possible to see the morphology of the LNS before the pyrolysis. The LNS shows a polyhedric shape of the particles. This morphology is the result of the grinding process carried out after the synthesis. Indeed, the synthesis of the NS leads to the formation of a solid block that requires to be grinded to obtain a homogeneous powder with a particle size about 200 μm. As it can be seen in panels j–l, the resulting carbon from LNS is composed of homogeneous spherical particles with a smooth surface. This implies that the starting polyhedric particles passed through a fluid phase before carbonization. The surface tension of the fluid drives to the formation of particles with a spherical morphology. Moreover, the NS does not fluidize enough to allow the formation of bubble as in the case of LC. For better explain this phenomenon, an inset in panel l shows a single sphere broken after a mortar grinding. Interestingly, the particle is hollow, indicating that after the charring of the surface, the volatile product of the thermal degradation belongs essentially to the core of the particles. Since the surfaces of the spheres observed are almost regular and unbroken, the volatile from the core permeated trough the spheres walls. Also, it is interesting to note that these particles are not stuck to each other but are physically distinct, probably because the permeating volatiles contributes to maintain separated the surfaces, avoiding sintering process.
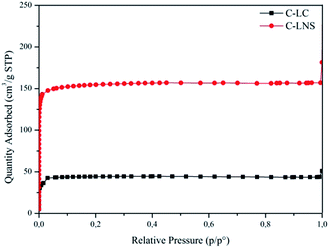
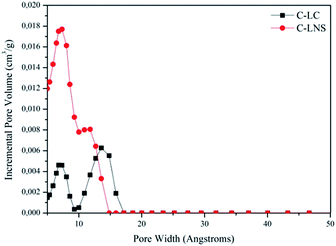
Having recognized the peculiar morphology of the carbons, it is useful to understand the actual structure of the samples. Therefore, the study of the porosity of the C-LC and C-LNS was carried out. The trend of the adsorption–desorption isotherms and the corresponding pore size distribution curves (Fig. 2 and 3) shows clearly that the pyrolysis generates microporous materials. No capillary condensation phenomena can be observed. Indeed, the C-LC and C-LNS isotherms correspond to Type I isotherm, according to the IUPAC classification, characteristic of microporous samples. The characteristic feature of the Type 1 isotherm is a long horizontal plateau which extends up to relative pressure equal to 1. This kind of adsorption isotherm can be described by the Langmuir equation which was developed assuming the homogeneity of the surface and the adsorption phenomenon is limited to the monolayer. Hence, for evaluating the specific surface area of the carbons, the Langmuir equation has been applied. Otherwise, for determining the micropore volume and the pore size distribution from the adsorption isotherms, the Density Functional Theory (DFT) method, widely applied to the study of microporous carbonaceous materials, has been used assuming a slit pore geometry. However, Table 1 summarizes the adsorption parameters obtained by the analysis of the experimental adsorption data.
| Samples | Specific surface area (m2 g−1) | Micropore volume (cm3 g−1) | Pore width (Å) |
|---|---|---|---|
| C-LC | 194 | 0.05 | 5–15 |
| C-LNS | 682 | 0.16 | 5–17 |
As it can be seen in Fig. 2, the C-LNS (red curve with circular symbols) can adsorb higher amount of nitrogen than the C-LC (black curve with square symbols), resulting in a higher specific surface area (682 m2 g−1 with respect to 194 m2 g−1) and a more extended microporosity (0.16 cm3 g−1 with respect to 0.05 cm3 g−1).
Fig. 3 depicts the DFT elaboration of the adsorption data in the way to have a graphical representation of the pore distributions and of the pore diameter size. All the curves start from 5 Å, because this is the limit of the nitrogen measurement.
It is interesting to note the bimodal distribution of the systems porosity.
In conclusion, the carbon from LNS has a wider area and a higher porosity than the carbon from LC. This result provides evidence that the cross-linker plays an important role in the carbonization allowing a modulation of the specific surface area and microporosity of resulting carbon.
The adsorption technique is the most established method to characterize microporous materials. In a recent work,33 the porosity of the system was investigated using the HRTEM. Thus, the C-LNS was analyzed by HRTEM and the micrograph obtained are reported in Fig. 4. The expected aspect relative to an amorphous carbon is that shown in Fig. 4a, where the absence of crystalline order is clearly evidenced in the inset (reciprocal lattice image). Nevertheless, part of the images revealed the presence of an ordered defective graphitic-like structure, as evidenced by the fringe pattern not completely flat, with a distance between the planes of 3.5 Å, compatible with the presence of ultramicroporosity, often present in these kinds of carbonaceous materials. This ultramicroporosity is a natural consequence of this type of structure whereas it is chaotically arranged in graphite-like microdomains embedded in an amorphous carbon. Despite the apparent structural chaos, the sample shows a remarkably narrow pore size distribution derived from this textural misalignment.
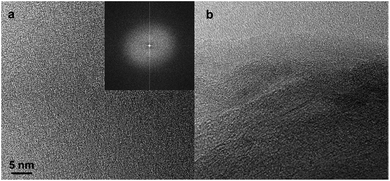 | ||
| Fig. 4 HRTEM micrographs of amorphous carbon and reciprocal lattice image (a) and ordered graphic-like structure (b). | ||
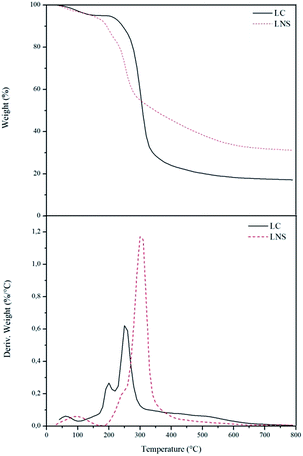
In the way to better understand the carbonization pathways of the LC and LNS, TGA were performed. Fig. 5 reports the curves of weight loss and of the rate of weight loss (DTGA) of the two samples carried out under nitrogen flux up to 800 °C.
In the thermal degradation of the LC (black solid line) three steps of degradation can be distinguished. The first one represents the evaporation/dehydration starting immediately, rising the temperature, and finishing at about 110 °C. The weight loss in this step is 5%, but it depends on the moisture content in the sample. The second step corresponds to the thermal decomposition of the LC which commences at around 200 °C and finishes at 410 °C. This is the main weight loss in which the sample loses the 76% of its initial weight. At the end, the last step occurs between 410 °C and 650 °C and represents a slow thermal degradation of the char that leads to 17% of carbon yield. The thermal profile of LNS (red dotted line) shows also three steps of degradation. The first step (around 110 °C) belongs to evaporation of the sample moisture and correspond to a 5% of weight loss. The second step takes place between 160 °C and 310 °C and is due to the thermal decomposition of the organic phase. The weight loss in this step is about 51%.
The last stage is a broad weight loss that takes place between 310 °C and 600 °C and is related to the char rearrangement. The yield of carbon in this case is 32%.
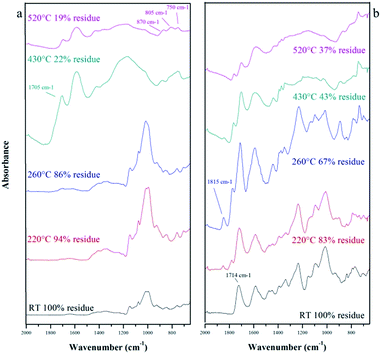
As it can be seen in Fig. 5, there are some differences between the LC and LNS reactivity. The thermal degradation step of the LNS begins at lower temperature with an amount of volatiles released lower than the LC. The pyrolysis of the LNS gives also a higher carbon yield (32% with respect to 17% in the LC case). This different thermal behavior provides further evidence that the presence of the cross-linker has a great influence on the carbonization, improving the charring reactions and consequently increasing the pyrolysis yield. The role of the cross-linker was evaluated by ATR-IR analysis. Fig. 6 shows the infrared spectra of the LC (a) and LNS (b) samples collected at different temperatures during the pyrolysis. In the bottom of the Fig. 6 it is possible to see the spectra collected at room temperature (black ones). Moving up, there are the spectra recorded at increasing pyrolysis temperature.
According to TGA, there are no relevant modifications among the spectrum at RT of the LC and the spectra collected at 220 °C and 260 °C. The first sign of degradation appears in the spectrum of the sample treated at 430 °C where a peak around 1700 cm−1, assigned to the C![[double bond, length as m-dash]](https://www.rsc.org/images/entities/char_e001.gif) O, appears. At the same temperature, a signal at 1600 cm−1 attributed to C
O, appears. At the same temperature, a signal at 1600 cm−1 attributed to C![[double bond, length as m-dash]](https://www.rsc.org/images/entities/char_e001.gif) C stretching mode of unsaturated species, appears. Increasing the temperature to 530 °C the peak around 1700 cm−1 decreases whereas in the low frequency region it is possible to see three typical signals appearing (870–806–750 cm−1) attributed to the out-of-plane aromatic C–H modes.34 The same trend of degradation is showed by LNS, but in the spectra, it is also possible to note signals belonging to PMDA, used as cross-linker, and to the bonds between the LC and the PMDA. In detail, in the spectrum of the sample non-treated it is well visible the peak at 1714 cm−1 of the ester linkage between the LC and PMDA. Increasing the temperature, this signal is shifted in frequency evidencing the scission of the ester bridge and the formation of different carbonyl species. The decomposition of the ester bond is also attested by a peak at 1815 cm−1, referred to the C
C stretching mode of unsaturated species, appears. Increasing the temperature to 530 °C the peak around 1700 cm−1 decreases whereas in the low frequency region it is possible to see three typical signals appearing (870–806–750 cm−1) attributed to the out-of-plane aromatic C–H modes.34 The same trend of degradation is showed by LNS, but in the spectra, it is also possible to note signals belonging to PMDA, used as cross-linker, and to the bonds between the LC and the PMDA. In detail, in the spectrum of the sample non-treated it is well visible the peak at 1714 cm−1 of the ester linkage between the LC and PMDA. Increasing the temperature, this signal is shifted in frequency evidencing the scission of the ester bridge and the formation of different carbonyl species. The decomposition of the ester bond is also attested by a peak at 1815 cm−1, referred to the C![[double bond, length as m-dash]](https://www.rsc.org/images/entities/char_e001.gif) O stretching of dianhydrides.
O stretching of dianhydrides.
From these data, the conclusion is that pyrolysis occurs by alteration of the saccharide structure and scission of bonds which constitute crosslinking bridges, resulting in the formation of desaturations. These unsaturated species become more and more numerous, acting as precursor for the rearrangement of the structure and the formation of the polycyclic aromatic structure typical of char. Furthermore, Liu et al.23 observed that the first step of thermal degradation of starch consisted in the condensation of hydroxyl groups and the release of small volatile species. Polysaccharides (cellulose and cyclodextrins), sharing with starch similar chemical bonds and structures, undergo thermal decomposition via two competitive processes, the foster (depolymerization) following an intramolecular path generates volatile products, mostly levoglucosan; the latter (dehydration) following an intermolecular path that leads the system to the production of carbon residue and gas products such as CO2, CO and H2O.27,35
As observed for cyclodextrin nanosponges, the PMDA crosslinker substantially alters the amount of residue produced, affecting the competition between volatilization and carbonization processes in favor of the latter.27 The cross-linking bridge is a very thermolabile ester bond which can be easily broken increasing the temperature. The formation of fragments and the interaction among them can act reducing the quantity of volatiles released and increasing the amount of carbon produced. In addition, the dehydration of the glucose ring of the LC by the PMDA can also occur resulting in the generation of C![[double bond, length as m-dash]](https://www.rsc.org/images/entities/char_e001.gif) C bonds that can promote the char generation (Scheme 2). At the end, the PMDA has an aromatic group that can give a further contribution to the char yield.
C bonds that can promote the char generation (Scheme 2). At the end, the PMDA has an aromatic group that can give a further contribution to the char yield.
Conclusions
Direct pyrolysis can be adopted to prepare microporous carbon spheres using LNS as precursor. The isotherms obtained by the gas-volumetric analysis of the C-LC and C-LNS are of Type 1 (Langmuir adsorption model) proving that the carbons are mainly microporous. The C-LC shows a specific surface area of 194 m2 g−1 and pore size between 5–15 Å for a total porosity of 0.05 cm3 g−1, whereas the C-LNS has 684 m2 g−1 and 5–17 Å pore size for a total porosity of 0.16 cm3 g−1, respectively. So, the C-LNS possesses a larger surface produced by a higher pore volume than the C-LC. The TEM analysis evidences the presence of a complex structure in the carbons made of graphitic-like plane embedded in an amorphous carbon matrix. This structural disorder can be responsible of the microporosity of the samples. Moreover, the SEM analysis reveals that the microporous carbons obtained by the LNS precursor is mainly composed by hollow spherical particles. In term of pyrolysis yield, the TGA demonstrated that the LNS is more efficient as a carbon precursor than the LC. Lastly, the FT-IR studies prove that the presence of the pyromellitic dianhydride modifies the thermal degradation of the LC, reducing the intramolecular path and increasing the amount of carbon produced.Acknowledgements
The authors gratefully thank to the Roquette Italia (Cassano Spinola, Italy), for the financial support. This work was realized with the financial support for academic interchange by the Marie Sklodowska-Curie Research and Innovation Staff Exchange project funded by the European Commission H2020-MSCA-RISE-2014 within the framework of the research project Mat4treaT (Project number: 645551). Compagnia di San Paolo and University of Torino are gratefully acknowledged for funding Project Torino_call2014_L2_126 through “Bando per il finanziamento di progetti di ricerca di Ateneo – anno 2014” (Project acronym: Microbusters).References
- H. Yang, Z. Xu, M. Fan, R. B. Slimane, A. E. Bland and I. Wright, J. Environ. Sci., 2008, 20, 14–27 CrossRef CAS.
- S. N. Riduan and Y. Zhang, Dalton Trans., 2010, 39, 3347 RSC.
- W. Wang, S. Wang, X. Ma and J. Gong, Chem. Soc. Rev., 2011, 40, 3703–3727 RSC.
- M. E. Y. Belmabkhout and V. Guillerm, Chem. Eng. J., 2016, 296, 386–397 CrossRef.
- C. Chen, Y. Lee and W. Ahn, J. Nanosci. Nanotechnol., 2016, 16, 4291–4301 CrossRef CAS PubMed.
- L. Valenzano, B. Civalleri, S. Chavan, G. T. Palomino, C. O. Areán and S. Bordiga, J. Phys. Chem. C, 2010, 114, 11185–11191 CAS.
- J. M. Chem, J. Mater. Chem. A, 2017, 5, 1334–1347 Search PubMed.
- O. Cheung and N. Hedin, RSC Adv., 2014, 4, 14480–14494 RSC.
- Y. Zeng, R. Zou and Y. Zhao, Adv. Mater., 2016, 2855–2873 CrossRef CAS PubMed.
- Y. Xia, Z. Yang and Y. Zhu, J. Mater. Chem. A, 2013, 1, 9365 CAS.
- Y. Zhai, Y. Dou, D. Zhao, P. F. Fulvio, R. T. Mayes and S. Dai, Adv. Mater., 2011, 23, 4828–4850 CrossRef CAS PubMed.
- F. Rodriguez-Reinoso, Carbon, 1998, 36, 159–175 CrossRef CAS.
- H. Chang, S. Hoon Joo and C. Pak, J. Mater. Chem., 2007, 7, 3078–3088 RSC.
- C. Vix-Guterl, E. Frackowiak, K. Jurewicz, M. Friebe, J. Parmentier and F. Béguin, Carbon, 2005, 43, 1293–1302 CrossRef CAS.
- J. Lee, J. Kim and T. Hyeon, Adv. Mater., 2006, 18, 2073–2094 CrossRef CAS.
- B. McEnaney and T. J. Mays, Chapter 5 – Porosity in Carbons and Graphites, Butterworth & Co. (Publishers) Ltd, 1989 Search PubMed.
- H. C. Foley, Microporous Mater., 1995, 4, 407–433 CrossRef CAS.
- P. Cheng, S. Gao, P. Zang, X. Yang, Y. Bai, H. Xu, Z. Liu and Z. Lei, Carbon, 2015, 93, 315–324 CrossRef CAS.
- M. S. Balathanigaimani, W.-G. Shim, M.-J. Lee, C. Kim, J.-W. Lee and H. Moon, Electrochem. Commun., 2008, 10, 868–871 CrossRef CAS.
- F. C. Wu and R. L. Tseng, J. Colloid Interface Sci., 2006, 294, 21–30 CrossRef CAS PubMed.
- W. Chen, H. Zhang, Y. Huang and W. Wang, J. Mater. Chem., 2010, 20, 4773 RSC.
- T. Kyotani, T. Nagai, S. Inoue and A. Tomita, Chem. Mater., 1997, 9, 609–615 CrossRef CAS.
- H. Liu, F. Xie, L. Yu, L. Chen and L. Li, Prog. Polym. Sci., 2009, 34, 1348–1368 CrossRef CAS.
- H. Wang, Q. Dai, Q. Li, J. Yang, X. Zhong, Y. Huang, A. Zhang and Z. Yan, Solid State Ionics, 2009, 180, 1429–1432 CrossRef CAS.
- L. Ding, B. Zou, Y. Li, H. Liu, Z. Wang, C. Zhao, Y. Su and Y. Guo, Colloids Surf., A, 2013, 423, 104–111 CrossRef CAS.
- V. Budarin, J. H. Clark, J. J. E. Hardy, R. Luque, K. Milkowski, S. J. Tavener and A. J. Wilson, Angew. Chem., Int. Ed., 2006, 45, 3782–3786 CrossRef CAS PubMed.
- M. Zanetti, A. Anceschi, G. Magnacca, G. Spezzati, F. Caldera, G. P. Rosi and F. Trotta, Microporous Mesoporous Mater., 2016, 235, 178–184 CrossRef CAS.
- W. Tumiatti and F. Trotta, WO03/085002 A1, 2005.
- F. Trotta, W. Tumiatti and R. Vallero, MI2004A000614, 2004.
- F. Trotta, M. Zanetti and R. Cavalli, Beilstein J. Org. Chem., 2012, 8, 2091–2099 CrossRef CAS PubMed.
- D. Li and M. Ma, Clean Products and Processes, 2000, 2, 0112–0116 CrossRef.
- F. Trotta and E. Fossati, WO2016004974A1, 2014.
- D. Lozano-Castello, D. Cazorla-Amoros, A. Linares-Solano, K. Oshida, T. Miyazaki, Y. J. Kim, T. Hayashi and M. Endo, J. Phys. Chem. B, 2005, 109, 15032–15036 CrossRef CAS PubMed.
- C. Morterra and M. J. D. Low, Carbon, 1983, 21, 283–288 CrossRef CAS.
- F. Trotta, M. Zanetti and G. Camino, Polym. Degrad. Stab., 1966, 1964, 2139–2143 Search PubMed.
Footnote |
| † Electronic supplementary information (ESI) available. See DOI: 10.1039/c7ra05343f |
| This journal is © The Royal Society of Chemistry 2017 |

