 Open Access Article
Creative Commons Attribution 3.0 Unported Licence
Nanocube In2O3@RGO heterostructure based gas sensor for acetone and formaldehyde detection†
Rajneesh Kumar Mishra‡
 a,
G. Muralia,
Tae-Hyung Kimb,
Jee Hun Kimb,
Young Jin Lima,
Byoung-Suhk Kimc,
P. P. Sahayd and
Seung Hee Lee*a
aApplied Materials Institute for BIN Convergence, Department of BIN Fusion Technology, Department of Polymer-Nano Science and Technology, Chonbuk National University, Jeonju, Jeonbuk 561-756, Korea. E-mail: lsh1@chonbuk.ac.kr; Tel: +82-63-270-2343
bGraduate School of Flexible & Printable Electronics Engineering, Chonbuk National University, Jeonju, Jeonbuk 561-756, Korea
cDepartment of Organic Materials & Fiber Engineering, Department of BIN Fusion Technology, Chonbuk National University, Jeonju, Jeonbuk 561-756, Korea
dDepartment of Physics, Motilal Nehru National Institute of Technology Allahabad, Allahabad-211004, India
First published on 8th August 2017
Abstract
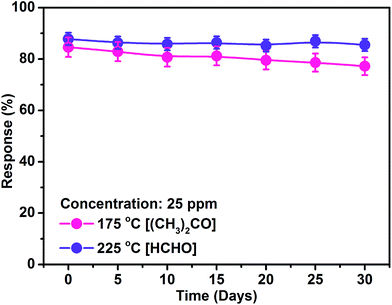
Here, we studied the gas sensing response properties for acetone and formaldehyde by a chemiresistive nanocube In2O3@RGO heterostructure sensor. The nanocube In2O3@RGO heterostructure based sensor demonstrates a high response to acetone (∼85%) and formaldehyde (∼88%) at 25 ppm concentration and optimum working temperatures of 175 °C and 225 °C, respectively. Additionally, we examined the influence of potential barrier heights in the response/recovery time of the nanocube In2O3@RGO heterostructure based acetone and formaldehyde gas sensor. The real-time response/recovery analysis reveal that the sensor response depends on the potential barrier height as well as adsorbed active sites (O2− & O−) on the sensor surface. Furthermore, the nanocube In2O3@RGO heterostructure based gas sensor shows good selectivity to acetone and formaldehyde at optimum working temperature of 175 °C and 225 °C, respectively, compared to the other interfering gases such as ethanol, methanol, chloroform, toluene, benzene, ammonia, formic acid and acetic acid. The life-time analysis has been performed for 30 days, which showes the stability of nanocube In2O3@RGO heterostructure based acetone and formaldehyde sensor.
Introduction
The increasing anxiety about the consequences of air pollution with respect to public health has led to a high demand for solid state gas sensors in domestic, military and industrial applications.1 Major interest has arisen in the field of selective gas detection of volatile organic compounds (VOCs) from the environment in the presence of various interfering gases.2–4 Chemical industries use VOCs for a variety of purposes, which enters into the human body through breathing and passes via the bloodstream into many organs, adversely affecting the brain, nervous and skin systems, even at very low concentrations.4,5Acetone [(CH3)2CO], a widely used VOC in laboratories as well as in industries, is toxic to human organs and is a selective breath marker for type-1 diabetics.6 The healthy breath environment contains less than 0.9 ppm concentration of acetone. But it indicates high level of ketone in the blood (ketosis) in insulin-dependent diabetes if its concentration exceeds 1.8 ppm in living places.7 On the other hand, formaldehyde (HCHO), the most abandoned airborne carbonyl chemical which is extensively used in the decoration of wood furnitures in daily-life and industrial manufacturing processes, is recognized as one of the most serious pollutants in the indoor environment and causes headache, coryza, sick house syndromes, nausea, childhood asthma and even lung cancer.8,9 Therefore, for the safety point of view fast, accurate and rapid monitoring of these health hazardous and environmental pollutant gases from the public places with an effective and convenient method are of significant practical importance.
Among metal oxide semiconductors (MOS), indium oxide (In2O3) is a wide direct band gap (Eg = 3.7 eV)9 and indirect band gap (Eg = 2.5 eV)10 semiconductor, having outstanding optical and electrical properties. It is a robust candidate from the transparent semiconducting oxide family and one of the most promising and applicable material. In2O3 is immersed as a next generation solid state gas sensor due to its good performance and ease of use. It is extensively used in various fields such as solar cell,11 supercapacitor,12 field effects transistors,13 transparent thin film transistors,14 photo-catalyst,15 flat panel display,16 light-emitting diodes,17 and biological and chemical gas sensors.18,19 In2O3 nanostructure offers a hopeful platform for high performance gas sensing devices that employ direct electrical readout and used to detect the harmful, toxic and explosive gases.20–22
Graphene is an attractive material both as the benchmark of fundamental physical properties of a two-dimensional system and its widespread applications in the field of material science & nanotechnology.23,24 Currently, it is one the most important material and being targeted for a number of commercial & industrial applications. It is also successfully demonstrated in flexible chemoresistive sensor,25 organic light emitting diodes,26 liquid crystal displays,27 organic photovoltaic,28 energy storage29 and touch screens,30 etc. Recently, noteworthy progress has been achieved that attracted much attention towards the development of different kinds of gas sensors using graphene, reduced graphene oxide (RGO), and graphene/MOS hybrid nanostructures. Some et al. have reported highly sensitive and selective gas sensor using the hydrophilic and hydrophobic graphene.31 Sun et al. have investigated the nanocasting synthesis of In2O3 with appropriate mesostructured ordering and enhanced gas-sensing property.32 Ju et al. have studied the single-carbon discrimination by preferred peptides for the individual detection of VOCs.33 Moon et al. have presented the highly transparent, self-assembled nanocolumnar tungsten oxide thin films based sensor for NO2 and VOCs with detection limits below parts per trillion.34 Lai et al. have demonstrated the improved formaldehyde gas sensing performance based on ordered arrays of bead-chain-like In2O3 nanorods.35 Yang et al. synthesized the additive free In2O3 cubes embedded with graphene and studied improved NO2 sensing performance at room temperature.36 Huang et al. have synthesized ZnO QDs/graphene nanocomposites and studied the room temperature formaldehyde sensing properties with improved performance and fast response and recovery times.37 Recently our group, Mishra et al. have studied the highly sensitive, selective and stable H2 & LPG gas sensor based on RGO/SnO2 QD hybrid nanostructure.38
The RGO/MOS hybrid nanostructures have been explored for the application in solid state chemical gas sensors with high response and reliability. Nevertheless, the sensing properties of RGO/MOS hybrid nanostructures, such as the high test gas response, good selectivity & stability as well as quick response/recovery time are the vital parameters for actual gas sensor operation, which require further improvements. In the present study, we have successfully demonstrated the optimum working temperature and concentration for which nanocube In2O3@RGO heterostructure based gas sensor exhibits maximum response to acetone and formaldehyde. We have also displayed the selectivity and stability of nanocube In2O3@RGO heterostructure based gas sensor at that particular gas response temperature and concentration. The gas sensor mechanisms of adsorption–desorption and theoretical calculation of the active sites O2− and O−, which are participating in the sensing mechanism at various operating temperature have been studied. Although, we have performed the number of experiments at which nanocube In2O3@RGO heterostructure based gas sensor describes good gas sensing properties to achieve the optimum working temperature (175 °C & 225 °C) for 25 ppm concentration.
Experimental details
Materials and synthesis
Reduced graphene oxide (RGO) was synthesized from graphite powder purchased from the Alfa Aesar using the modified Hummers method.23,24 The In2O3 and nanocube In2O3@RGO heterostructure were prepared by one step hydrothermal process. In this method firstly, (20 mmol) of InCl3 was dissolved in distilled water to form a colorless transparent solution and then 1.5 mg RGO was added to the above solution. Consequently, with mild stirring, 1 ml hexamethyldisilazane (HMDS) surfactant was added to the above solution at room temperature. Further, the pH was maintained at 9 by adding the NaOH solution drop wise into the above solution. The entire solution was transferred into a 100 ml Teflon-lined stainless steel autoclave to react at 120 °C for 20 h and then allowed to naturally cooled up to room temperature. The obtained precipitate was separated by centrifuging at 4000 rpm for 30 minutes and washed with distilled water and ethanol several times to remove impurity ions and then dried at 70 °C for 4 hours in a hot air oven. Finally, the obtained precipitate was annealed at 400 °C for 1 hour to obtain the desire products nanocube In2O3@RGO heterostructure. The dried mass was then crushed into the fine powder for further characterizations. Following the above-mentioned process bare In2O3 was also synthesized. The fine powder of nanocube In2O3@RGO heterostructure, RGO and In2O3 were pressed into pellet of 10.5 mm diameter and 1.0 mm thickness at a pressure of ∼15 MPa using a hydraulic press. These pellets were further sintered at 200 °C for 30 minute. After that, a high-temperature silver paste was used for making the Ohmic contact on both surfaces of pellet.Materials characterization
The phase identification of the nanocube In2O3@RGO heterostructure was carried out by powder X-ray diffraction (XRD) using Bruker AXS C-8 advanced diffractometer with Cu Kα radiation (λ = 1.5406 Å). The X-ray photoelectron spectroscopy (XPS) analysis has been done by a Kα Thermo Scientific equipped with a monochromatic Al-Ka X-ray and 100–4000 eV ion gun. The Raman spectrum was recorded by Lab RAM HR 800 microlaser Raman system in backscattering geometry using the 514.5 nm line of Ar+-laser as an excitation source. The morphological and elemental composition was probed by JEOL field electron scanning electron microscope (FE-SEM) along with elemental mapping. The shape and structure were investigated by transmission electron microscope (TEM) on a Philips model Tecnai-20 using an accelerating voltage of 200 kV. The experimental characterization techniques were also performed for bare RGO and In2O3 nanocube samples and corresponding results are presented in ESI.†Gas sensing measurements
The acetone and formaldehyde gas sensing properties of nanocube In2O3@RGO heterostructure based gas sensor have been determined by measuring the change in electrical resistance of sensing device and estimated by the following equation:38
 | (1) |
To measure quantitatively the concentration (ppm) of acetone and formaldehyde, the following method has been used. If V is the volume of the test gas chamber and Cppm is the concentration of acetone and formaldehyde, then the volume of acetone and formaldehyde in the test gas chamber is,5
| Vacetone/formaldehyde = Cppm × V | (1a) |
 | (1b) |
Macetone/formaldehyde and ρacetone/formaldehyde are the molar mass and density of acetone & formaldehyde. Then, the final volume of liquid acetone and formaldehyde (Va,f), respectively are injected into the test gas chamber is given as:
 | (1c) |
By incorporating the values of Macetone/formaldehyde, P, Cppm, V, ρacetone/formaldehyde and R in the eqn (1c) for both acetone and formaldehyde, respectively we get two separate equations:
 | (1d) |
 | (1e) |
Therefore, the desired volumes of liquid acetone and formaldehyde at different operating temperature and concentration were calculated by using eqn (1d) and (1e) and injected into the test gas chamber by Hamilton micro-syringe.
Results and discussion
Structural studies
The phase/crystalline nature of the nanocube In2O3@RGO heterostructure was investigated by XRD pattern. Fig. 1(a) represents the XRD spectrum obtained from In2O3@RGO heterostructure annealed at 400 °C. All the diffraction peaks are indexed to the cubic structure of In2O3 and well matched with JCPDS card no. 71-2194 along with a peak corresponding to RGO observed at 23.48° (a broad shoulder, lattice spacing of 0.37 nm). The XRD spectra of RGO and In2O3 nanocubes were also studied to confirm the structure and reported in ESI [Fig. S1†].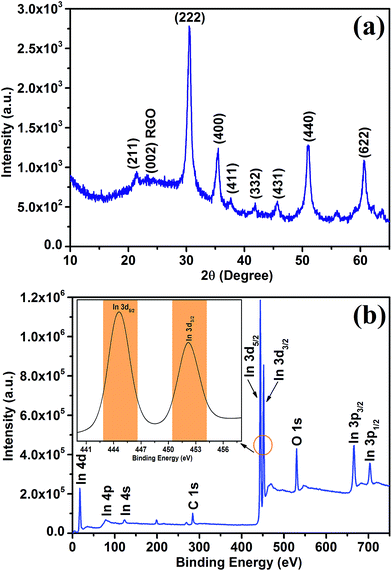 | ||
| Fig. 1 Typical XRD pattern (a) and XPS spectrum (b) of as obtained nanocube In2O3@RGO heterostructure (inset in (b) depicts the convoluted characteristic peaks of In 3d). | ||
In order to confirm the elemental composition, the nanocube In2O3@RGO heterostructure was characterized by X-ray photoelectron spectroscopy (XPS). Fig. 1(b) shows the XPS survey spectrum of In2O3@RGO heterostructure. The In2O3@RGO heterostructure shows the presence of In (3p, 3d, 4s, 4p, 4d), O (1s) and carbon C (1s) peaks. The inset in Fig. 1(b) displays the high resolution spectrum of In 3d peak, which is ascribed to the characteristic spin–orbit split In 3d5/2 (444.24 eV) and In 3d1/2 (452.03 eV) and thus signified the presence of In2O3 in In2O3@RGO heterostructure.39 The peak around 529.94 eV could be indexed to oxygen anions from In2O3.40 Therefore, these results give the insight that the heterostructure was composed of RGO and In2O3 nanocube. XPS result confirms the successful formation of In2O3@RGO heterostructure and validates XRD findings. The XPS survey spectra of RGO and In2O3 nanocube were addressed in the ESI [Fig. S2†].
To further study the crystalline nature and defect states in In2O3@RGO heterostructure, Raman measurement was performed. Fig. 2 shows the Raman spectrum of as prepared nanocube In2O3@RGO heterostructure. The bands at 304 cm−1 (E1g), 362 cm−1 (E2g), 493 cm−1 (A1g) and 624 cm−1 (E2g) are Raman active phonon modes of In2O3 nanocube. Furthermore, inset in Fig. 2 gestures the existence of carbon peaks in In2O3@RGO heterostructure, having G (1579 cm−1) and 2D (2713 cm−1) phonon modes. The G (1579 cm−1) and 2D Raman phonon modes are related to the in-plane optical vibration of sp2-bonded carbon atoms (degenerate zone center, E2g mode) and second-order zone boundary phonons (representing defect states), respectively.41 The Raman study outlines the validation of XRD and XPS result of In2O3@RGO heterostructure. Raman spectra of RGO and In2O3 nanocube are also interpreted and shown in ESI [Fig. S3†] to further confirm the XRD results of Fig. S1.†
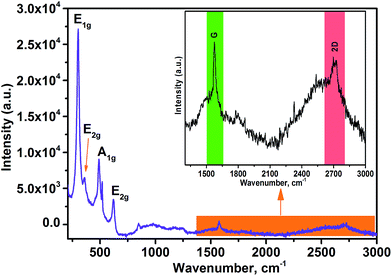 | ||
| Fig. 2 Raman spectrum of nanocube In2O3@RGO heterostructure (inset shows the convoluted spectrum of RGO). | ||
The morphological and structural studies of nanocube In2O3@RGO heterostructure were evaluated by TEM, HRTEM and SAED pattern Fig. 3(a–d). TEM images in Fig. 3(a and b) indeed represent the small dark In2O3 nanocube decorated on the surface of RGO and inhibited re-stacking of RGO into multilayers. Fig. 3(a and b) allude the good distribution of In2O3 nanocube on the RGO surface and manifested that RGO can be used as the substrate to synthesize In2O3@RGO heterostructure. The HRTEM image [Fig. 3(c)] shows the lattice plane of RGO (002) with spacing (0.37 nm) garlanded by two different planes (222) and (400) of In2O3 nanocube with spacing 0.29 nm and 0.25 nm, respectively, which again justified the XPD, XPS and Raman results. Fig. 3(d) displays the SAED pattern of nanocube In2O3/RGO heterostructure, suggesting polycrystalline nature with different lattice planes of RGO and In2O3 nanocube. The lattice planes corresponding to (400), (431) and (622) indicated by diffused ring in Fig. 3(d) are recognized as In2O3 cubic phase whereas lattice plane (002) corresponds to RGO with lattice spacing 0.37 nm. These results also support the XRD analyses and are in good agreement with XPS and Raman results. Therefore, we can easily say that In2O3 nanocubes (cubic structure) veneered on the RGO surface are polycrystalline in nature. It is also noticed that each In2O3 nanocube attached to several other nanocubes as shown in Fig. 3(a and b). Thus, the good contact between the In2O3 nanocubes and RGO could efficiently minimize the electrical segregation of heterostructure during the gas sensing measurements. The RGO with high surface area loaded with In2O3 nanocube can boost electron transfer during the chemisorption process of the gas sensing mechanisms. All these above results confirm the successful formation of In2O3@RGO heterostructure. Further, the nanostructure of RGO and In2O3 nanocubes were also studied by TEM, HRTEM and SAED and represented in ESI [Fig. S4†]. The FE-SEM and corresponding elemental mapping of nanocube In2O3@RGO heterostructure, RGO and bare In2O3 nanocubes have been investigated for the morphological and elemental compositional analysis and depicted in ESI [Fig. S5†].
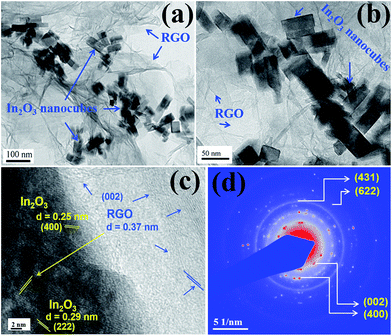 | ||
| Fig. 3 TEM images (a and b), HRTEM image (c) and SAED pattern (d) of nanocube In2O3@RGO heterostructure. | ||
Gas sensing properties
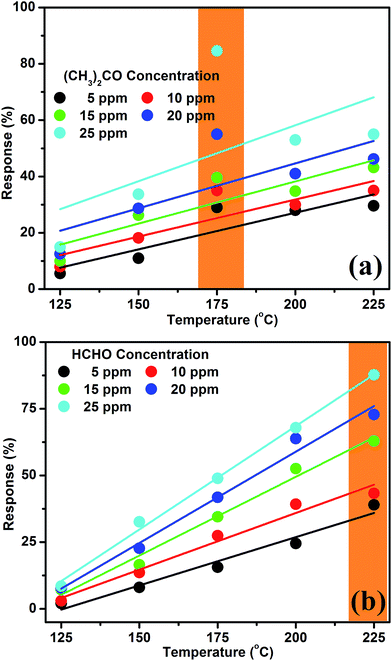 | ||
| Fig. 4 Response characteristics of acetone (a) and formaldehyde (b) based on the nanocube In2O3@RGO heterostructure sensor as a function of operating temperature for distinct test gas concentrations. | ||
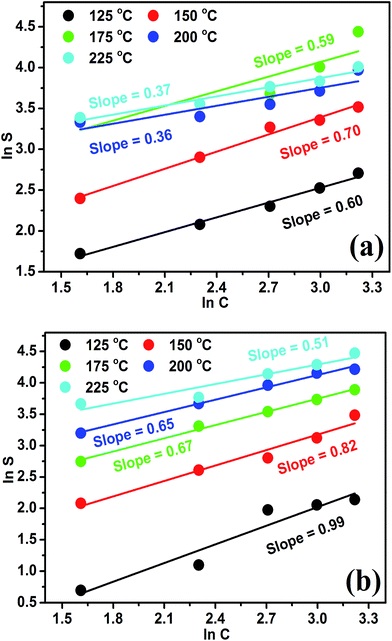
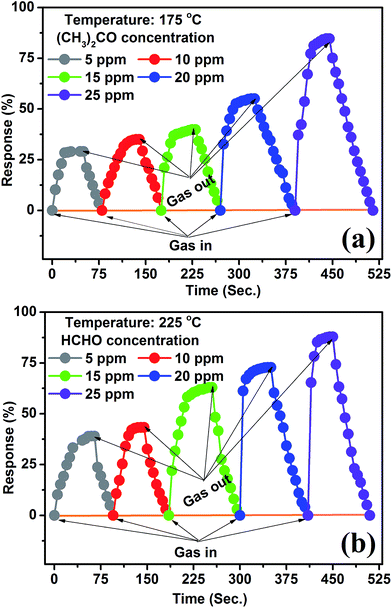
In Fig. 4(a), the acetone response increases very quickly at 175 °C and achieves its maximum value (∼85%) for 25 ppm. It may be due to the presence of mixed state of active sites O2− and O− at moderate operating temperature or good interaction of sensor surface with the test gas molecules. In other words, we can say that the reactivity of nanocube In2O3@RGO heterostructure based gas sensor surface with acetone needs definite activation energy which is provided by the tuning of working temperature. Hence, different kinds of gases are required different activation energies to work out for high performance gas sensor.42 Therefore, we can infer that the highest response (∼85%) at 175 °C for 25 ppm concentration is due to the insertion of RGO and hence it improves the surface reactivity of nanocube In2O3@RGO heterostructure based gas sensor. Consequently, it also enables the important role of active sites (O2− and O−) [Table 1] and potential barrier heights [Table 2] in the sensing mechanisms. On the other hand, at low operating temperature (<175 °C), the sensor response of acetone is found to be low (<40%), which may be due to the strong potential barrier formed by chemisorbed oxygen species, which is unable to overcome by the low thermal excitation energies, resulting low response. Contrary, at operating temperature beyond 175 °C, the response is <60% and nearly it has decline tendency, which may perhaps be due to the deficiency of active site O− [34% and 66% of O2− & O− at 225 °C, respectively as shown in Table 1] on the surface of sensor or low interaction of gas molecules with chemisorbed active sites. In other words, we can say that it is because of the low adsorption ability of acetone molecule traces, which caused the low utilization rate on the surface of nanocube In2O3@RGO heterostructure. In addition, at higher operating temperatures above 175 °C, more desorption of the adsorbed oxygen ionic species would occur, resulting a low response.
| Test gases | Participating active sites (O2− and O−) on sensor surface | |||||||||
|---|---|---|---|---|---|---|---|---|---|---|
| 125 °C | 150 °C | 175 °C | 200 °C | 225 °C | ||||||
| O2− | O− | O2− | O− | O2− | O− | O2− | O− | O2− | O− | |
| (CH3)2CO | 87% | 13% | 91% | 9% | 86% | 14% | 64% | 36% | 34% | 66% |
| HCHO | 99% | 1% | 78% | 22% | 51% | 49% | 46% | 54% | 4% | 96% |
| Test gases | Potential barrier heights (meV) | |||
|---|---|---|---|---|
| 125–175 °C | 175–225 °C | |||
| Response (ΔEres) | Recovery (ΔErec) | Response (ΔEres) | Recovery (ΔErec) | |
| (CH3)2CO | 366 | 262 | 189 | 162 |
| HCHO | 333 | 200 | 123 | 93 |
Fig. 4(b) describes the formaldehyde response feature of nanocube In2O3@RGO heterostructure based gas sensor as the function of operating temperature. Firstly, low responses (below 15%) were observed by exposing 5–25 ppm HCHO at 125 °C. Subsequently, it is noticed that as working temperature increases, the response to HCHO linearly increases for all concentrations and found to be maximum (∼88%) for 25 ppm at 225 °C. It is because of the increase in the density of electrons in the conduction band of sensing material caused by thermal excitation. So, these electrons may be engaged with adsorbed atmospheric oxygen (O2), reacted and converted it into the active sites (O2− and O−), which is fully responsible for quick and improved gas response [Table 1]. Therefore, adsorbed atmospheric oxygen species on the surface of sensor are considered as one of the most important parameter since illuminating the electronic and chemical peculiarities as well as adsorption ethos of nanocube In2O3@RGO heterostructure.43 Additionally, it is materialize that the RGO acts like a conductor by effectively transferring charge carriers to the sensing electrode at elevated temperature.
On the other hand, the acetone response suddenly decreases and tends to saturate after 175 °C for all concentration [Fig. 4(a)] whereas under the same conditions, the response to HCHO increases throughout [Fig. 4(b)]. The nanocube In2O3@RGO heterostructure based gas sensor might have distinct adsorption/desorption and their interaction with acetone traces, therefore it portrays different response to acetone molecule. Further, we can say that the proportions of active site O2− slowly decreases and found to be almost mixed states of active sites (O2− and O−) on the sensor surface at all the operating temperatures (beyond 175 °C) for acetone, causes low and saturated response [Fig. 4(a)]. But in the case of formaldehyde, the proportions of O− active sites increases with increasing the working temperature of sensor and play a crucial role to enhance the sensor response which explores the degree of reactivity with formaldehyde traces. The proportions of active sites (O2− and O−) with operating temperature of sensor for both acetone and formaldehyde are listed in Table 1. However, the adsorption/desorption phenomena occur simultaneously for HCHO because HCHO molecule & its constituents might be easily adsorb and diffuse on the surface of nanocube In2O3@RGO heterostructure based gas sensor. Since, HCHO molecule is an electrophilic, it is Lewis acids having characteristic to accept more electrons. Therefore, it is expected to transfer more charges from In2O3@RGO heterostructure to the chemisorbed HCHO, resulting an improved response with temperature [Fig. 4(b)].
The gas sensing performances of RGO and In2O3 nanocube based gas sensors towards the acetone and formaldehyde have also been studied at the same operating temperature range and concentration as shown in the ESI [Fig. S6(a and b) and S7(a and b)†]. It has been found that the gas sensing response of nanocube In2O3@RGO heterostructure based acetone and formaldehyde sensor is higher compared to the bare RGO and In2O3 nanocube based gas sensor. This enhanced sensing execution of nanocube In2O3@RGO heterostructure based gas sensor is attributed to the synergistic effect between the RGO and In2O3 nanocube.
Consequently, the optimum working temperature for nanocube In2O3@RGO heterostructure based gas sensor to discriminate 25 ppm concentration of acetone and formaldehyde is 175 °C and 225 °C, respectively, which are immaculate from the viewpoint of chemiresistive gas sensors. Therefore, the optimum working temperature 175 °C for acetone and 225 °C for formaldehyde have been preferred to further study other characteristics e.g. response/recovery times, selectivity and life-time of nanocube In2O3@RGO heterostructure based gas sensor.
| O2(gas) ↔ O2(phys) ↔ O2−(chem) ↔ 2O−(chem) ↔ 2O2−(chem) | (2) |
Therefore, concentration of the surface oxygen species depends not only on the concentration of the reducing gases but also the working temperature of sensor. The chemical adsorption of oxygen and its reactions with acetone and formaldehyde follow the sensing mechanisms of nanocube In2O3@RGO heterostructure based gas sensor. Therefore, eqn (1) can be written below in terms of concentration,45
 | (3) |
The acetone and formaldehyde sensing mechanisms and the proportions of involved active sites (O2− and O−) were calculated by the following reactions.
| CH3COCH3 + xO2− + 6yO− → 3CO2 + 3H2O + (x + 6y)e− | (4) |
| x + y = 1 | (4a) |
| n = 1/(1 + 5y) | (4b) |
Inserting, the value of “n” from eqn (4b) to eqn (3), we obtain,
 | (4c) |
Similarly for formaldehyde,
| HCHO + xO2− + 2yO− → CO2 + H2O + (x + 2y)e− | (5) |
| x + y = 1 | (5a) |
| n = 1/(1 + y) | (5b) |
 | (5c) |
Further, the eqn (4c) & eqn (5c) were plotted and demonstrated in Fig. 5(a and b) with the help of gas response data [Fig. 4(a and b)], to calculate the power law exponent “n” [slopes of Fig. 5(a and b)] and the value of x & y, the proportions of active sites (O2− and O−), which are participating actively in the sensing mechanism of acetone and formaldehyde. Fig. 5(a and b) shows the logarithm plots of acetone and formaldehyde as the function of gas concentrations at various operating temperatures. It has been observed that the values of exponent “n”, listed in the Table 1, were different at distinct operating temperatures, indicating towards the existence of different proportions of ionosorbed oxygen species e.g. O2− or O− or both (O2− & O−) on the surface of nanocube In2O3@RGO heterostructure based gas sensor. For example, n = 0.59 at 175 °C for acetone as shown in Fig. 5(a), it means, the experimental result lies between the theoretical values 0.5 < n < 1. By incorporating the value of “n” into the eqn (4c) and also using eqn (4a) & (4b) leads to: x = 0.87, y = 0.13. Thus, oxygen might be adsorbed on the surface of nanocube In2O3@RGO heterostructure based gas sensor in the form of O2− (87%) and O− (13%), respectively. On the other hand, n = 0.51 at 225 °C for formaldehyde as calculated from Fig. 5(b), lies between the theoretical values 0.5 < n < 1. Fascinatingly, this value put into eqn (5c) and also using eqn (5a) & (5b) to evaluate x = 0.04 and y = 0.96. So, the active sites O2− (4%) and O− (96%) may be adsorbed on the surface of sensor and play a crucial role in the gas sensing performance. Finally, we concluded that the power law eqn (4c) and (5c) are the characteristics of surface reactions and provide insight view about the dominating species of oxygen adsorbates.
Fig. 6(a and b) show that the response time are decreasing with increasing gas concentration as well as temperature (175 & 225 °C) but the recovery time somehow is influenced and increased. It might be due to the dense surrounding around the surface of sensor, and subsequently slow adsorption/desorption reaction rate on the sensor surface which results in enhanced recovery time. It has been instituted from Fig. 6(a and b) that the response/recovery times of formaldehyde are less compared to acetone, demonstrating electrophilic nature of formaldehyde.
According to the solid state physics of matter, the well-known relation of thermal activation function which represents the relation between the response/recovery time constants as a function of temperature is written below:46
τres = τ0res![[thin space (1/6-em)]](https://www.rsc.org/images/entities/char_2009.gif) exp(ΔEres/KBT) exp(ΔEres/KBT)
| (6) |
τrec = τ0rec![[thin space (1/6-em)]](https://www.rsc.org/images/entities/char_2009.gif) exp(ΔErec/KBT) exp(ΔErec/KBT)
| (7) |
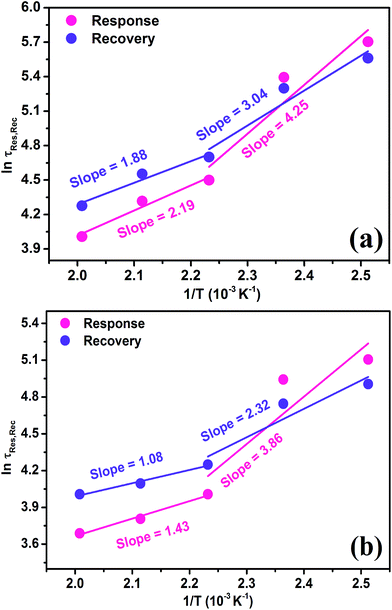
Eventually, we employed eqn (6) and (7) for the calculation of response/recovery potential barrier heights with the help of response and recovery reaction time for 25 ppm concentration to acetone and formaldehyde at different operating temperatures by using the experimental data as presented in Fig. S8(a and b).† Fig. 7(a and b) show the logarithm plots of response/recovery reaction time as a function of reverse of temperature for 25 ppm concentration to acetone and formaldehyde. It is observed that the response/recovery reaction time increases with decreasing the operating temperatures for both the test gases. It is also found that at low operating temperatures, the response reaction time are little bit longer compared to the recovery reaction time for both the test gases.
Interestingly, it has been also noticed that at higher operating temperatures, the response reaction time are low with respect to recovery reaction time for both the gases. It may perhaps be depend on adsorbed active sites on the sensor surface and potential barrier height, which is summarized in Tables 1 and 2, respectively. By linear fitting [Fig. 7(a and b)], we calculated the response/recovery reaction potential barrier heights in between the two temperature ranges (125–175 °C & 175–225 °C) and is summarized in Table 2. It is observed that the response/recovery potential barrier heights (ΔEres and ΔErec) are fairly distinct, unveiling two different mechanisms at 125–175 °C and 175–225 °C. These, ΔEres and ΔErec values are in good agreement with solid state theoretical relations [eqn (6) and (7)], indicating that it is proportional to the τres and τrec time and inversely proportional to operating temperature of the sensor [Table 2].
The response/recovery reaction time are dominated by the heights of potential barrier. Determined as, the ΔEres and ΔErec for acetone are little bit more compared to the formaldehyde for all working temperatures and also found to be reduced at higher temperature [Table 2]. It is attributed to thermal excitation of electrons thereby swing in Fermi level between the valance band and conduction band of nanocube In2O3@RGO heterostructure, pointing towards quick response/recovery times of In2O3@RGO heterostructure based acetone and formaldehyde sensor Fig. 6(a and b). These facts indicate that the both response and recovery reactions are easy to take place. It may take place due to the other factors such as grain boundaries, size of grains, sensor surface reaction rates and diffusion reaction rates which are affecting the response/recovery reaction rates. There are several other unknown factors which may also play a crucial role in the sensing response/recovery time and needed to be addressed. These results also validate all finding as addressed above in Fig. 4(a and b), 5(a and b) and 6(a and b).
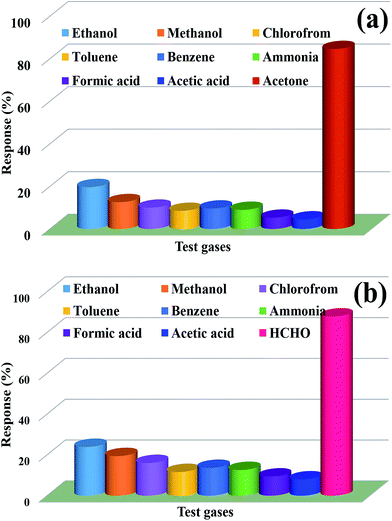
In other words, as demonstrated in Fig. 8(a and b), both kinds of sensors based on nanocube In2O3@RGO heterostructure possess good selectivity to recognize acetone at 175 °C and formaldehyde at 225 °C, which is almost insensitive to other typical meddling gases at the same concentration and temperature. It may be due to the presence of sufficient active sites (O2− and O−) on the surface of sensor and their good interaction with the test gases. Thus, our experimental observations suggest that the nanocube In2O3@RGO heterostructure based gas sensor works not only to recognize the test gases but also provide good discrimination of an individual gas from the bundle of gases, used for the experimentation.
In order to quantitatively calibrate the selectivity of acetone and formaldehyde from the environment, we have employed the following relation to determine the selectivity coefficient (Ksc) in the presence of different meddling gases.28
 | (8) |
The selectivity coefficients are summarized in the Table 3. The selectivity coefficient for nanocube In2O3@RGO heterostructure material based acetone sensor functioned at 175 °C for 25 ppm is highest to C2H4O2 (18.8) while for RGO/In2O3 nanocube hybrid material based formaldehyde sensor worked at 225 °C for 25 ppm is found to be maximum for C2H4O2 (10.9). Therefore, it suggests that the nanocube In2O3@RGO heterostructure sensor shows good selective detection to acetone and formaldehyde compared to C2H4O2 e.g. the gas response to acetone and formaldehyde are 18.8 and 10.9 times, respectively higher than to C2H4O2.
| Sensing devices | Meddling gases with 25 ppm concentration | |||||||
|---|---|---|---|---|---|---|---|---|
| C2H5OH | CH3OH | CHCl3 | C7H8 | C6H6 | NH3 | CH2O2 | C2H4O2 | |
| Nanocube In2O3@RGO heterostructure based (CH3)2CO sensor (175 °C) | 4.3 | 6.7 | 8.5 | 9.9 | 8.8 | 9.4 | 15.9 | 18.8 |
| Nanocube In2O3@RGO heterostructure based HCHO sensor (225 °C) | 3.7 | 4.5 | 5.5 | 7.6 | 6.5 | 6.9 | 9.3 | 10.9 |
Conclusions
In conclusion, the nanocube In2O3@RGO heterostructure as well as bare In2O3 nanocubes were synthesized via surfactant assisted hydrothermal method. The nanocube In2O3@RGO heterostructure based gas sensor showed better response for 25 ppm concentration to acetone and formaldehyde at 175 °C and 225 °C compared to the bare RGO and In2O3 nanocube based gas sensor. Our experimental findings would make a meaningful contribution towards the fabrication of nanocube In2O3@RGO heterostructure based gas sensor to recognize acetone and formaldehyde with excellent gas sensing performance such as high response, excellent selectivity with good long-term stability and quick response/recovery. It could be concluded that the nanocube In2O3@RGO heterostructure based gas sensor is promising for air quality monitoring of VOCs.Acknowledgements
This research was supported by the Basic Research Laboratory Program (2014R1A4A1008140) through the Ministry of Science, ICT & Future Planning; and Basic Science Research Program (2016R1D1A1B01007189) through the National Research Foundation of Korea (NRF) funded by Ministry of Education.Notes and references
- E.-X. Chen, H. Yang and J. Zhang, Inorg. Chem., 2014, 53, 5411–5413 CrossRef CAS PubMed.
- P. Offermans, M. Crego-Calama and S. H. Brongersma, Nano Lett., 2010, 10, 2412–2415 CrossRef CAS PubMed.
- N. Yamazoe, Sens. Actuators, B, 2005, 108, 2–14 CrossRef CAS.
- Y. Shimizu and M. Egashira, MRS Bull., 1999, 24, 18–24 CrossRef CAS.
- S. B. Upadhyay, R. K. Mishra and P. P. Sahay, Sens. Actuators, B, 2015, 209, 368–376 CrossRef CAS.
- Y. Xiao, L. Lu, Ai. Zhang, Y. Zhang, L. Sun, L. Huo and F. Li, ACS Appl. Mater. Interfaces, 2012, 4, 3797–3804 CAS.
- S. Elouali, L. G. Bloor, R. Binions, I. P. Parkin, C. J. Carmalt and J. A. Darr, Langmuir, 2012, 28, 1879–1885 CrossRef CAS PubMed.
- Y. Shigesato, S. Takaki and T. Haranoh, J. Appl. Phys., 1992, 71, 3356–3364 CrossRef CAS.
- Q. Liu, W. Lu, A. Ma, J. Tang, J. Lin and J. Fang, J. Am. Chem. Soc., 2005, 127, 5276–5277 CrossRef CAS PubMed.
- G. Shen, B. Liang, X. Wang, H. Huang, D. Chen and Z. L. Wang, ACS Nano, 2011, 5, 6148–6155 CrossRef CAS PubMed.
- C.-Y. Huang, G.-C. Lin, Y.-J. Wu, T.-Y. Lin, Y.-J. Yang and Y.-F. Chen, J. Phys. Chem. C, 2011, 115, 13083–13087 CAS.
- P.-C. Chen, G. Shen, S. Sukcharoenchoke and C. Zhou, Appl. Phys. Lett., 2009, 94, 043113 CrossRef.
- X. Zou, X. Liu, C. Wang, Y. Jiang, Y. Wang, X. Xiao, J. C. Ho, J. Li, C. Jiang, Q. Xiong and L. Liao, ACS Nano, 2013, 7, 804–810 CrossRef CAS PubMed.
- G. Shen, J. Xu, X. Wang, H. Huang and D. Chen, Adv. Mater., 2011, 23, 771–775 CrossRef CAS PubMed.
- K. R. R. Gil, Y. Sun, E. R. García and D. Raftery, J. Phys. Chem. C, 2009, 113, 12558–12570 Search PubMed.
- H. Jia, Y. Zhang, X. Chen, J. Shu, X. Luo, Z. Zhang and D. Yu, Appl. Phys. Lett., 2003, 82, 4146–4148 CrossRef CAS.
- L.-C. Chen, C.-H. Tien and W.-C. Liao, J. Phys. D: Appl. Phys., 2011, 44, 165101 CrossRef.
- N. G. Pramod and S. N. Pandey, Ceram. Int., 2014, 40, 3461–3468 CrossRef CAS.
- J. Kim, Y. S. Rim, H. Chen, H. H. Cao, N. Nakatsuka, H. L. Hinton, C. Zhao, A. M. Andrews, Y. Yang and P. S. Weiss, ACS Nano, 2015, 9, 4572–4582 CrossRef CAS PubMed.
- M. Curreli, C. Li, Y. Sun, B. Lei, M. A. Gundersen, M. E. Thompson and C. Zhou, J. Am. Chem. Soc., 2005, 127, 6922–6923 CrossRef CAS PubMed.
- X. S. Niu, H. X. Zhong, X. J. Wang and K. Jiang, Sens. Actuators, B, 2006, 115, 434–438 CrossRef CAS.
- J. Q. Xu, Y. P. Chen, Q. Y. Pan, Q. Xiang, Z. X. Cheng and X. W. Dong, J. Nanotechnol., 2007, 18, 115615 CrossRef.
- (a) A. K. Geim and K. S. Novoselov, Nat. Mater., 2007, 6, 183–191 CrossRef CAS PubMed; (b) M. Srivastava, J. Singh, T. Kuila, R. K. Layek, N. H. Kim and J. H. Lee, Nanoscale, 2015, 7, 4820–4868 RSC; (c) M. Kim, R. K. Mishra, R. Manda, G. Murali, T.-H. Kim, M.-H. Lee, M. Yun, S. Kundu, B.-S. Kim and S. H. Lee, RSC Adv., 2017, 7, 16650–16654 RSC.
- (a) A. K. Geim, Graphene: status and prospects, Science, 2009, 324, 1530–1534 CrossRef CAS PubMed; (b) M. Srivastava, Md. E. Uddin, J. Singh, N. H. Kim and J. H. Lee, J. Alloys Compd., 2014, 590, 266–276 CrossRef CAS; (c) M. Srivastava, A. K. Das, P. Khanra, Md. E. Uddin, N. H. Kim and J. H. Lee, J. Mater. Chem. A, 2013, 1, 9792–9801 RSC.
- S. Y. Jeong, S. Jeong, S. W. Lee, S. T. Kim, D. Kim, H. J. Jeong, J. T. Han, K.-J. Baeg, S. Yang, M. S. Jeong and G.-W. Lee, Sci. Rep., 2015, 5, 11216 CrossRef PubMed.
- J.-H. Chang, W.-H. Lin, P.-C. Wang, J.-I. Taur, T.-A. Ku, W.-T. Chen, S.-J. Yan and C.-I. Wu, Sci. Rep., 2015, 5, 9693 CrossRef CAS PubMed.
- J.-H. Son, S.-J. Baeck, M.-H. Park, J.-B. Lee, C.-W. Yang, J.-K. Song, W.-C. Zin and J.-H. Ahn, Nat. Commun., 2014, 5, 3484 Search PubMed.
- H. Park, S. Chang, M. Smith, S. Gradečak and J. Kong, Sci. Rep., 2013, 3, 1581 CrossRef PubMed.
- R. Raccichini, A. Varzi, S. Passerini and B. Scrosati, Nat. Mater., 2015, 14, 271–279 CrossRef CAS PubMed.
- J.-H. Ahn and B. H. Hong, Nat. Nanotechnol., 2014, 9, 737–738 CrossRef PubMed.
- S. Some, Y. Xu, Y. Kim, Y. Yoon, H. Qin, A. Kulkarni, T. Kim and H. Lee, Sci. Rep., 2013, 3, 1868 CrossRef PubMed.
- X. Sun, H. Hao, H. Ji, X. Li, S. Cai and C. Zheng, ACS Appl. Mater. Interfaces, 2014, 6, 401–409 CAS.
- S. Ju, K.-Y. Lee, S.-J. Min, Y. K. Yoo, K. S. Hwang, S. K. Kim and H. Yi, Sci. Rep., 2015, 5, 9196 CrossRef CAS PubMed.
- H. G. Moon, Y.-S. Shim, D. H. Kim, H. Y. Jeong, M. Jeong, J. Y. Jung, S. M. Han, J. K. Kim, J.-S. Kim, H.-H. Park, J.-H. Lee, H. L. Tuller, S.-J. Yoon and H. W. Jang, Sci. Rep., 2012, 2, 588 CrossRef PubMed.
- X. Lai, D. Wang, N. Han, J. Du, J. Li, C. Xing, Y. Chen and X. Li, Chem. Mater., 2010, 22, 3033–3042 CrossRef CAS.
- W. Yang, P. Wan, X. Zhou, J. Hu, Y. Guan and L. Feng, ACS Appl. Mater. Interfaces, 2014, 6, 21093–21100 CAS.
- Q. Huang, D. Zeng, H. Li and C. Xie, Nanoscale, 2012, 4, 5651–5658 RSC.
- R. K. Mishra, S. B. Upadhyay, A. Kushwaha, T.-H. Kim, G. Murali, R. Verma, M. Srivastava, J. Singh, P. P. Sahay and S. H. lee, Nanoscale, 2015, 7, 11971–11979 RSC.
- J. M. Du, L. Huang and Z. Q. Chen, J. Phys. Chem. C, 2009, 113, 9998 CAS.
- A. Gurlo, N. Barsan, U. Weimar, M. Ivanovskaya, A. Taurino and P. Siciliano, Chem. Mater., 2003, 15, 4377 CrossRef CAS.
- J. Cao, H. Dou, H. Zhang, H. Mei, S. Liu, T. Fei, R. Wang, L. Wang and T. Zhang, Sens. Actuators, B, 2014, 198, 180–187 CrossRef CAS.
- H. Mu, K. Wang, Z. Zhang and H. Xie, J. Phys. Chem. C, 2015, 119, 10102–10108 CAS.
- R. A. Kadir, Z. Li, A. Z. Sadek, R. A. Rani, A. S. Zoolfkar, M. R. Field, J. Z. Ou, A. F. Chrimes and K. Kalantar-zadeh, J. Phys. Chem. C, 2014, 118, 3129–3139 Search PubMed.
- S. Bai, S. Chen, Y. Zhao, T. Guo, R. Luo, D. Li and A. Chen, J. Mater. Chem. A, 2014, 2, 16697–16706 CAS.
- L. Mei, Y. Chen and J. Ma, Sci. Rep., 2014, 4, 6028 CrossRef CAS PubMed.
- R. Xing, L. Xu, J. Song, C. Zhou, Q. Li, D. Liu and H. W. Song, Sci. Rep., 2015, 5, 10717 CrossRef CAS PubMed.
Footnotes |
| † Electronic supplementary information (ESI) available. See DOI: 10.1039/c7ra05685k |
| ‡ Current Affiliation: Department of Electronics Engineering, Incheon National University, Incheon, 406–772, Korea. |
| This journal is © The Royal Society of Chemistry 2017 |

