 Open Access Article
Incipient plasticity of diamond during nanoindentation
Chao Xu *a,
Chunmei Liub and
Haikuo Wangc
aCollege of Science, Wuhan University of Science and Technology, Wuhan 430081, China. E-mail: chaoxuchina@foxmail.com
bCollege of Science, Wuhan University of Science and Technology, Wuhan 430081, China. E-mail: lchunmei001@foxmail.com
cCollege of Materials Science and Engineering, Henan University of Technology, Zhengzhou 450007, China. E-mail: haikuowang001@163.com
First published on 20th July 2017
Abstract
Although diamond is the hardest material, it would still be deformed by indenting. Therefore, investigating its incipient plasticity during the indenting process should be of great interest. Through molecular dynamics simulations, we have investigated the nanoindentations of diamond and probed its incipient plasticity according to the obtained load–displacement (P–h) curve. We found that the incipient plasticity of diamond should result from the propagation of the dislocations and the structural phase transitions from cubic diamond to lonsdaleite. The probable physical processes of incipient plasticity of diamond during nanoindentation were also suggested. The results presented in this work would not only provide clues for detecting the pop-in event of diamond in the future experimental work, but also offer new insights into the plasticity of diamond, which could be beneficial to the design of novel nano-structured superhard materials and elucidating the origins of wear and friction.
1 Introduction
Diamond, known as the hardest material, is widely used under high-stress conditions such as cutting, drilling, grinding tools, as well as indenters and anvils. Therefore, investigating its mechanical response to stress, especially its plastic deformation, has been triggering great interest. Diamond is so difficult to deform that various methods have been tried to study its plasticity, including torsion,1 bending,2 extreme pressure–temperature (P–T) experiments,3–7 and indentations.8,9 It is found that diamond can be plastically deformed at extreme P–T conditions, and at room temperature. For example, in high pressure experiment with diamond anvil cell, massive flow deformations of diamond surfaces can be observed directly.4,5 By Knoop indentation, plastic deformations are also induced.8,9 Deformation areas as well as the dislocation defects are observed, and the possible deformation mechanisms are derived. However, it should be noted that very little is known about the minimum threshold for incipient plasticity of diamond during indenting process, which could be beneficial to the design of novel nano structured superhard materials10–12 and elucidating the origins of wear and friction.13,14Recent advances in investigating the incipient plasticity of materials are due to nanoindentation experiments on the one hand, and to numerical simulations of nanoindentation of crystals on the other. During nanoindentation, the indenter is pressed into a sample, and the force and displacement are recorded simultaneously.15,16 One of the most exciting aspects of nanoindentation on materials concerns the so called “pop-in’’ events, where the displacement excursion (load control mode) or load drop (displacement control mode) occurs, and produces discontinuous steps in otherwise smooth load–displacement curves. Such pop-in event corresponds to an unambiguous transition from reversible elastic to irreversible plastic deformation during the earliest stages of mechanical contact in indentation,17–19 and has been agreed to be a process correlated with dislocation activities. There have been a vast number of pop-in measurements for many materials.20 For diamond, until now, some literatures are also dedicated to its nanoindentation,21–23 but most of these studies have focused on studying the hardness and Young's modulus, while it remains unexplored in pop-in events of diamond. Therefore, the fundamental question regarding incipient plasticity of diamond during nanoindentation should be answered.
Through molecular dynamics (MD) simulations, which have been widely used to investigate the nanoindentations of materials and probe the pop-in events, our purpose here is to probe the incipient plasticity of diamond during nanoindentation, and carefully document the mechanisms and sequence of physical processes occurring underneath the nano-scale indenter during and immediately after the occurrence of the pop-in event.
2 Computational methods
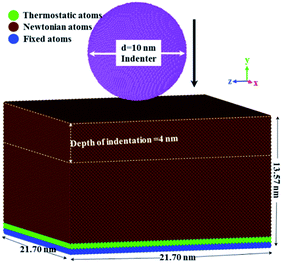
For the simulation, a three-dimensional model consisting of a block of single crystal diamond (21.7 × 21.7 × 13.57 nm3, about 1.2 million atoms) was constructed, as shown in Fig. 1. To reduce the effect of the simulation scale, periodic boundary conditions were chosen along x and z directions, while in y direction, free boundary conditions were considered. In the diamond substrate, carbon atoms were divided into three types, namely fixed atoms, thermostatic atoms, and Newtonian atoms. At the bottom of the substrate, atoms were fixed at their initial lattice positions, to provide structural stability and prevent the sample from moving during the simulation process. The adjacent thermostatic atoms were set to ensure reasonable outward heat conduction, and the Newtonian atoms were set to obey classic Newton's second law.24MD simulations of nanoindentation were performed using LAMMPS code.25 Through the model first described by Kelchner et al.,26 the repulsive potential was used to simulate the frictionless contact between the diamond substrate and spherical rigid indenter. Each atom in the indented diamond sample interacted with the idealized indenter to experience a force of magnitude F(r) = −K(r − R)2, where K, R, r were the force constant, indenter radius, and distance from the atom to the center of the spherical indenter, respectively. The force is repulsive and F(r) = 0 for r > R. This model provides an effective way to study the displacement controlled indentations, and has been widely used for modeling the nanoindentation of different types of materials.27–30 Interactions among the carbon atoms were described using the LCBOP potential, which has been verified to provide an accurate description of diamond.31,32 In our simulation, the three-dimensional model of the specimen was firstly energetically minimized using the conjugate gradient (CG) algorithm to achieve a stable configuration with minimum equilibrium energy. Then, the substrate was further equilibrated using NPT ensemble. The substrate was relaxed at the temperature of 300 K for 20 ps, and the pressure was maintained at 0 bar during whole equilibration process. Through this equilibration process, the sample volume was adjusted to reach the stress-free state, which was necessary for proper calculations of the deformation behavior of diamond substrate during the nanoindentation process. For the indenting simulation process, as most molecular dynamics simulations of nanoindentation, due to the intrinsic limitation of atomistic simulation on time scale, the indenter, which was initially positioned 0.1 nm above the specimen surface, was set to press along y direction at the velocity of 0.01 nm ps−1. This applied loading rate was higher than that in experiments.20,33 When the indentation depth reached 4 nm (410![[thin space (1/6-em)]](https://www.rsc.org/images/entities/char_2009.gif) 000 time steps), the indenter was set to return to its initial position at the same velocity. Unlike nanoindentation experiments, in which the tests are performed in load-control mode, MD simulations are typically done in depth controlled mode by applying a constant penetration rate to the indenter. In our simulation, the spherical indenter was penetrated into (100) plane of diamond. The base vectors x, y and z were set as [001], [100], [010] for the indentation. Identification of defects was done using the dislocation extraction algorithm (DXA).34,35 All structural analysis and visualization of atomic configurations were performed using the open-source visualization tool OVITO.29,36
000 time steps), the indenter was set to return to its initial position at the same velocity. Unlike nanoindentation experiments, in which the tests are performed in load-control mode, MD simulations are typically done in depth controlled mode by applying a constant penetration rate to the indenter. In our simulation, the spherical indenter was penetrated into (100) plane of diamond. The base vectors x, y and z were set as [001], [100], [010] for the indentation. Identification of defects was done using the dislocation extraction algorithm (DXA).34,35 All structural analysis and visualization of atomic configurations were performed using the open-source visualization tool OVITO.29,36
3 Results and discussion
3.1 Testing of the interatomic potential
The credibility of molecular dynamic simulation results strongly depends on the interatomic potential. Unfortunately, no potential is specifically developed for nanoindentation simulations of diamond. Therefore, the availability of LCBOP potential used in this work was systematically tested. We reproduced the elastic constants and other important mechanical parameters of diamond at zero pressure, with previously reported experimental data for reference. As listed in Table 1, diamond has three independent elastic constants, namely C11, C44 and C12. The calculated elastic constants are in good agreement with the experimental data. Based on these elastic constants, we also calculated the bulk modulus (B) and shear modulus (GV and GR), Young's modulus (E), and Poisson's ratio (ν) at zero pressure, as listed in Table 1. The calculated values are consistent well with the experimental data, indicating LCBOP potential used in this work can reasonably reproduce the properties of diamond at zero pressure.| Properties of diamond | MD data in this work | Experiment data |
|---|---|---|
| Elastic constant C11 (GPa) | 1076 | 1079 ± 5,37 1080 ± 5 (ref. 38) |
| Elastic constant C44 (GPa) | 572 | 578 ± 2,37 576.6 ± 0.5 (ref. 38) |
| Elastic constant C12 (GPa) | 119 | 124 ± 5,37 127.0 ± 1 (ref. 38) |
| Bulk modulus B (GPa) | 438 | 442,37,39 444 ± 3 (ref. 40) |
| Shear modulus GV (GPa) Gv = (3C44 + C11 − C12)/5 | 534.6 | 533 (ref. 41) |
Shear modulus GR (GPa)  |
531 | 533 (ref. 41) |
Youngs modulus (GPa)  |
1140 | 1143 (ref. 42) |
Poisson ratio  |
0.0662 | 0.0691 (ref. 42) |
It is known that nanoindentations can induce complex indentation-induced stress fields, accompanying elastic and plastic deformations. The magnitude of the local stress that produces incipient plasticity during nanoindentations has been estimated to reach the theoretical limit of the material.43 However, to our knowledge, the literatures regarding the reliability and reproducibility of LCBOP potential under high stress conditions are still lacking. Therefore, we evaluated the reliability of LCBOP potential at hydrostatic pressure conditions up to 200 GPa. The elastic constants of diamond as functions of pressure are revealed in Fig. 2(a), compared with the previously reported data from MD and DFT methods.44,45 In Fig. 2(a), the elastic constants increase monotonously with pressure in the scope from 0 to 200 GPa. Although the reference data are all from numerical simulations, our data are consisted with the existing data within the acceptable range. By using spinodal (M1 = C11 + 2C12 + P), shear (M2 = C44 − P) and born (M3 = C11 − C12 − 2P) criteria,46,47 we evaluated the elastic stability of diamond reproduced from LCBOP potential at pressures up to 200 GPa, as shown in Fig. 2(b). The elastic stability criteria require Mi (i = 1, 2, 3) to be positive, and the onset of elastic instability occurs when one of the criteria attains to zero for the first time. In Fig. 2(b), with the increasing of pressures, M1 and M2 increase remarkably, while M3 has a slight decrease. Within our testing pressure range, LCBOP potential can reproduce mechanically stable models, indicating the reliability of the LCBOP potential under high stress conditions.
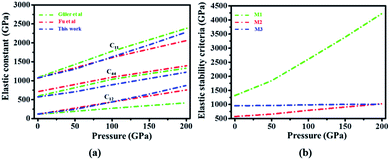 | ||
| Fig. 2 (a) Variations of the calculated elastic constants of diamond with pressure; (b) variations of elastic stability criteria with pressure calculated through LCBOP potential. | ||
3.2 P–h plots and incipient plasticity of diamond
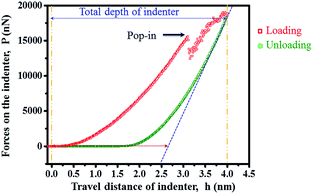
Fig. 3 shows the load–displacement curve of MD nanoindentation simulations. The red and green parts of the curve represent the loading and unloading process, respectively. Through Oliver–Pharr method that enables one estimate the contact area directly from the load–displacement curves,48 we evaluated the elastic modulus of diamond to be 1117 GPa. Clearly, the data calculated are very close to the experimental data, providing a further proof that our simulations are consistent with experimental behavior.As shown in Fig. 3, the loading force (P) first increases monotonically with indentation depth (h). When exceeding a critical value, the displacement suddenly burst, and “pop-in” event occurs. After that, the loading force increases continuously until displacement reaches 4.00 nm, where the retracting of indenter begins. The load–drop occurs at the indentation depths of around 3.11 nm. In our simulations, before the pop-in event, the load–displacement behaviors exhibit elastic recovery upon unloading, with the unloading behaviors coinciding with the loading behaviors. After the pop-in event, an obvious residual depth exists after unloading, indicating plastic deformations. Therefore, such “pop-in” event is associated with the onset of plasticity of diamond.
In nanoindentation experiments, the indenter should be much harder than the samples. But when the samples are diamond, the hardness of the indenter and the diamond samples are almost the same, resulting in series of problems. One is that the indenters can easily be damaged severely when indenting. Though there are some literatures regarding nanoindentations of single crystal diamond, all the indentations are performed deeper than 40 nm, and the data is discontinuously recorded as the scattered data points, with large displacement increments.49–51 This may result in the failure of probing the pop-in events. For MD nanoindentation simulations of diamond, as far as we know, due to high computation costs, all the simulation works are performed with indentation depth lower than 2 nm, and fail to detect the pop-in events.52 Therefore, our discoveries of the pop-in event of diamond provide clues for the future experimental work.
3.3 Dislocations and structural phase transitions
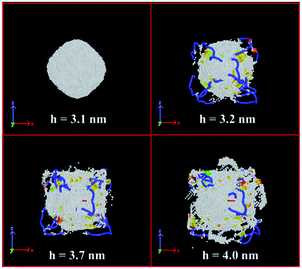
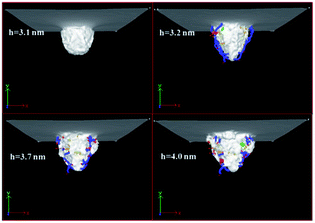
Upward views with the indenting depth of 3.1 nm, 3.2 nm 3.7 nm and 4.0 nm are revealed in Fig. 4, showing the evolution of dislocations in the plastic zone beneath the indenter. For briefly, the cubic diamond structures in the substrate are not shown. At the indentation depth of 3.1 nm, where the pop-in event did not occur, no nucleation of dislocation or dislocation lines were detected under the acting indenter. However, after the pop-in event (h = 3.2 nm), dislocations were observed to transport downward the diamond substrate. Interestingly, the dislocations originated from four different regions, connecting the contact surface and the bottom portion of the plastically deformed zone. Lateral views of the dislocations are shown in Fig. 5. Burgers vectors of the dislocation lines are drawn as the red arrows. Clearly, Burgers vectors are perpendicular to these dislocation lines, suggesting that they are edge dislocations rather than screw dislocations. Almost all the dislocations we detected are 1/2〈110〉 type (blue color), and less than one percent are 1/6〈112〉 type (green color). When the indenting depth continued increasing to 3.7 nm and 4.0 nm, the total length of the dislocation lines only fluctuated in a small range, though volume of the plastic deformation zone increased with the indenting depth.To clarify the origin of the pop-in event, the structural changes of the diamond substrate during nanoindentation were also analyzed, as shown in Fig. 4. Macroscopically, elastic and plastic deformations of diamond would be resulted from the penetration of indenter. But from the microscopic point of view, the distortion of diamond structure as well as the breaking of the diamond bonding would occur. Through analysis algorithm described by E. Maras et al.53 that the second neighbors of atoms are taken into account, it is possible to distinguish cubic diamond structure and lonsdaleite structure, and find atoms that are arranged in a cubic or lonsdaleite lattice. As shown in Fig. 4, we found that the small region under the indenter was first distorted and subsequently broken from diamond structure, producing the disordered carbon states, as shown in Fig. 4. More importantly, when the indenting depth increased to 3.2 nm just after the pop-in event, the region underneath the indenter has a great change. As shown in the figure, except for the disordered carbon state, structure phase transition occurred in four regions according to the Maras's analysis algorithm. Atoms in these four regions (yellow color) are in lonsdaleite structure, and these regions are located just right above the dislocations lines.
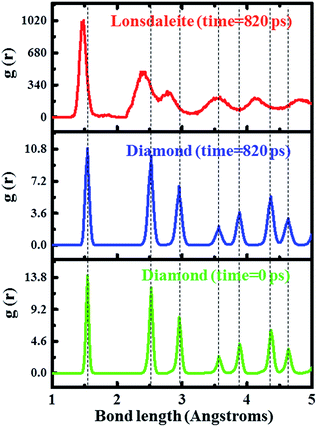
Furthermore, the radial distribution function (RDF) of the substrate was calculated. RDF is the primary linkage between macroscopic thermodynamic properties of the material and the intermolecular interactions. In the past, RDF and bond angle configuration have been used as very effective measures to indicate structural transformations in the materials, especially during contact loading.29,30,48 Similar to the previous reports, RDF was used in our work to study the structure phase transition from cubic diamond to lonsdaleite. We calculated the RDF of the diamond substrate before and after the nanoindentation process, as shown in Fig. 6, and we also calculated the RDF of the atoms in the four regions (yellow color) in Fig. 4. As can be seen in Fig. 6, the peaks of cubic diamond at the simulation time of 0 ps (before the indentation process) are in accordance with that at 820 ps (after the indentation process). But for the RDF of the atoms in the four regions (yellow color) in Fig. 4, the positions of the peaks are obviously different. We found that the positions of the peaks of this phase are in accordance with that of lonsdaleite, indicating the existence of lonsdaleite. Radial distribution functions in Fig. 6 suggest that the lonsdaleite phase existed when indenting to the maximum depth, and finally retracting to the original position. Clearly, the nucleation and multiplication as well as the structural phase transitions of diamond happened, following the pop-in event underneath the indenter. This may have close relationship with the incipient plasticity of diamond.
3.4 Hydrostatic and shear stress analysis
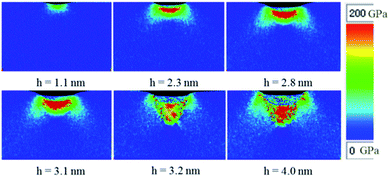
It was demonstrated that the coupling of hydrostatic stress and shear stress would result in significant deformations, or even drive structural phase transformations of materials. Therefore, it is necessary to determine the hydrostatic as well as shear stress distributions induced by nanoindentation. Fig. 7 shows the lateral cross-sectional distribution of the hydrostatic stress at the indenting depth from 1.1 nm to 4.0 nm. The hydrostatic stress was calculated by equation: σhydro = (σx + σy + σz)/3, where σi (i = x, y, z) are the normal stresses calculated through virial theorem. As shown in Fig. 7, when the indenting depth was lower than 3.1 nm, where the pop-in event did not occur, the hydrostatic stress gradually increased with the indenting depth, and reached the maximum value of around 200 GPa. At the same time, the total volume of atoms that suffered such extreme pressure enlarged gradually. However, at the indenting depth of 3.2 nm, the extremely pressed zone collapsed, and the pressure decreased abruptly. As is known, diamond single crystal is extremely incompressible, and it was reported to be used as the anvil of DAC that can sustain the hydrostatic stress up to about 500 GPa.54 Therefore, the hydrostatic stress of around 200 GPa is insufficient to make diamond lose its stability.To gain further insights into the phenomenon, vertical cross-sectional view of the shear stress distributions underneath the indenter were obtained, as shown in Fig. 8. At the indenting depth of 2.3 nm, some carbon atoms were subjected to shear stresses. Interestingly, these atoms were divided in four parts, just located on the diagonal of the square cross section. Moreover, one half of them undergo a positive shear stress while the other half undergoes a negative shear stress. As the indenting depth continues increasing to 3.1 nm, the magnitude of the shear stress increased gradually to around 80 GPa, accompanying the expansion of the total volume of atoms that were subjected the shear stresses. When further indenting the diamond to the depth of 3.2 nm, the extremely sheared region abruptly collapsed, with a rapid decreasing of the shear stress. It is worth noting that the locations where the shear stress concentrated are consisted with the region that the lonsdaleite and the dislocations situated. In addition, the shear stress threshold is around 80 GPa, which reaches the level of the theoretical strength G/2π (G is the shear modulus), and is in accordance with the theory of Shim et al.55 It is demonstrated that when the maximum shear stress reaches the order of theoretical shear strength, it would induce dislocation nucleation inside the defect-free crystal. Subsequently, the change of dislocation configuration would lead to the occurrence of incipient plasticity of materials. Therefore, we assume that such a high shear stress underneath the indenter should cause the dislocation nucleation and multiplication as well as the structural phase transitions of diamond.
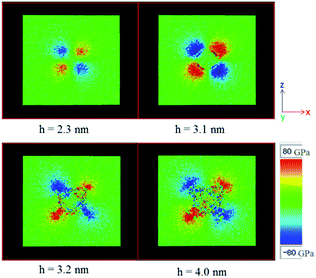 | ||
| Fig. 8 Lateral cross-sectional view of the shear stress at the indentation depth of 2.3 nm, 3.1 nm, 3.2 nm, 4.0 nm. | ||
3.5 Probable physical processes underneath the indenter
The previous experimental and computational results demonstrated that the cubic diamond could transform into lonsdaleite phase under non-hydrostatic loading conditions.18,56–58 In fact, phase transition was firstly considered by Ruoff et al. as a possible failure mode for a diamond flat, which was pressed by a spherical diamond indenter.59 Later on, by coupling the indentation loading with micro-Raman spectroscopy, Gogotsi et al. directly observed the phase transitions of diamond during indenting process, including the transition of cubic diamond to lonsdaleite (hexagonal diamond) and amorphous diamond phase.60–62 Therefore, our results agree well with the reported experimental phenomenon.Through Maras's analysis algorithm53 to distinguish cubic diamond structure and lonsdaleite structure, we have identified the atoms that were arranged in both cubic diamond and lonsdaleite lattice in the indented substrate. Fig. 9 shows the number of atoms in lonsdaleite (green color), compared with the total number of atoms in both lonsdaleite and disordered carbon phases (red color). As is shown, almost no disordered carbon phase existed at the beginning of the indenting process, until the indenter penetrated into a depth of 1.4 nm, where the simulation time was 140 ps. As indenting process went on, the number of the disordered carbon atoms increased rapidly. At around 3.1 nm (320 ps), it reached a peak value. It is worth noting that, at the indenting depth of 3.1 nm, no lonsdaleite atoms were found. However, at 3.2 nm (330 ps), the number of atoms in disordered structure decreased abruptly, in the mean time, a large quantity of lonsdaleite atoms were detected. When continued indenting to the maximum depth of 4.0 nm (410 ps), the number of atoms in the disordered structure increased rapidly, and returned to the previous peak value, while the lonsdaleite atoms only had a slight increase. During the unloading process, the numbers of both types of atoms decreased slightly, and finally tended to asymptotic values respectively.
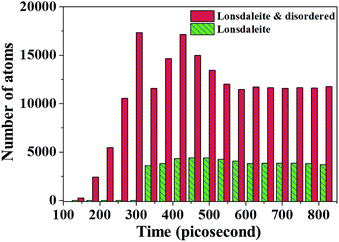 | ||
| Fig. 9 Number of atoms in lonsdaleite (green color) and lonsdaleite added disordered carbon phases (red color) with the nanoindentation simulation time. | ||
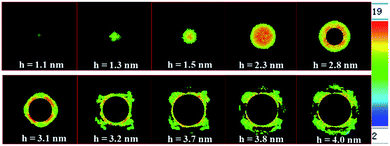
We also analyzed the evolution of coordination numbers. Fig. 10 shows a vertical cross sectional view (2.6 nm downward the diamond surface) of the deformed substrate during nanoindentation. The number of neighbors for each carbon atoms was calculated within a given cutoff radius of 2.6 Å. Therefore, both the first and second nearest neighbors of atoms were considered. For brevity, the atoms in the perfect cubic diamond structure are not shown, and the atoms are colored according to their coordination numbers. At the beginning of the indenting process, though the spherical indenter penetrated into the top surface, the amount of atoms affected by indenting was small. Therefore, on the plane that located 2.6 nm downward the diamond surface, we did not detect any changes of the coordination numbers until the indenting depth of 1.1 nm. As the indenting process went on, the number of the distorted atoms increased, and gradually shaped a circle. Moreover, the coordination number increased to 19, indicating that within the given cutoff radius, more and more neighbors were detected for these atoms. This means that the atomic density and the disorder were increased significantly in this area. When the indenting deeper than 2.6 nm where our selected plane located, the atoms in the center of the circle were pressed downward and affected directly by the indenter. Therefore, when indentation is deeper than 2.6 nm, atoms in the center part of the circle were not shown. At the indenting depth of 3.1 nm, atoms with the highest coordination numbers were accumulated in four parts, whose locations were consisted with the region that suffered the highest shear stress, as shown in Fig. 8. More importantly, when further indenting, the dislocations nucleated and multiplied just from these four regions, as shown in the figure.
According to the analysis above, we assume that the most probable physical processes of the incipient plasticity of diamond during nanoindentation may be as follows: when the indenter penetrated into diamond, carbon atoms would be distorted by bond compressing, shearing and breakings, resulting in the increasing of the amount of disordered carbon atoms. In the mean time, complex hydrostatic and shear stress fields were formed. For the shear stress field, it distributed in four regions, containing dense disordered atoms. As the shear stress continued increasing, and finally reached the theoretical strength of G/2π, dislocations nucleated and propagated from the position of maximum shear stress, and the structural transition to lonsdaleite would occur, resulting in the incipient plasticity of diamond.
4 Conclusions
In summary, through molecular dynamics simulations, we have investigated the nanoindentations of diamond and probed its incipient plasticity during indenting process. The first load drop in the obtained P–h curve directly showed that the incipient plasticity of diamond occurred at the indenting depth of around 3.1 nm. During the incipient plasticity of diamond, 1/2〈110〉 type edge dislocations nucleated and propagated in four regions, in the mean time, cubic diamond to lonsdaleite structural phase transitions occurred at four regions just above the dislocations. Before the pop-in event, the maximum shear stress concentrated in the four regions that the lonsdaleite and the dislocations would situate, and reached around 80 GPa. The stress value is on the order of the theoretical strength G/2π. We assumed the high shear stress underneath the indenter should cause the dislocation nucleation and multiplication as well as the structural phase transitions of diamond, and the probable physical processes of incipient plasticity of diamond during nanoindentation were suggested. The results presented above not only provide clues for detecting the pop-in event of diamond in the future experimental work, but also offer new insights into the plasticity of diamond, which could be beneficial to the design of novel nano structured superhard materials and elucidating their origins of wear and friction.Acknowledgements
We gratefully acknowledge the financial support by the National Natural Science Foundation of China (No. 51502217, No. 11504280, No. U1430117, and No. 11504087).References
- E. Hull and G. Malloy, J. Eng. Ind., 1966, 88, 373–376 CrossRef CAS.
- T. Evans and R. Wild, Philos. Mag., 1965, 12, 479–489 CrossRef CAS.
- D. J. Weidner, Y. Wang and M. T. Vaughan, Science, 1994, 266, 419–422 CAS.
- H. Mao and P. Bell, Science, 1978, 200, 1145–1147 CAS.
- M. I. Eremets, I. A. Trojan, P. Gwaze, J. Huth, R. Boehler and V. D. Blank, Appl. Phys. Lett., 2005, 87, 1902 CrossRef.
- X. Yu, P. Raterron, J. Zhang, Z. Lin, L. Wang and Y. Zhao, Sci. Rep., 2012, 2, 876 Search PubMed.
- H. Sumiya, Y. Nakamoto, K. Shimizu and H. Kanda, Appl. Phys. Lett., 2008, 93, 101915 CrossRef.
- P. Humble and R. Hannink, Nature, 1978, 273, 37–39 CrossRef CAS.
- H. Sumiya, K. Yamaguchi and S. Ogata, Appl. Phys. Lett., 2006, 88, 161904 CrossRef.
- R. Valiev, Nature, 2002, 419, 887–889 CrossRef CAS PubMed.
- Q. Huang, D. Yu, B. Xu, W. Hu, Y. Ma, Y. Wang, Z. Zhao, B. Wen, J. He and Z. Liu, Nature, 2014, 510, 250–253 CrossRef CAS PubMed.
- K. Tanigaki, H. Ogi, H. Sumiya, K. Kusakabe, N. Nakamura, M. Hirao and H. Ledbetter, Nat. Commun., 2013, 4, 2343 Search PubMed.
- M. Urbakh, J. Klafter, D. Gourdon and J. Israelachvili, Nature, 2004, 430, 525–528 CrossRef CAS PubMed.
- B. Bhushan, J. N. Israelachvili and U. Landman, Nature, 1995, 374, 607–616 CrossRef CAS.
- W. Paul, D. Oliver, Y. Miyahara and P. H. Grütter, Phys. Rev. Lett., 2013, 110, 135506 CrossRef PubMed.
- W. Paul, D. Oliver and P. Grütter, Phys. Chem. Chem. Phys., 2014, 16, 8201–8222 RSC.
- H. Bei, E. P. George, J. Hay and G. M. Pharr, Phys. Rev. Lett., 2005, 95, 045501 CrossRef CAS PubMed.
- H. He, T. Sekine and T. Kobayashi, Appl. Phys. Lett., 2002, 81, 610–612 CrossRef CAS.
- S. Pathak, J. L. Riesterer, S. R. Kalidindi and J. Michler, Appl. Phys. Lett., 2014, 105, 161913 CrossRef.
- Y. Gao and H. Bei, Prog. Mater. Sci., 2016, 82, 118–150 CrossRef CAS.
- A. Richter, R. Ries, R. Smith, M. Henkel and B. Wolf, Diamond Relat. Mater., 2000, 9, 170–184 CrossRef CAS.
- N. Dubrovinskaia, S. Dub and L. Dubrovinsky, Nano Lett., 2006, 6, 824–826 CrossRef CAS PubMed.
- H. Couvy, D. Lahiri, J. Chen, A. Agarwal and G. Sen, Scr. Mater., 2011, 64, 1019–1022 CrossRef CAS.
- X. Du, H. Zhao, L. Zhang, Y. Yang, H. Xu, H. Fu and L. Li, Sci. Rep., 2015, 5, 16275 CrossRef CAS PubMed.
- S. Plimpton, J. Comput. Phys., 1995, 117, 1–19 CrossRef CAS.
- C. L. Kelchner, S. J. Plimpton and J. C. Hamilton, Phys. Rev. B: Condens. Matter Mater. Phys., 1998, 58, 11085–11088 CrossRef CAS.
- G. S. Smith, E. B. Tadmor and E. Kaxiras, Phys. Rev. Lett., 2000, 84, 1260–1263 CrossRef CAS PubMed.
- T. Tsuru and Y. Shibutani, Phys. Rev. B: Condens. Matter Mater. Phys., 2007, 75, 035415 CrossRef.
- S. Goel, B. Beake, C. W. Chan, N. Haque Faisal and N. Dunne, Mater. Sci. Eng., A, 2015, 627, 249–261 CrossRef CAS.
- J. Zhang, J. Zhang, Z. Wang, A. Hartmaier, Y. Yan and T. Sun, Comput. Mater. Sci., 2017, 131, 55–61 CrossRef CAS.
- J. H. Los and A. Fasolino, Phys. Rev. B: Condens. Matter Mater. Phys., 2003, 68, 024107 CrossRef.
- H. Xie, F. Yin and T. Yu, Appl. Phys. Lett., 2014, 104, 031911 CrossRef.
- P. E. Loya, Y. Z. Xia, C. Peng, H. Bei, P. Zhang, J. Zhang, E. P. George, Y. F. Gao and J. Lou, Appl. Phys. Lett., 2014, 104, 251909 CrossRef.
- S. Alexander and A. Karsten, Modell. Simul. Mater. Sci. Eng., 2010, 18, 085001 CrossRef.
- S. Alexander, V. B. Vasily and A. Athanasios, Modell. Simul. Mater. Sci. Eng., 2012, 20, 085007 CrossRef.
- S. Alexander, Modell. Simul. Mater. Sci. Eng., 2010, 18, 015012 CrossRef.
- H. J. McSkimin and P. Andreatch Jr, J. Appl. Phys., 1972, 43, 2944–2948 CrossRef CAS.
- R. Vogelgesang, A. K. Ramdas, S. Rodriguez, M. Grimsditch and T. R. Anthony, Phys. Rev. B: Condens. Matter Mater. Phys., 1996, 54, 3989–3999 CrossRef CAS.
- M. H. Grimsditch and A. K. Ramdas, Phys. Rev. B: Solid State, 1975, 11, 3139–3148 CrossRef CAS.
- I. Aleksandrov, A. Goncharov, A. Zisman and S. Stishov, J. Exp. Theor. Phys., 1987, 93, 680–691 CAS.
- E. C. Robertson, J. F. Hays and L. Knopoff, The Nature of the Solid Earth: Dedicated to Francis Birch, McGraw-Hill, 1972 Search PubMed.
- C. A. Klein and G. F. Cardinale, Diamond Relat. Mater., 1993, 2, 918–923 CrossRef CAS.
- L. Zhang and T. Ohmura, Phys. Rev. Lett., 2014, 112, 145504 CrossRef PubMed.
- E. Güler and M. Güler, Chin. J. Phys., 2015, 53, 040807 Search PubMed.
- Z. J. Fu, G. F. Ji, X. R. Chen and Q. Q. Gou, Commun. Theor. Phys., 2009, 51, 1129 CrossRef CAS.
- J. Wang, S. Yip, S. R. Phillpot and D. Wolf, Phys. Rev. Lett., 1993, 71, 4182–4185 CrossRef CAS PubMed.
- K. Xiong, H. Lu and J. Gu, Comput. Mater. Sci., 2016, 115, 214–226 CrossRef CAS.
- S. Goel, A. Agrawal and N. H. Faisal, Wear, 2014, 315, 38–41 CrossRef CAS.
- T. Sawa and K. Tanaka, Philos. Mag. A, 2002, 82, 1851–1856 CAS.
- M. Popov, M. Kyotani, R. J. Nemanich and Y. Koga, Phys. Rev. B: Condens. Matter Mater. Phys., 2002, 65, 033408 CrossRef.
- N. Dub, V. V. Brazhkin, V. A. Belous, G. N. Tolmacheva and P. V. Konevskii, Journal of Superhard Materials, 2014, 36, 217–230 CrossRef.
- D. Christopher, R. Smith and A. Richter, Nucl. Instrum. Methods Phys. Res., Sect. B, 2001, 180, 117–124 CrossRef CAS.
- E. Maras, O. Trushin, A. Stukowski, T. Ala-Nissila and H. Jónsson, Comput. Phys. Commun., 2016, 205, 13–21 CrossRef CAS.
- N. Dubrovinskaia, L. Dubrovinsky, N. A. Solopova, A. Abakumov, S. Turner, M. Hanfland, E. Bykova, M. Bykov, C. Prescher, V. B. Prakapenka, S. Petitgirard, I. Chuvashova, B. Gasharova, Y. L. Mathis, P. Ershov, I. Snigireva and A. Snigirev, Sci. Adv., 2016, 2, e1600341 Search PubMed.
- S. Shim, H. Bei, E. P. George and G. M. Pharr, Scr. Mater., 2008, 59, 1095–1098 CrossRef CAS.
- H. Chacham and L. Kleinman, Phys. Rev. Lett., 2000, 85, 4904–4907 CrossRef CAS PubMed.
- A. P. Jones, P. F. McMillan, C. G. Salzmann, M. Alvaro, F. Nestola, M. Prencipe, D. Dobson, R. Hazael and M. Moore, Lithos, 2016, 265, 214–221 CrossRef CAS.
- B. Wen, M. J. Bucknum, J. Zhao, X. Guo and T. Li, Diamond Relat. Mater., 2008, 17, 1353–1355 CrossRef CAS.
- A. L. Ruoff and J. Wanagel, Science, 1977, 198, 1037–1038 CAS.
- Y. G. Gogotsi, A. Kailer and K. G. Nickel, J. Appl. Phys., 1998, 84, 1299–1304 CrossRef CAS.
- Y. G. Gogotsi, A. Kailer and K. G. Nickel, Nature, 1999, 401, 663–664 CrossRef CAS.
- Y. G. Gogotsi, A. Kailer and K. G. Nickel, Mater. Res. Innovations, 1997, 1, 3–9 CrossRef CAS.
| This journal is © The Royal Society of Chemistry 2017 |

