 Open Access Article
Construction of SnO2/graphene-like g-C3N4 with enhanced visible light photocatalytic activity†
Haiyan Jia,
Yamin Fana,
Jia Yanb,
Yuanguo Xu b,
Xiaojie Shea,
Jiemin Gua,
Ting Feia,
Hui Xu
 *a and
Huaming Li*a
aSchool of Materials Science and Engineering, Institute for Energy Research, Jiangsu University, Zhenjiang 212013, China. E-mail: xh@ujs.edu.cn
bSchool of Chemistry and Chemical Engineering, Jiangsu University, Zhenjiang 212013, China
First published on 20th July 2017
Abstract
In this work, SnO2/graphene-like g-C3N4 (SnO2/GL-C3N4) composite photocatalysts with large surface areas and abundant coupling heterointerfaces were synthesized using a hydrothermal method. The as-prepared photocatalysts exhibited distinctly manifested efficient visible light activities toward organic pollutant degradation, demonstrating remarkable synergistic effects between SnO2 and graphene-like g-C3N4 (GL-C3N4). The 25 wt% SnO2/GL-C3N4 composite showed optimal photocatalytic activity under visible light irradiation, which was almost 9 and 2.5 times as high as that of SnO2 and GL-C3N4, respectively. In addition, the possible photocatalytic mechanism of rhodamine B (RhB) degradation by SnO2/GL-C3N4 under visible light was also discussed in detail. Moreover, this work would provide a facile way for the fabrication of novel two dimension/two dimension (2D/2D) GL-C3N4-based photocatalysts with high and stable performance for pollutant degradation.
1. Introduction
Currently, with the rapid development of global industrialization, industrial wastewater treatment has become a big problem. Many measures have been used to alleviate the environmental issues. Photocatalysis with clean and economical energy has revealed wide prospects in application for the treatment of organic wastewater. Therefore, using semiconductor-based photocatalysts for the degradation of organic pollutants is considered as a sustainable and prospective solution for wastewater purification.1Graphitic carbon nitride (g-C3N4) is a promising heterogeneous metal-free, non-toxic semiconductor with narrow band gap, good thermal stability, high chemical stability and interesting electronic properties,2,3 has been widely researched for catalysis-driven application,4,5 electrochemical application,6 bio-chemical application,7 biosensor application8 and so on. And yet, it is found that the layered stacking structure and small specific surface area of g-C3N4 hinder the effective separation of photoinduced electron–hole pairs, thus made g-C3N4 suffering from rapid recombination of photogenerated electron–hole pairs. Therefore, researchers have made great efforts to solve these problems. It is well known that two dimension (2D) materials have advantages: (1) atomic thickness which could shorten the routine that photogenerated electrons and holes had to pass in order to participate in the photocatalytic reaction quickly, (2) large surface areas that could expose more active sites.9–12 Indeed, it has been reported that g-C3N4 could be easily exfoliated into 2D graphene-like g-C3N4 nanosheets (GL-C3N4)13 with larger surface area and high photocatalytic activity.14,15 The obtained GL-C3N4 had a typical 2D structure with thickness of 2–3 nm and band gap of 2.85 eV, exhibited excellent performance in catalysis.10 However, the visible light photocatalytic activity of GL-C3N4 doesn't meet expectations,16 therefore, continue to decrease the high recombination rate of photogenerated electrons and holes of GL-C3N4 is necessary. Lately, 2D/2D materials have attracted extensive attention due to (1) enlarged contact area in interface region that could accelerate the charge carrier separation and inhibit its recombination,17,18 (2) forming a low Schottky barrier height junction which could reduce contact resistance and facilitate carrier transport.19 It is obvious that combining GL-C3N4 with other 2D materials forming 2D/2D structures so as to obtain more surface area and high coupling heterointerfaces extent, that could effectively facilitate separation/transfer of photoinduced electron–hole pairs, and thus improve the catalytic performance of GL-C3N4.18 Several studies have proven that combining g-C3N4 nanosheet with other 2D materials to form 2D/2D structures can indeed efficiently suppressed the recombination of photoinduced electron–hole pairs, endues the composites with enhanced properties as a result of the synergistic effects see in carbonized poly(furfural alcohol)/g-C3N4,17 rGO/g-C3N4,20 SnNb2O6/g-C3N4.18
SnO2, a n-type semiconductor, has become one of the hot spots in the field of photocatalysis research attributed to its high photosensitivity, good transparency, environmental friendliness and low cost.21 SnO2 based semiconductors such as Fe2O3/SnO2,22 CuO–SnO2,23 SnO2/TiO2,24 SnO/SnO2,25 SnO2/Fe2O3,26 SnO2/ZnS21 showed stable and outstanding performances in photocatalysis. Especially, 2D SnO2 nanosheets can provide many promising properties for improving photocatalytic performance, which to a large extent benefit from their confined thickness and large specific surface. The existing literature proved that compounding SnO2 nanosheets with other suitable materials forming composites with intimate connection and continuity in lattice, like SnO2 nanosheets–CdSe nanocrystallites,27 porous ZnO–SnO2 nanosheets,28 could help for facilitating the separations of photoinduced electron–hole pairs more effectively. However, there are few reports coupling GL-C3N4 with SnO2 nanosheet together as to construct 2D/2D SnO2 nanosheets/graphene-like g-C3N4 (SnO2/GL-C3N4) in order to enhance photocatalytic performance for both GL-C3N4 and SnO2 in the visible light region.
In this work, we report novel hybrid architecture of SnO2/GL-C3N4 for photocatalytic environmental application. The SnO2/GL-C3N4 photocatalysts were synthesized by an environmentally friendly hydrothermal method via the in situ growth of GL-C3N4 in the presence of SnO2 nanosheets. The visible-light-driven photocatalytic activities of SnO2/GL-C3N4 composites were evaluated by the degradation of RhB. It has been found that the optimal photocatalytic activity over 25 wt% SnO2/GL-C3N4 was almost 9 times as high as that of SnO2 precursor, and 2.5 times higher than that of GL-C3N4 precursor, respectively. The crystal structure, chemical state of elements, chemical composition, structural information, microstructure and grain morphology of the synthesized photocatalysts were analyzed by X-ray diffraction (XRD), X-ray photoelectron spectra (XPS), Fourier transform infrared spectra (FT-IR), scanning electron microscopy (SEM) and transmission electron microscopy (TEM), respectively. In addition, photoluminescence (PL) spectra, transient photocurrent response and electrochemical impedance spectroscopy (EIS) analysis also demonstrated that the introduction of SnO2 could decrease the high recombination rate of photogenerated electron–hole pairs, which would consequently improve the visible-light photo-catalytic activity of GL-C3N4.
2. Experimental section
2.1. Materials
Stannous chloride (SnCl2·2H2O, A.R. grade), ammonia solution (NH3·H2O, A.R. grade), dicyandiamide (C2H4N4, C.P. grade), ethanol (C2H5OH, A.R. grade), ammonium chloride (NH4Cl, A.R. grade), all the starting materials were used directly without purification.2.2. Material synthesis
SnO2 nanosheets,29 g-C3N4 and GL-C3N4 (ref. 13) were synthesized according to the reported procedure. The SnO2/GL-C3N4 photocatalysts were synthesized by hydrothermal method. In this process, 0.015 g SnO2, 0.1 g g-C3N4 and 0.5 g NH4Cl were added into 40 mL solvent composed of 10 mL alcohol and 30 mL deionized water under vigorous stirring and ultra-sonication for 1 h. Afterwards, the mixture was transferred into 50 mL Teflon-lined autoclave, and putted into a 180 °C drying oven for 12 h. At last, the photocatalyst was collected by centrifugation, washing with ethanol and distilled water repeatedly, and frozen drying for 12 h. The obtained product was 15 wt% SnO2/GL-C3N4. Different weight percent (15 wt%, 25 wt%, 35 wt%) of SnO2/GL-C3N4 photocatalysts were synthesized with the similar procedure.2.3. Characterization
The compositions and crystal structure of the as-prepared samples were analyzed by XRD obtained on a Bruker D8 diffractometer using Cu Kα radiation (λ = 1.5418 Å) in 2θ range of 10–80° with the scanning rate of 7° min−1. The nitrogen adsorption–desorption isotherms were recorded on a TriStar II 3020 surface area and porosity analyzer. XPS was used to further determine the composition and electronic state of the SnO2 nanosheets, GL-C3N4 and SnO2/GL-C3N4 using an ESCA Lab MKII X-ray photo-electron spectrometer using Mg Kα radiation. FT-IR was performed on a FT-IR Nexus 470 spectrometer, taking with KBr as standard material at room temperature to reveal the structural information of obtained samples. The compositions and morphologies of the samples were observed by SEM, TEM, high resolution transmission electron microscope (HRTEM), elemental mapping and energy-dispersive X-ray spectroscopy (EDS). And SEM, elemental mapping, EDS were taken with a JEOL-JSM-7001F while TEM, HRTEM were operated at 200 kV on a JEOL-JEM-2010 made in Japan. Ultraviolet-visible (UV-vis) diffuse reflection spectra (DRS) of the samples were recorded on an UV-2425 UV-vis spectrophotometer made in Shimadzu, Japan from the range of 200 nm to 800 nm, and BaSO4 was employed as a reflectance standard. Photocurrents and EIS were performed at a CHI 660B electro-chemical workstation made in Chenhua Instrument Company (Shanghai, China). PL experiments were obtained on QuantaMaster & TimeMaster Spectrofluorometer using excitation wavelength at 387 nm and 275 nm, respectively. X-band equivalent series resistance (ESR) spectra were measured by a JES FA200 spectrometer at ambient temperature, operating at 9.5 GHz.2.4. Photocatalytic experiments
Photocatalytic activities of the as-synthesized catalysts were assessed by photocatalytical degradation of RhB irradiated under the visible light in a custom-made photochemical reactor with air bubbling. 50 mg of the photocatalyst powder was directly dispersed in 50 mL of RhB aqueous solution (10 mg L−1) with continuous stirring at 30 °C. At first, all the suspensions were continuously stirred for half an hour in dark condition, in order to establish an adsorption/desorption balance. Then open the spherical Xe lamp (300 W) with a cut-off light filter (λ > 420 nm) which was used as visible light source. At every 30 min, about 4.0 mL solution suspension would be taken out and detected by a UV-vis spectrophotometer (Cary, 8584; NYSE:A) at 553 nm which is the characteristic maximum absorption wavelength of RhB. The following formula (eqn (1)) was used to obtain the photocatalytic degradation efficiency (E) of RhB:
 | (1) |
2.5. Photoelectrochemical measurements
Photocurrents were measured in a standard three-electrode experimental system, employing a Pt wire as the counter electrode and the sample modified indium-tin oxide glass (ITO) as the working electrode while a saturated Ag/AgCl electrode as the reference electrode. Phosphate buffered saline (PBS, pH = 7.0) was used as the supporting electrolyte solution of photocurrent measurements and the light source was a 500 W Xe arc lamp. GL-C3N4, SnO2 and SnO2/GL-C3N4 electrodes were prepared with the procedure: At first, dispersing 5.0 mg sample powder in 1.0 mL ethylene glycol by ultrasound. Afterward, 20 μL as-prepared dispersion (5 mg mL−1) was one-off drop-cast onto a piece of ITO (0.5 × 1 cm2) with the infrared lamp irradiation, as to form the sample modified ITO electrode. EIS of different electrodes were measured in 0.1 M KCl solution containing 5 mM K4[Fe(CN)6]/K3[Fe(CN)6] under sunless conditions. And every Nyquist plot was recorded in frequency range of 100 MHz to 100 kHz.3. Results and discussion
3.1. XRD, FT-IR analyses
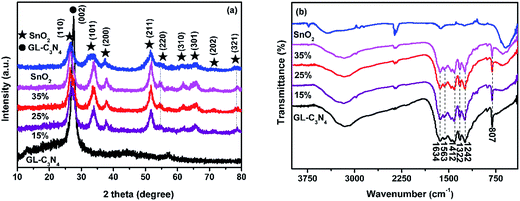
The XRD patterns of the GL-C3N4, SnO2 and SnO2/GL-C3N4 samples with different weight percent of SnO2 were shown in Fig. 1(a). It could be seen that the peaks of SnO2/GL-C3N4 were distinctly similar to that of SnO2, indicating that SnO2 has no obvious change during the material preparation. In addition, the SnO2/GL-C3N4 composites showed the sole SnO2 peaks without the GL-C3N4 peak owing to the reason that, the peak of (002) crystal plane of GL-C3N4 maybe overlapped with the peak of (110) crystal plane of SnO2 since the two were very close. The pure SnO2 exhibited several peaks at 2θ = 26.7°, 33.7°, 38.1°, 51.8°, 54.9°, 61.7°, 65.4°, 71.1° and 78.4° corresponding to (110), (101), (200), (211), (220), (310), (301), (202) and (321) plane of a tetragonal rutile-like SnO2.29,30 The strong and sharp peak at 2θ = 27.8° could be corresponded to the (002) diffraction plane of GL-C3N4, this is consistent with the reported literature.1 No impurity peaks in GL-C3N4, SnO2 and SnO2/GL-C3N4, indicating that those photocatalysts were successfully prepared in this work.The FT-IR spectrum enables us to distinguish the molecular structure of SnO2, GL-C3N4 and SnO2/GL-C3N4 composites (Fig. 1(b)). With regard to the SnO2/GL-C3N4 composites, both GL-C3N4 and SnO2 could be detected confirming the SnO2/GL-C3N4 composites were successful synthesized. The peaks at 807, 1100–1650, 2400 cm−1 in the GL-C3N4 spectrum corresponded to the unique breathing mode of triazine units,31–33 characteristic stretching modes of the C![[double bond, length as m-dash]](https://www.rsc.org/images/entities/char_e001.gif) N and C–N heterocycles,31 adsorption of CO2 in the environment, respectively. And the broad band at 3000–3600 cm−1 was attributed to the residual N–H group.34 SnO2 showed only a broad strong peak at 400–700 cm−1, which could be ascribed to the anti-symmetric stretching vibration of Sn–O–Sn.25,35,36 Compared with pure SnO2, the band at 597 cm−1 was red-shifted in SnO2/GL-C3N4 composites, suggesting that there were interactions between SnO2 and GL-C3N4.
N and C–N heterocycles,31 adsorption of CO2 in the environment, respectively. And the broad band at 3000–3600 cm−1 was attributed to the residual N–H group.34 SnO2 showed only a broad strong peak at 400–700 cm−1, which could be ascribed to the anti-symmetric stretching vibration of Sn–O–Sn.25,35,36 Compared with pure SnO2, the band at 597 cm−1 was red-shifted in SnO2/GL-C3N4 composites, suggesting that there were interactions between SnO2 and GL-C3N4.
3.2. XPS analysis
XPS analyses were conducted to determine the composition and surface electronic state of SnO2, GL-C3N4 and 25 wt% SnO2/GL-C3N4 composite. As shown in Fig. 2(a), SnO2 was composed of Sn, O elements and for the pure GL-C3N4, only C and N elements were detected, while the 25 wt% SnO2/GL-C3N4 was composed of C, N, Sn and O elements. High-resolution of C 1s, N 1s, Sn 3d and O 1s spectra of the material were plotted in Fig. 2(b)–(e) in details. It could be observed in Fig. 2(b) that C 1s for GL-C3N4 had two peaks at 288.2 and 284.7 eV. The peak at 284.7 eV due to carbon contamination which could be observed on the XPS characterization for all samples in Fig. 2(b), while the C 1s at 288.2 eV was associated with sp2-bonded carbon (N–C![[double bond, length as m-dash]](https://www.rsc.org/images/entities/char_e001.gif) N) which had been shift to 288.4 eV in 25 wt% SnO2/GL-C3N4.31,37,38 The shift of C 1s at 288.4 eV in 25 wt% SnO2/GL-C3N4 could be attributed to the strong interactions between SnO2 and GL-C3N4 which had influenced the chemical environments of N–C
N) which had been shift to 288.4 eV in 25 wt% SnO2/GL-C3N4.31,37,38 The shift of C 1s at 288.4 eV in 25 wt% SnO2/GL-C3N4 could be attributed to the strong interactions between SnO2 and GL-C3N4 which had influenced the chemical environments of N–C![[double bond, length as m-dash]](https://www.rsc.org/images/entities/char_e001.gif) N. Fig. 2(c) showed that the N 1s peak located at 398.7 eV in GL-C3N4 originated from C
N. Fig. 2(c) showed that the N 1s peak located at 398.7 eV in GL-C3N4 originated from C![[double bond, length as m-dash]](https://www.rsc.org/images/entities/char_e001.gif) N–C coordination37 was shift to 398.9 eV in 25 wt% SnO2/GL-C3N4 composite proving that there was existing an interaction between SnO2 and GL-C3N4. The binding energy of Sn 3d peaks in SnO2 located at 495.6 and 487.2 eV were ascribed to Sn 3d5/2 and Sn 3d3/2 of Sn4+ oxidation state, respectively39 (Fig. 2(d)). Obviously, the corresponding Sn 3d peaks of 25 wt% SnO2/GL-C3N4 were shift to 495.1 and 486.7 eV, respectively. The shift providing evidence of the interactions between SnO2 and GL-C3N4. The O 1s peak in SnO2 at 531.2 eV should be ascribed to Sn–O–Sn (lattice O),21 which changed to 530.6 eV in 25 wt% SnO2/GL-C3N4 also demonstrating that there were some interactions between SnO2 and GL-C3N4 (Fig. 2(e)). Fig. 2(f) showed the VB X-ray photoelectron spectra of SnO2, which was 1.21 eV. The valence band value of as-prepared SnO2 was different from that of normal SnO2 in previous works. The cause of this phenomenon was discussed in detail in DRS section. Together with FT-IR and XRD results we knew that, GL-C3N4, SnO2 and SnO2/GL-C3N4 were successfully prepared in this work, and there were interactions between SnO2 and GL-C3N4 in SnO2/GL-C3N4 composites.
N–C coordination37 was shift to 398.9 eV in 25 wt% SnO2/GL-C3N4 composite proving that there was existing an interaction between SnO2 and GL-C3N4. The binding energy of Sn 3d peaks in SnO2 located at 495.6 and 487.2 eV were ascribed to Sn 3d5/2 and Sn 3d3/2 of Sn4+ oxidation state, respectively39 (Fig. 2(d)). Obviously, the corresponding Sn 3d peaks of 25 wt% SnO2/GL-C3N4 were shift to 495.1 and 486.7 eV, respectively. The shift providing evidence of the interactions between SnO2 and GL-C3N4. The O 1s peak in SnO2 at 531.2 eV should be ascribed to Sn–O–Sn (lattice O),21 which changed to 530.6 eV in 25 wt% SnO2/GL-C3N4 also demonstrating that there were some interactions between SnO2 and GL-C3N4 (Fig. 2(e)). Fig. 2(f) showed the VB X-ray photoelectron spectra of SnO2, which was 1.21 eV. The valence band value of as-prepared SnO2 was different from that of normal SnO2 in previous works. The cause of this phenomenon was discussed in detail in DRS section. Together with FT-IR and XRD results we knew that, GL-C3N4, SnO2 and SnO2/GL-C3N4 were successfully prepared in this work, and there were interactions between SnO2 and GL-C3N4 in SnO2/GL-C3N4 composites.
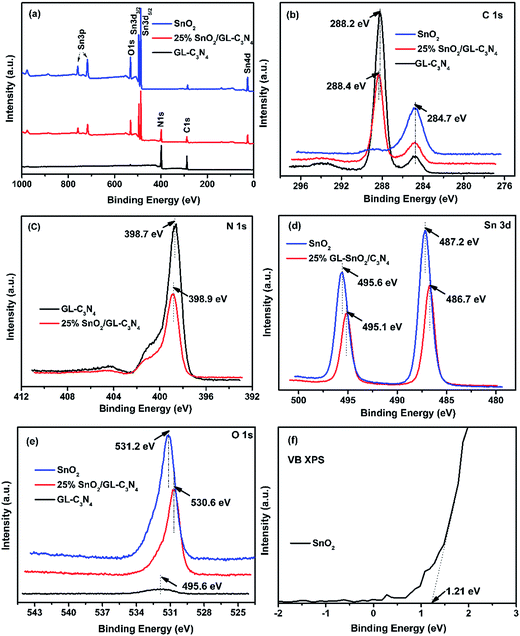 | ||
| Fig. 2 XPS spectra of SnO2, GL-C3N4 and 25 wt% SnO2/GL-C3N4 composite, (a) survey spectra, (b) C 1s, (c) N 1s, (d) Sn 3d, (e) O 1s, (f) VB XPS of SnO2. | ||
3.3. SEM and TEM analyses
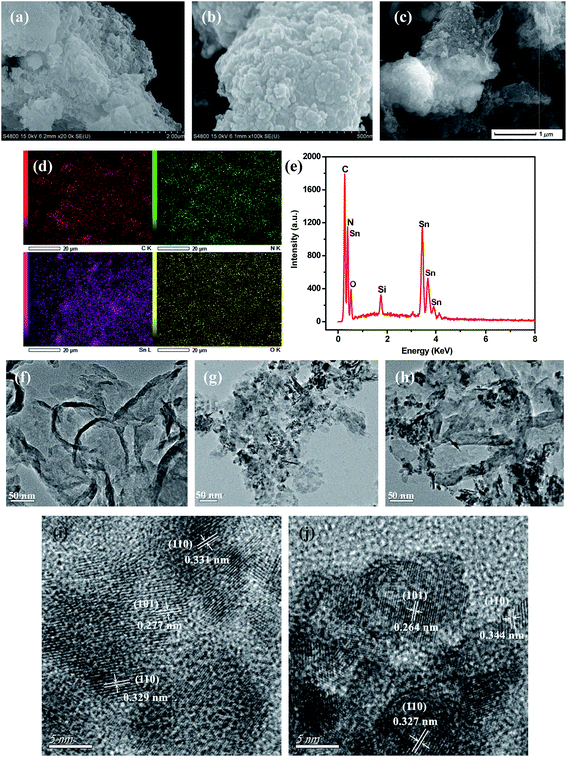
Fig. 3 displayed typical SEM and TEM images of SnO2, GL-C3N4, 25 wt% SnO2/GL-C3N4 composite as well as the elemental mapping, EDS of 25 wt% SnO2/GL-C3N4 composite, HRTEM images of pure SnO2 and 25 wt% SnO2/GL-C3N4. As shown in Fig. 3(a) and (f), GL-C3N4 was a fewer layered structure similar to the structure of graphene, which was consistent with previous reports.33 Fig. 3(b), (g) and (i) showed SEM image, TEM image, HRTEM image recorded from frame marked region in (g) of bulk SnO2, respectively. While it could be seen in Fig. 3(b) that, SnO2 exhibited layer structure formed by the tiny pieces with size smaller than that of GL-C3N4. Fig. 3(g) and (i) showed that the synthesized SnO2 lamellar nanosheets had irregular shape and size, which were unlike normal 2D SnO2 (ref. 29 and 40) nanosheets (which had complete crystallization, thin and structured morphology). The lattice spacing of SnO2 nanosheet were estimated to be near 0.27 nm, 0.33 nm, and corresponding to the (101), (110) plane of SnO2, respectively (Fig. 3(i)). So the irregular shape of the synthesized SnO2 nanosheets may be caused by the incomplete crystallization which could due to the uneven cooling in Teflon-lined autoclave. Fig. 3(c), (h) and (j) were SEM image, TEM image, HRTEM image recorded from frame marked region in (h) of 25 wt% SnO2/GL-C3N4 composite, respectively. As expected, the 25 wt% SnO2/GL-C3N4 composite exhibited nanosheets structure and in which SnO2 was wrapped around GL-C3N4, indicating that both SnO2 and GL-C3N4 were exfoliated by this hydrothermal method. While the presence of SnO2 may have influenced the exfoliating of g-C3N4 into 2D GL-C3N4, this caused GL-C3N4 to have loose structure and smaller size.41 As shown in Fig. 3(j), GL-C3N4 displayed large area without crystal lattice and the interplanar spacing were estimated to be near 0.27 nm, 0.33 nm, and corresponding to the (101), (110) plane of SnO2, verifying the existence of GL-C3N4 and SnO2 nanosheets in 25 wt% SnO2/GL-C3N4. Moreover, the interaction of SnO2 and GL-C3N4 brought them a close integration, and the intimate contact between SnO2 and GL-C3N4 would lead to a close interface between the two semiconductors. And this close interface allowed for the charge transfer between SnO2 and GL-C3N4, promoting the separation of photoinduced electrons and holes, and increased the visible light photocatalytic activity of composites consequently. The elemental mapping and EDS (Fig. 3(d) and (e)) indicated that the 25 wt% SnO2/GL-C3N4 composite containing C, N, Sn and O elements, verifying the existence of GL-C3N4 and SnO2 nanosheets in 25 wt% SnO2/GL-C3N4. And the elemental mapping of elements C, N, Sn and O were uniformly distributed throughout the whole region of 25 wt% SnO2/GL-C3N4 composite shown in Fig. 3(d). Those results gave reliable evidence that SnO2 nanosheets were successfully combined with GL-C3N4, forming the typical 2D/2D structure which was presumed to play an important part in promoting the photo-induced electrons and holes transfer across the SnO2 and GL-C3N4 contact interface, hence reducing the recombination of photoinduced electron–hole carriers.3.4. N2 adsorption–desorption and UV-vis analysis
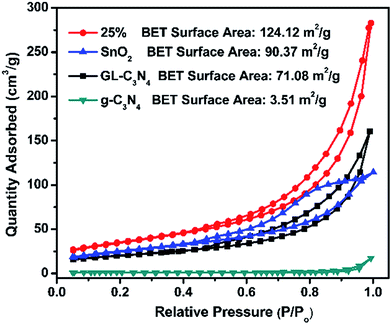
N2 adsorption–desorption isotherms in Fig. 4 were used for the analysis of BET specific surface areas of SnO2/GL-C3N4 composites. It could be seen that the BET specific surface area of g-C3N4, GL-C3N4, SnO2 and 25 wt% SnO2/GL-C3N4 is 3.51 m2 g−1, 71.08 m2 g−1, 90.37 m2 g−1, 124.12 m2 g−1, respectively. The BET specific surface area of GL-C3N4 is much larger than that of g-C3N4, suggesting that the layered stacking g-C3N4 was exfoliated into 2D GL-C3N4 nanosheets.15,42 SnO2 has the large BET specific surface area, which could arise from its smaller lamellar structure. And automatically, the BET specific surface area of 25 wt% SnO2/GL-C3N4 composite is much larger than that of pure GL-C3N4 and SnO2, indicating the formation of 2D/2D structures which could effectively facilitate separation/transfer of photoinduced electron–hole pairs, and thus improve the catalytic performance.Optical absorption property is an important parameter for the photocatalyst. UV-vis absorption spectra of SnO2, GL-C3N4 and SnO2/GL-C3N4 composites are shown in Fig. 5(a). It was clearly that the optical absorption edges of SnO2 and GL-C3N4 were located approximately at 506 and 460 nm, respectively, which was estimated from ones absorption onset. The basal absorption edges of the SnO2/GL-C3N4 composites were as similar with GL-C3N4, indicating that both Sn and O were not doped in the GL-C3N4 structure. Compared to the SnO2 semicrystals,43 SnO2 nanoparticles,44 SnO2 nanotubes,45 and other SnO2 samples with the absorption edge of 305–355 nm originated from its wide band gap in previous work, the as-synthesized SnO2 nanosheets in this paper showed strong visible light absorption. This result revealed that the as-prepared SnO2 nanosheets had a narrow band gap and could be excited by visible light. DRS spectra are related to many factors, such as the molecular structure, color, grain size, the degree of dry of the catalyst, particularly evident influence of the color.46 The absorption intensity in visible light region was enhanced with the increasing SnO2 content in the SnO2/GL-C3N4 composites which could be due to the brown color of the SnO2. The optical absorption data and SEM/TEM results worked together implying that SnO2 nanosheets were uniformly recombined with GL-C3N4 in this work.
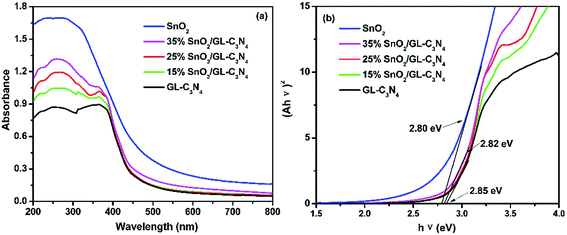 | ||
| Fig. 5 (a) UV-vis diffuses reflectance spectra of the samples; (b) estimated band gap of SnO2, GL-C3N4 and SnO2/GL-C3N4 composites. | ||
The energy level and band gap of the semiconductors play crucial roles in determining these physical properties.18 The band gap energies (Eg) of SnO2, GL-C3N4 and SnO2/GL-C3N4 composites can be estimated respectively according to the following formula eqn (2).
| (Ahv)2 = hv − Eg | (2) |
3.5. PL analysis
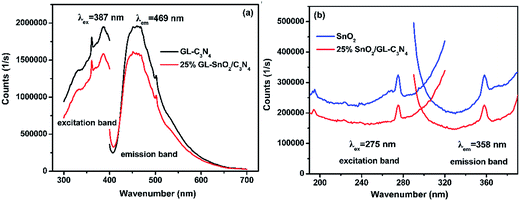
The PL spectra of GL-C3N4, 25 wt% SnO2/GL-C3N4 in Fig. 6(a) were obtained by monitoring with an excitation wavelength of 387 nm; and SnO2, 25 wt% SnO2/GL-C3N4 in Fig. 6(b) were obtained by monitoring with an excitation wavelength of 275 nm. As shown in Fig. 6(a), the GL-C3N4 and 25 wt% SnO2/GL-C3N4 composite presented strong PL emission at 469 nm which was corresponded to the band gap for the recombination of photogenerated electron–hole pairs.34 Clearly, an apparent fluorescence quenching was observed for 25 wt% SnO2/GL-C3N4 compared with pure GL-C3N4, indicating the suppressed recombination among photogenerated charge carriers in this photocatalyst.49 SnO2 exhibited higher emission intensity of PL spectra at 358 nm compared with 25 wt% SnO2/GL-C3N4 with an commonly excitation wavelength of 275 nm.50,51 The decreased photoluminescence intensity of 25 wt% SnO2/GL-C3N4 indicating that it had lower recombination rate of photoinduced electron–hole pairs than GL-C3N4 and SnO2, providing evidence of a direct effect in charge recombination between GL-C3N4 and SnO2.3.6. Transient photocurrents and EIS analyses
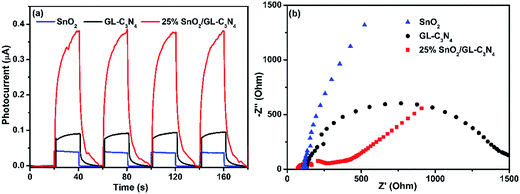
As is well known that, semiconductor with unique band gap structure may have photoelectric properties which could convert can sun light energy into electricity. And the photoelectric conversion efficiency of the SnO2/GL-C3N4 could be analyzed by the photocurrent intensity of the sample. In order to further confirm the composites playing an important role in the photocatalytic reaction, four switch source loop transient photocurrent response experiment of the samples were made. In Fig. 7(a), the 25 wt% SnO2/GL-C3N4 composite showed an obvious enhancement of photocurrent with respect to the bulk sample under visible light irradiation, which was almost 10 and 4 times as high as that of SnO2 and GL-C3N4, respectively, indicating an improvement of charge separation. Photocurrent results confirmed that the composites had a more efficient separation of photogenerated electrons and holes. It was also confirmed that SnO2 and GL-C3N4 administered together effectively at the interface and there were interactions (which playing an important role in the effective separation of electron–hole pairs of GL-C3N4) between SnO2 and GL-C3N4 which was also reflected in the XPS analyses and FT-IR spectra. And 25 wt% SnO2/GL-C3N4 had the highest separation efficiency of the samples, which was in good consistent with the photocatalytic activities. The EIS measurements were conducted to gain deeper insight into the charge transport behavior of SnO2/GL-C3N4 in Fig. 7(b). It has been proved that the radius of every circle in the Nyquist diagram is based on the charge transfer process at the interface of corresponding electrode/electrolyte, and the smallest radius corresponding with a lowest charge-transfer resistance.52 It could be seen from Fig. 7(b) that there was a decline in the radius when introduced SnO2 into the system, indicating that the introduction of SnO2 decreased charge-transfer resistance and raised the interfacial charge transfer. Therefore, the separation of photogenerated electron–holes could be improved by combing SnO2 with GL-C3N4. 25 wt% SnO2/GL-C3N4 showed the smallest radius demonstrating that it had a more effective separation of photoinduced electrons and holes. EIS results were in good consistent with the four switch source loop transient photocurrent response experiment and PL spectra of the composites.3.7. Photocatalytic activity test
From the characterization we mentioned above, we knew that the composites showed enhanced adsorption capability, low recombination rate and high separation efficiency. Those as-prepared composites were supposed to be efficient visible-light driven photocatalysts. The photocatalytic activities of the samples were evaluated from RhB degradation under visible light irritation. As shown in Fig. 8(a), GL-C3N4 and SnO2 showed weak photocatalytic activities towards RhB degradation, of which the photocatalytic degradation efficiencies were 36% and 10%, respectively. While the degradation rate for SnO2/GL-C3N4 composites (15 wt%, 25 wt%, 25 wt% physically blending, 35 wt%) under visible-light irradiation for 3 h were 88%, 92%, 78% and 71%, respectively (Fig. 8(a)). Obviously, an appropriate SnO2 ratio in composite was critical significant for the improvement of the resultant photocatalytic performance. The increased photocatalytic activity of SnO2/GL-C3N4 composites could be attributed to the enhanced separation efficiency of the photoexcited electron–hole pairs. For comparison, a mixture of SnO2 and GL-C3N4 with an appropriate ratio of 25 wt% was also used as one of the photocatalysts. As can be seen from Fig. 8(a), the 25 wt% physically blending of SnO2 and GL-C3N4 showed much lower photocatalytic activity in RhB degradation than that of 25 wt% SnO2/GL-C3N4 composite. The result also indicated that there was an interaction leading to a close interface between the two semiconductors in SnO2/GL-C3N4 composites. And this interaction allowed for the charge transferring between SnO2 and GL-C3N4, thus promoting the separation of photoexcited electron–hole pairs, leading to a high photocatalytic activity of composites. Fig. 8(b) was the absorption spectra of 25 wt% SnO2/GL-C3N4 composite in photodegradation of RhB. Under visible light irradiation for 3 h, the color of solution suspension was changed from red gradually to colorless. Also the absorption peak near 553 nm decreased gradually, which suggested that RhB was oxidation degraded completely.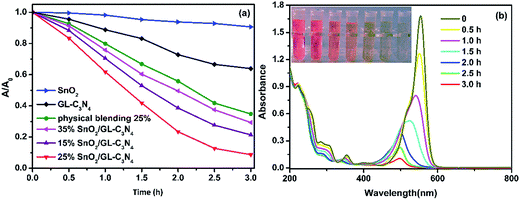 | ||
| Fig. 8 (a) Photocatalytic activities of the samples for the degradation of RhB under visible-light irradiation; (b) absorption spectral changes of RhB under visible light irradiation. | ||
3.8. Cycling test
The stability of the synthesized 25 wt% SnO2/GL-C3N4 composite was studied by a 4-run cycling test. The photocatalytic performance of 25 wt% SnO2/GL-C3N4 composite was investigated by the RhB degradation under visible light irradiation for 3 h. It could be seen from Fig. 9 that the degradation efficiency of RhB over 25 wt% SnO2/GL-C3N4 after 4 recycles was very high. The stability of 25 wt% SnO2/GL-C3N4 composite was also investigated by XRD (Fig. S1†) and FT-IR analyses (Fig. S2†). It could be seen from Fig. S1 and S2,† the recycled 25 wt% SnO2/GL-C3N4 composite named “25 wt% after” had no obvious change in location compared with 25 wt% SnO2/GL-C3N4 composite. These results made it clearly that 25 wt% SnO2/GL-C3N4 remained effective and recyclable for RhB degradation.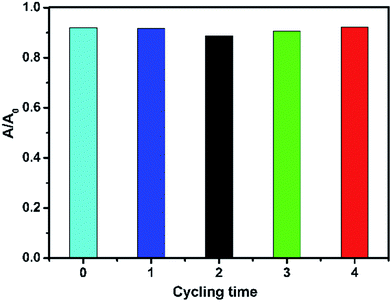 | ||
| Fig. 9 The recycle test for RhB degradation over 25 wt% SnO2/GL-C3N4 under visible-light irradiation. | ||
3.9. ESR, trapping experiments and mechanism of RhB degradation under visible light
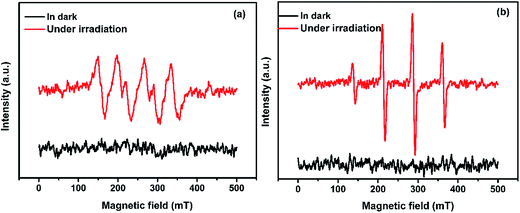
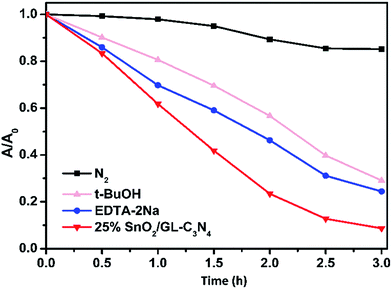
For purpose of investigate the active species produced in the photodegradation process under visible light irradiation, ESR spin-trap technique with DMPO (5,5-dimethyl-1-pyrroline-N-oxide) was used. As everyone knows, H2O2 was formed from photogenerated electron–hole pairs in the reactions with adsorbed water or oxygen, where ˙OH and O2˙− were possibly involved.13 As can be shown in Fig. 10(a), SnO2/GL-C3N4 treated without visible light irradiation exhibited no ESR signal. While under visible light irradiation, signals attributed to a DMPO-O2˙− species were detected successfully in SnO2/GL-C3N4 dispersions in methanolic media, indicating that O2˙− reactive species were generated during the reaction. In addition, ˙OH signals were also detected in visible light irradiation during the reaction (Fig. 10(b)). The results confirmed that both O2˙− and ˙OH were main active species.The trapping experiments were also employed in Fig. 11, as to further study the mechanism. Usually, t-BuOH was employed as the part of hydroxyl radical scavenger, and 2Na-EDTA was used as holes scavenger, while N2 was inlet in order to prevent O2˙− forming.37,53 As shown in Fig. 11, the addition of N2 significantly suppressed the degradation of RhB over 25 wt% SnO2/GL-C3N4 photocatalyst, while t-BuOH and 2Na-EDTA had suppressed the RhB degradation in varying degrees. Those results confirmed that O2˙− was main active specie during RhB photocatalytic degradation process, which was consist with the ESR result. While ˙OH and holes were also contributed part of the role in RhB photocatalytic degradation.
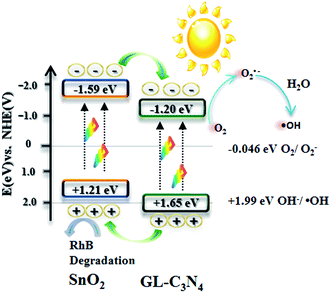
Fig. 12 describes the possible photocatalytic mechanism of RhB degradation over SnO2/GL-C3N4 samples under visible light. The band gaps of SnO2 and GL-C3N4 are 2.80 eV and 2.85 eV, respectively. Since the conduction band (CB) edge potential of SnO2 is estimated as −1.59 eV and valence band (VB) is 1.21 eV. Compared with the common SnO2 with wide band gap, the prepared SnO2 can be excited and produces the photogenerated electron/hole pairs under visible light irradiation due to its narrow band gap. While the CB and VB edge potential of GL-C3N4 are estimated to be −1.20 eV and 1.65 eV.13 From the information mentioned above, it is clearly to know that both the CB and VB edges of GL-C3N4 are more positive than these of SnO2. Therefore, when SnO2/GL-C3N4 is excited under visible light irradiation, the corresponding photo-generated electrons in SnO2 could easily transfer to the CB edge of GL-C3N4, while the corresponding photoinduced holes in GL-C3N4 could be easily accumulated in the VB edge of SnO2. Meanwhile, the photogenerated electrons on the CB edge of GL-C3N4 can be trapped by oxygen molecules in the aqueous solution to form O2˙− reactive oxygen species, which plays an important role in the degradation of RhB. Afterwards, part of the O2˙− reactive oxygen species continue turning into ˙OH radical and play its part in the photodegradation of RhB.54,55 At the same time, the photogenerated holes on the VB edge of SnO2 can directly oxidize RhB. Corresponds to the trapping experiments and ESR results, the photocatalytic mechanism confirmed that O2˙−, ˙OH and holes worked together in combination during the RhB photodegradation process.
4. Conclusion
In summary, the SnO2/GL-C3N4 composites were synthesized in suit by hydrothermal method using GL-C3N4 and SnO2 as precursors. And 25 wt% SnO2/GL-C3N4 composite showed the highest photocatalytic activity, which could degrade about 92% of RhB under visible-light irradiation within 3 h, which was almost 9 and 2.5 times higher than that of SnO2 and GL-C3N4, respectively. The high photodegradation rate of RhB was ascribed to the suitable band potentials of the two components and efficient electron–hole separations via interface of SnO2 and GL-C3N4. Moreover, the trapping experiments and ESR spectra all indicated that O2˙−, ˙OH and holes worked together in combination during the photocatalytic oxidation of RhB.Conflicts of interest
There are no conflicts of interest to declare.Acknowledgements
This current work is financially supported by the National Natural Science Foundation of China (No. 21476097, 21507046), A Project Funded by the Priority Academic Program Development of Jiangsu Higher Education Institutions (PAPD).References
- Y. P. Zhu, T. Z. Ren and Z. Y. Yuan, ACS Appl. Mater. Interfaces, 2015, 7, 16850–16856 CAS.
- Z. W. Zhao, Y. J. Sun and F. Dong, Nanoscale, 2015, 7, 15–37 RSC.
- F. F. Shi, L. L. Chen, C. S. Xing, D. L. Jiang, D. Li and M. Chen, RSC Adv., 2014, 4, 62223–62229 RSC.
- X. C. Hao, X. L. Ji and Q. Zhang, Mater. Lett., 2016, 185, 29–31 CrossRef CAS.
- Y. C. Zhang, Q. Zhang, Q. W. Shi, Z. Y. Cai and Z. J. Yang, Sep. Purif. Technol., 2015, 142, 251–257 CrossRef CAS.
- Y. B. Zhao, M. Shalom and M. Antonietti, Appl. Catal., B, 2017, 207, 311–315 CrossRef CAS.
- X. H. Pang, H. J. Bian, W. J. Wang, C. Liu, M. S. Khan, Q. Wang, J. N. Qi, Q. Wei and B. Du, Biosens. Bioelectron., 2017, 91, 456–464 CrossRef CAS PubMed.
- S. S. Hu, W. J. Ouyang, L. H. Guo, Z. Y. Lin, X. H. Jiang, B. Qiua and G. N. Chen, Biosens. Bioelectron., 2017, 92, 718–723 CrossRef CAS PubMed.
- J. L. Lv, K. Dai, J. F. Zhang, Q. Liu, C. H. Liang and G. P. Zhu, Sep. Purif. Technol., 2017, 178, 6–17 CrossRef CAS.
- A. K. Singh, K. Mathew, H. L. Zhuang and R. G. Hennig, J. Phys. Chem. Lett., 2015, 6, 1087–1098 CrossRef CAS PubMed.
- S. Jeong, D. Yoo, J. T. Jang, M. Kim and J. Cheon, J. Am. Chem. Soc., 2012, 134, 18233–18236 CrossRef CAS PubMed.
- Y. Y. Liu, H. Xiao and W. A. Goddard, J. Am. Chem. Soc., 2016, 138, 15853–15856 CrossRef CAS PubMed.
- J. Yan, Z. G. Chen, H. Y. Ji, Z. Liu, X. Wang, Y. G. Xu, X. J. She, L. Y. Huang, L. Xu, H. Xu and H. M. Li, Chem.–Eur. J., 2016, 22, 4764–4773 CrossRef CAS PubMed.
- X. D. Zhang, X. Xie, H. Wang, J. J. Zhang, B. C. Pan and Y. Xie, J. Am. Chem. Soc., 2013, 135, 18–21 CrossRef CAS PubMed.
- X. P. Dong and F. X. Cheng, J. Mater. Chem. A, 2015, 3, 23642–23652 CAS.
- Q. J. Xiang, J. G. Yu and M. Jaroniec, J. Phys. Chem. C, 2011, 115, 7355–7363 CAS.
- W. N. Xing, C. M. Li, Y. Wang, Z. H. Han, Y. D. Hu, D. H. Chen, Q. Q. Meng and G. Chen, Carbon, 2017, 115, 486–492 CrossRef CAS.
- Z. Y. Zhang, D. L. Jiang, D. Li, M. Q. He and M. Chen, Appl. Catal., B, 2016, 183, 113–123 CrossRef CAS.
- Y. Y. Liu, P. Stradins and S. H. Wei, Sci. Adv., 2016, 2, e1600069 Search PubMed.
- J. H. Feng, Y. Y. Li, M. D. Li, F. Y. Li, J. Han, Y. H. Dong, Z. W. Chen, P. Wang, H. Liu and Q. Wei, Biosens. Bioelectron., 2017, 91, 441–448 CrossRef CAS PubMed.
- L. X. Hu, F. Y. Chen, P. F. Hu, L. P. Zou and X. Hu, J. Mol. Catal. A: Chem., 2016, 411, 203–213 CrossRef CAS.
- H. L. Xia, H. S. Zhuang, T. Zhang and D. C. Xiao, Mater. Lett., 2008, 62, 1126–1128 CrossRef CAS.
- H. L. Xia, H. S. Zhuang, T. Zhang and D. C. Xiao, J. Environ. Sci., 2007, 19, 1141–1145 CrossRef CAS.
- S. H. Hwang, C. Kim and J. Jang, Catal. Commun., 2011, 12, 1037–1041 CrossRef CAS.
- K. Santhi, C. Rani and S. Karuppuchamy, J. Alloys Compd., 2016, 662, 102–107 CrossRef CAS.
- C. Q. Zhu, Y. Li, Q. Su, B. G. Lu, J. Q. Pan, J. W. Zhang, E. Q. Xie and W. Lan, J. Alloys Compd., 2013, 575, 333–338 CrossRef CAS.
- S. S. Bhande, E. K. Kim, D. V. Shinde, S. Patil, R. S. Mane and S. H. Han, Int. J. Electrochem. Sci., 2013, 8, 11596–11605 CAS.
- R. Lamba, A. Umar, S. K. Mehta and S. K. Kansal, Talanta, 2015, 131, 490–498 CrossRef CAS PubMed.
- C. Wang, Y. Zhou, M. Y. Ge, X. B. Xu, Z. L. Zhang and J. Z. Jiang, J. Am. Chem. Soc., 2010, 132, 46–47 CrossRef CAS PubMed.
- T. Tao, L. J. He, J. Li and Y. H. Zhang, Mater. Lett., 2015, 138, 45–47 CrossRef CAS.
- T. T. Li, L. H. Zhao, Y. M. He, J. Cai, M. F. Luo and J. J. Lin, Appl. Catal., B, 2013, 129, 255–263 CrossRef CAS.
- S. C. Yan, Z. S. Li and Z. G. Zou, Langmuir, 2010, 26, 3894–3901 CrossRef CAS PubMed.
- H. Xu, J. Yan, Y. G. Xu, Y. H. Song, H. M. Li, J. X. Xia, C. J. Huang and H. L. Wan, Appl. Catal., B, 2013, 129, 182–193 CrossRef CAS.
- H. Zhao, Y. M. Dong, P. P. Jiang, H. Y. Miao, G. L. Wang and J. J. Zhang, J. Mater. Chem. A, 2015, 3, 7375–7381 CAS.
- H. D. Liu, J. Mater. Sci.: Mater. Electron., 2014, 25, 3353–3357 CrossRef CAS.
- A. Akhundi and A. Habibi-Yangjeh, Mater. Express, 2015, 5, 309–318 CrossRef CAS.
- H. T. Ren, S. Y. Jia, Y. Wu, S. H. Wu, T. H. Zhang and X. Han, Ind. Eng. Chem. Res., 2014, 53, 17645–17653 CrossRef CAS.
- L. Q. Yea, J. Y. Liu, Z. Jiang, T. Y. Peng and L. Zan, Appl. Catal., B, 2013, 142, 1–7 Search PubMed.
- Y. P. Zang, L. P. Li, X. G. Li, R. Lin and G. S. Li, Chem. Eng. J. (Amsterdam, Neth.), 2014, 246, 277–286 CAS.
- T. J. Jiang, Z. Guo, J. H. Liu and X. J. Huang, Electrochim. Acta, 2016, 191, 142–148 CrossRef CAS.
- Y. B. Li, H. M. Zhang, P. Liu, D. Wang, Y. Li and H. J. Zhao, Small, 2013, 9, 3336–3344 CAS.
- X. J. She, H. Xu, Y. G. Xu, J. Yan, J. X. Xia, L. Xu, Y. H. Song, Y. Jiang, Q. Zhang and H. M. Li, J. Mater. Chem. A, 2014, 2, 2563–2570 CAS.
- L. R. Zheng, Y. H. Zheng, C. Q. Chen, Y. Y. Zhan, X. Y. Lin, Q. Zheng, K. M. Wei and J. F. Zhu, Inorg. Chem., 2009, 48, 1819–1825 CrossRef CAS PubMed.
- T. Uddin Md, Y. Nicolas, C. Olivier, T. Toupance, L. Servant, M. M. Müller, H.-J. Kleebe, J. Ziegler and W. Jaegermann, Inorg. Chem., 2012, 51, 7764–7773 CrossRef PubMed.
- C. Q. Zhu, Y. R. Li, Q. Su, B. G. Lu, J. Q. Pan, J. W. Zhang, E. Q. Xie and W. Lan, J. Alloys Compd., 2013, 575, 333–338 CrossRef CAS.
- H. Y. Ji, X. C. Jing, Y. G. Xu, J. Yan, H. P. Li, Y. P. Li, L. Y. Huang, Q. Zhang, H. Xu and H. M. Li, RSC Adv., 2015, 5, 57960–57967 RSC.
- M. T. Niu, F. Huang, L. F. Cui, P. Huang, Y. L. Yu and Y. S. Wang, ACS Nano, 2010, 681–688 CrossRef CAS PubMed.
- C. Wang, J. C. Zhao, X. M. Wang, B. X. Mai, G. Y. Sheng, P. A. Peng and J. M. Fu, Appl. Catal., B, 2002, 39, 269–279 CrossRef CAS.
- Y. J. Zhou, L. X. Zhang, W. M. Huang, Q. L. Kong, X. Q. Fan, M. Wang and J. L. Shi, Carbon, 2016, 99, 111–117 CrossRef CAS.
- Zulfiqar, R. Khan, Y. L. Yuan, Z. Iqbal, J. Yang, W. C. Wang, Z. Z. Ye and J. G. Lu, J. Mater. Sci.: Mater. Electron., 2017, 28, 4625–4636 CrossRef CAS.
- H. Shen, X. R. Zhao, L. B. Duan, R. D. Liu, H. J. Wu, T. Hou, X. W. Jiang and H. D. Gao, Appl. Surf. Sci., 2017, 391, 627–634 CrossRef CAS.
- I. Shakir, M. Shahid and D. J. Kang, Chem. Eng. J. (Amsterdam, Neth.), 2013, 225, 650–655 CAS.
- H. Xu, H. Z. Zhao, Y. G. Xu, Z. G. Chen, L. Y. Huang, Y. P. Li, Y. H. Song, Q. Zhang and H. M. Li, Ceram. Int., 2016, 42, 1392–1398 CrossRef CAS.
- B. Yuan, J. X. Wei, T. J. Hu, H. B. Yao, Z. H. Jiang, Z. W. Fang and Z. Y. Chu, Chin. J. Catal., 2015, 36, 1009–1016 CrossRef CAS.
- Q. Li, N. Zhang, Y. Yang, G. Z. Wang and D. H. L. Ng, Langmuir, 2014, 30, 8965–8972 CrossRef CAS PubMed.
Footnote |
| † Electronic supplementary information (ESI) available. See DOI: 10.1039/c7ra05830f |
| This journal is © The Royal Society of Chemistry 2017 |

