 Open Access Article
Direct comparison between chemisorption and physisorption: a study of poly(ethylene glycol) by means of single-molecule force spectroscopy†
Bo Zhanga,
Rui Shi b,
Weili Duana,
Zhonglong Luoa,
Zhong-yuan Lu
 b and
Shuxun Cui
 *a
*a
aKey Lab of Advanced Technologies of Materials, Ministry of Education of China, Southwest Jiaotong University, Chengdu 610031, China. E-mail: cuishuxun@swjtu.edu.cn
bState Key Laboratory of Supramolecular Structure and Materials, Institute of Theoretical Chemistry, Jilin University, Changchun 130023, China
First published on 5th July 2017
Abstract
Sample preparation is crucial to the studies of polymers on surfaces and interfaces. For studies using single-molecule force spectroscopy (SMFS), sample preparation is the key to obtain high-quality data. In each of the previous SMFS studies, either physisorption or chemisorption was applied in the sample preparation. However, a direct comparison on the same polymer species with both of the two strategies has not been reported yet. With two methods (physisorption, “PS”, or chemisorption, “CS”) and two surfaces (AFM tip or quartz substrate), four types of samples of poly(ethylene glycol) (PEG) can be prepared from the polymer solution. The performance of these samples with the same species of PEG are directly compared by SMFS. It is found that among these samples, two of them, i.e., tip-CS and substrate-PS, are suitable for SMFS. The advantage of substrate-PS is the simple preparation. In contrast, the advantage of tip-CS is the higher rupture force and the lower sample consumption. The former feature will be time saving if a high rupture force is needed in the analysis. The latter feature will be economic when an expensive sample is used. The other two types of samples, i.e., tip-PS and substrate-CS show lower data yield and lower rupture force. In summary, the tip-CS and substrate-PS are recommended for sample preparation in SMFS. The tip-CS is the most promising protocol, if a functionalized polymer sample is available.
1. Introduction
Sample preparation is crucial to the studies of polymers on surfaces and interfaces.1,2 For studies by single-molecule force spectroscopy (SMFS),3–8 sample preparation is the key to obtain high-quality data. In general, there are two strategies for sample preparation, i.e., physisorption and chemisorption. Although physisorption from solution is easy to perform, this method often suffers from the entanglement of polymer chains and surface concentration enrichment.9–12 The results from multiple chains have to be filtered out (often manually) before further data analysis. Therefore, the yield of single-chain data of physisorption is often dissatisfying.Chemisorption can be applied on surfaces of either the AFM tip or the solid substrate.13–15 Several protocols, such as thiol–gold chemistry and biotin–avidin recognition, have been developed to strongly tether a polymer chain to a surface under mild conditions.16–18 Chemisorption requires specific chemical bond to be formed and so is inherently specific to a certain surface/molecule system, whereas physisorption is generic and all kinds molecules roughly produce similar physisorbed results.
In each of the previous SMFS studies, either physisorption or chemisorption was applied in the sample preparation.19–24 However, a direct comparison on the same polymer species with both of the two strategies has not been reported yet. Here, we select poly(ethylene glycol) (PEG) as the model polymer to perform the direct comparison under similar conditions.25–27 Experimental results show that both of two methods have their own advantages. The results indicate that the chemisorption method is superior to physisorption on the aspects of rupture force and the concentration of the sample solution. The advantage of the physisorption method is the facile preparation.
2. Experimental section
2.1 Materials and chemicals
Functionalized PEG (CH2![[double bond, length as m-dash]](https://www.rsc.org/images/entities/char_e001.gif) CH-PEG5K) was purchased from Shanghai Sangon Biotech Ltd. PEG was dissolved in tetrahydrofuran (THF) to a certain concentration. Deionized (DI) water (>15 MΩ cm) was used when water is involved. Other chemicals were analytically pure and used without further treatment.
CH-PEG5K) was purchased from Shanghai Sangon Biotech Ltd. PEG was dissolved in tetrahydrofuran (THF) to a certain concentration. Deionized (DI) water (>15 MΩ cm) was used when water is involved. Other chemicals were analytically pure and used without further treatment.
2.2 Sample preparation
In the sample preparation, we have two methods (physisorption, “PS”, or chemisorption, “CS”) and two surfaces (AFM tip or substrate) for adsorption. Therefore, we have 4 kinds of combinations in total. For clarity, we define the sample with the following code: surface-method. For instance, tip-CS represents the sample of PEG modified AFM tip by chemisorption, and substrate-PS represents the sample of substrate with physisorbed PEG.For the preparation of hydroxyl-group modified quartz substrate, the quartz slide was immersed in a hot piranha solution (98% H2SO4 and 30% H2O2, 7/3, v/v) for 30 min. After that, the substrate is thoroughly rinsed with abundant DI water, followed by drying with air flow.
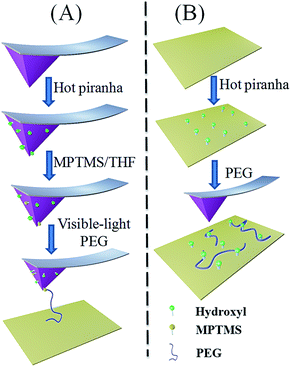 | ||
| Scheme 1 The chemisorption procedure (A) with three steps and the physisorption procedure (B) with two steps. | ||
Preparation of thiol-group modified surface. AFM tip was treated with 3-mercapto-propyltrimethoxysilane (MPTMS, 95%) to provide reactive groups (–SH) on the surface. MPTMS (20 μl), the silane coupling agent, was dissolved in CH2Cl2 (10 ml) firstly. The resulting mixture was stirred for 5 min under a nitrogen atmosphere. Then AFM tip was immersed in the solution for about 1 hour. Finally, the modified AFM tip was rinsed with CH2Cl2 and absolute alcohol twice, respectively, and then dried in vacuum. The thiol-group modified quartz substrate is prepared similarly.
Modification of PEG on surfaces. The PEG chains were grafted to the AFM tip via thiol–ene click chemistry.28–30 The modified AFM tips were immersed into a THF solution of PEG (∼15 μl, Fig. S1†) in the presence of alcohol soluble Eosin Y (∼0.01 mM). Subsequently, with the visible light irradiation (250 W tungsten–halide lamp, Osram HLX 64655) for 5 min, PEG was covalently attached to AFM tip (Scheme 1 and Fig. S1†).31 Finally, the modified tip was washed three times by THF solution to remove the physisorbed polymers and immediately used for SMFS experiments. The substrate-CS is prepared similarly.
2.3 Force measurements
The force measurements were carried out on a commercial AFM (Nanowizard II, JPK Instruments, Germany). The spring constant of each AFM cantilever was calibrated with the thermo-excitation method, which was around 40 pN nm−1. Instrumentation details of the AFM-based SMFS have been described elsewhere.3,4,32 Briefly, with the movement of piezo, the data were recorded at the same time and converted to force–extension curves (in brief, F–E curves) subsequently. In the SMFS experiments, nonane was used as the liquid environment. The stretching velocity was 2.0 μm s−1, unless mentioned otherwise.3. Results and discussion
3.1 SMFS results from samples by chemisorption
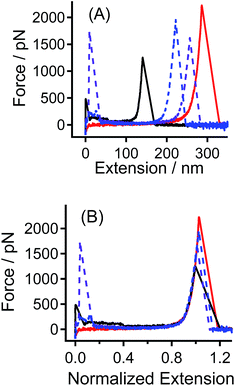
The tip-CS sample and the hydroxyl-group modified quartz substrate are used as a pair of sample in the SMFS experiments. Typical F–E curves obtained in this case are shown in Fig. 1A. Due to the polydispersity of PEG molecule and the random position where the tip picks, the apparent contour lengths of PEG are different. In order to compare the data with different apparent contour lengths, the F–E curves are normalized by the corresponding extension at a given force (e.g., 600 pN) to the same extension. The normalized F–E curves can be superposed well with each other (Fig. 1B), suggesting that each of the F–E curves originates from the elongation of an individual PEG chain.11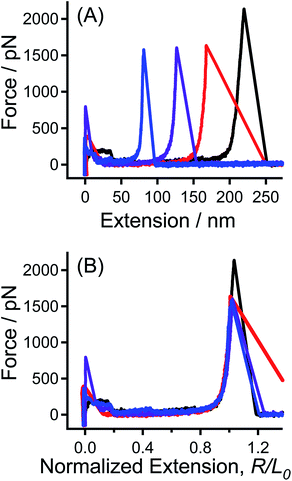 | ||
| Fig. 1 (A) Typical F–E curves of PEG sample of tip-CS obtained in nonane, and (B) the normalized F–E curves of those shown in (A). | ||
According to previous work in our group, we can use the QM-FRC model to quantitatively describe the single-chain elasticity of PEG obtained in nonane.11,27,33 In the QM-FRC model (see ESI† for details), the theoretical single-chain elasticity of PEG by ab initio quantum mechanical (QM) calculations is integrated into the freely rotating chain (FRC) model:34,35
| R/L0 = (L[F]/L0) × [1 − (kBT)/(2Flb)] | (1) |
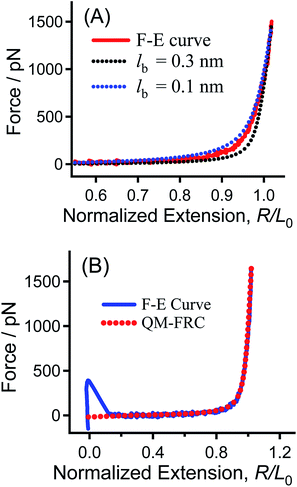
During the elongation of PEG, L[F]/L0 is an ergodic value ranging from 1 to a number corresponding to the rupture of the polymer bridge. If the strength of a C–S bond (2800 pN, see Fig. S4 in ESI†) is set as the upper limit of the stretching force,17 the upper limit for L[F]/L0 is about 1.159, according to eqn (1). For a given value of lb, the fitting curve can be obtained when the value of L[F]/L0 is changed from 1 to 1.159.
As shown in Fig. 2A, the experimental F–E curve lies between the two fitting curves, indicating that the lb value for PEG is in the range of 0.1–0.3 nm. An analysis is carried out to find the optimum value for lb. The averaged deviation force, namely  , where n is the number of points in the compared range, is plotted against lb in Fig. S5.†33 The minimum force deviation is found at lb = 0.147 ± 0.001 nm, where the value of the averaged difference (19.1 pN) is very close to the standard deviation of the noise signal in the force measurements (15.4 pN). As shown in Fig. 2B, the entire region of the experimental F–E curve can be fitted well by the QM-FRC model with lb = 0.147 nm.11,33
Interestingly, the fitting result (0.147 nm) corresponds to the average bond length of the C–O–C– backbone of PEG, showing that the QM-FRC model is a structure-relevant model. The excellent fitting result in the entire force regime indicates that the QM calculations reflect the inherent single-chain elasticity of PEG, and the QM-FRC model is appropriate for PEG. These results indicate that chemisorption could be used to measure the inherent elasticity of a single PEG chain.
Previous studies showed that QM-FJC model, which was derived from the freely-jointed chain model, can also be used to describe the single-chain elasticity of polymers.36,37 Here in this study, we find that the single-chain elasticity of PEG can be described well by QM-FJC model, when lk = 0.294 nm (Fig. S6†). In the low force region (F < 40 pN), however, there is a remarkable difference between the fitting curves of QM-FJC model and QM-FRC model. These results are in accord with the previous finding that these two models are equivalent if lk = 2lb, when the stretching force is high enough.37 In fact, we find that when F > 40 pN (the noise level is ∼10 pN), the two fitting curves of PEG can be superposed well, see Fig. S6† for details.
Next, the factors that may influence the chemisorption were studied. When visible light or catalyst (Eosin Y) was absent in the sample preparation, respectively, no effective force signal of polymer could be obtained in the extensive force measurements (∼3000 times approaching–stretching cycles, see Fig. S7†). These control experiments demonstrate that both visible light and the catalyst are necessary in the chemisorption.31 We have also performed similar force measurements with different stretching velocity (0.5–5 μm s−1), and observed no velocity dependence, see Fig. S8.† This result indicates that the force measurements are carried out in the quasi-equilibrium condition.11,27
In addition, the force measurements have been carried out in PBS aqueous buffer. In this case, the F–E curve of PEG present a fingerprint plateau (see Fig. S9† for details), which is in accordance with the literature.25
3.2 SMFS results from samples by physisorption
For physisorption, a hydroxyl-group modified tip is exploited to capture and stretch the chain on the PEG sample of substrate-PS. Fig. 3 shows typical F–E curves of single PEG chain obtained in nonane from the sample of substrate-PS and tip-CS, respectively. After normalization, these F–E curves could be superposed well, which illustrate that both of these two sample preparation methods can be used to measure the single-chain mechanics of PEG.3.3 Direct comparison of chemisorption and physisorption
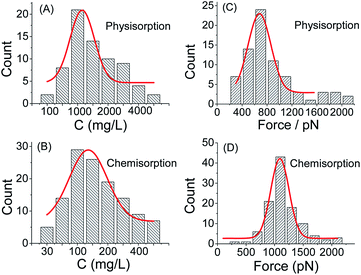
Subsequently, the optimum concentrations of PEG solution are studied for both chemisorption and physisorption method, respectively (see Fig. 4 and S10†). For each concentration, 10![[thin space (1/6-em)]](https://www.rsc.org/images/entities/char_2009.gif) 000 F–E curves are collected for statistical analysis. The optimum concentration is defined as the concentration that corresponds to the maximum probability of single-chain event (i.e., the peak of the Gaussian fitting curve in Fig. 4A and B). For chemisorption, the optimum concentration is 131 ± 4 mg L−1, which is much lower than that for physisorption, 1249 ± 30 mg L−1. For both of the two sample preparation methods, the probability of the single-chain stretching event will be increased with the increasing of the PEG solution concentration, until a maximum is reached. Henceforth, the probability will be decreased if the PEG concentration is increased further. The possible reason could be that when the concentration of the solution is too high, the resultant concentration of the polymer chains on the sample surface will be increased so that the AFM tip would capture multiple-chains at the same time, which will lower the yield of the single-chain data (see Fig. S11†). Note that for the case of tip-CS, both of the solution volume and the concentration of the solution is reduced. In a typical case, the chemisorption method will save about 97% raw materials during sample preparation (see Fig. S1† for details). Thus, the chemisorption method is more efficient than the physisorption method. This advantage will be very valuable if the sample polymer (for instance, a synthetic peptide) is expensive.38
000 F–E curves are collected for statistical analysis. The optimum concentration is defined as the concentration that corresponds to the maximum probability of single-chain event (i.e., the peak of the Gaussian fitting curve in Fig. 4A and B). For chemisorption, the optimum concentration is 131 ± 4 mg L−1, which is much lower than that for physisorption, 1249 ± 30 mg L−1. For both of the two sample preparation methods, the probability of the single-chain stretching event will be increased with the increasing of the PEG solution concentration, until a maximum is reached. Henceforth, the probability will be decreased if the PEG concentration is increased further. The possible reason could be that when the concentration of the solution is too high, the resultant concentration of the polymer chains on the sample surface will be increased so that the AFM tip would capture multiple-chains at the same time, which will lower the yield of the single-chain data (see Fig. S11†). Note that for the case of tip-CS, both of the solution volume and the concentration of the solution is reduced. In a typical case, the chemisorption method will save about 97% raw materials during sample preparation (see Fig. S1† for details). Thus, the chemisorption method is more efficient than the physisorption method. This advantage will be very valuable if the sample polymer (for instance, a synthetic peptide) is expensive.38
Furthermore, the statistical analysis shows that the rupture force (i.e., the peak force value at the end of polymer stretching) for tip-CS is 1092 pN (σ = 160 pN), which is higher than that for substrate-PS, 675 pN (σ = 140 pN), see Fig. 4. The enhanced rupture force for tip-CS is reasonable since one end of PEG is covalently tethered to the AFM tip, while for physisorption, neither ends are covalently tethered. Since the polymer bridge will be broken at the weakest point, the rupture forces correspond the desorption forces of the physisorbed end from the solid surface. Thus, the difference of the rupture forces between the CS sample and PS sample is not very large. For the case of substrate-PS, it is still possible (∼10% in the effective F–E curves) to obtain a high rupture force (1500–2100 pN), see Fig. 4C. The plausible reason is that the AFM tip is very sharp (tip radius of 10–20 nm), which will lead to a very high pressure (∼10 GPa) upon contact to the substrate (indentation force of ∼5 nN). With this high pressure, strong physisorption or even covalent bonds might be formed between the polymer chain and tip/substrate.34
In general, a relatively high force is needed to reflect more information of the sample molecules. For example, to observe the force induced ring-opening reaction in the gem-dibromocyclopropane-functionalized polybutadiene chain, the applied force should be higher than 1200 pN.39 It is clear that covalent bonds are stronger than the non-covalent ones at the single-molecule level. Thus, chemisorption would be a better choice when a high rupture force is required in the SMFS experiments. The advantage of physisorption is the simple preparation. If a large number of single-molecule pulling cycle can be carried out, the high rupture force can also be observed. In contrast, the chemisorption method is time saving in the force measurements.
For the sample of substrate-PS, the measured rupture force reflects the desorption force from either the AFM tip or the substrate. Note that in this case, both the AFM tip and the substrate are modified with hydroxyl groups. For the sample of tip-CS, one end of the PEG chain is covalently tethered to the AFM tip. The rest part of the chain is free for physisorption to the substrate upon contact. The desorption signal detected upon pulling reflects the desorption force of the physisorbed part from the hydroxyl-group modified substrate. The above section shows that the rupture force for the sample of tip-CS is much higher than that of the sample of substrate-PS. A plausible reason for this result could be that for the substrate-PS sample, the desorption force of PEG from the substrate is stronger than that from the AFM tip, though both of the surfaces are modified with hydroxyl groups. This is in good agreement with our experience in SMFS: after a series of pulling cycles (∼1000 times) on the substrate with physisorbed polymer, the AFM tip is often clean enough for further experiments on the same sample. Monte Carlo (MC) simulations also shows that this assumption is reasonable, see Section 3.4 for details.7
As what has been mentioned in the section of Sample preparation, we have 4 kinds of samples in total. In addition to the two kinds of samples that have been discussed above, we also evaluate the performance of the other two kinds of samples, i.e., the tip-PS sample and substrate-CS sample (Scheme S1, Fig. S12†).
For the tip-PS sample, a very low yield (∼1/800) of the effective F–E curve is observed. The rupture forces of these F–E curves mainly located around 450 pN (Fig. S13†), which is lower than that observed on the sample of substrate-PS (675 pN) and tip-CS (1092 pN). The lower rupture force and yield of data is rationalized as follows. For the sample of tip-PS, any part of the PEG chain could adsorb on the AFM tip surface by physisorption. Compared to the height of the AFM tip (∼6 μm), the length of the PEG chain (<300 nm) is much shorter. Thus, the PEG chain will have a very low possibility to extend out of the AFM tip (Scheme S1B†), which will result in a very low yield of data. Even if the polymer bridge is built between tip and substrate, there will be few anchor points on the substrate, which will lead to a low rupture force.
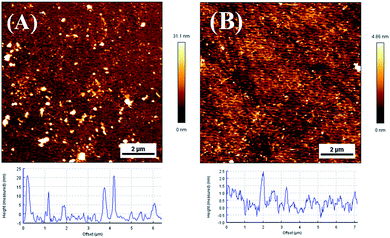
For the sample of substrate-CS, the most probable rupture force is 512 pN (σ = 69 pN), which is lower than that observed on the sample of tip-CS, see Fig. S14.† The yield of data (∼1/360) is also lower than that of the sample of tip-CS. The following factors may contribute to the lower data yield and rupture force. Since a very low concentration of the PEG solution is used, the surface concentration of PEG chains will be very low. AFM images that the typical surface coverage is about 0.9% for the substrate-CS sample, which is much lower than that for the substrate-PS sample (∼9.1%), see Fig. 5. It is expected that the distance between two spots (PEG chains) is much larger than the tip radius (10–20 nm), see Fig. 5B. Therefore, it is not easy to capture a PEG chain on the substrate in a short time (i.e., several pulling cycles). Even if a PEG chain is captured by the tip, it is likely that only a very short part of the chain is available for physisorption on the tip (due to the tiny size of the tip and short chain length of PEG). Thus, there will be few anchor points of PEG adsorbed on the tip during contact, which leads to a low rupture force upon pulling.
3.4 Monte Carlo (MC) simulations
In the MC simulations, we assume all desorption force distributions are Gaussian for convenience.![[thin space (1/6-em)]](https://www.rsc.org/images/entities/char_2009.gif) 000 times. The random number X1 represents the desorption force of the physisorbed PEG chain from the substrate. The histogram shows that the random number X1 follows a very similar distribution to that of the force measurements, see Fig. S15.†
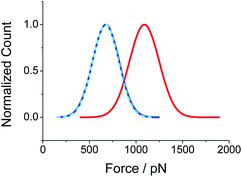
000 times. The random number X1 represents the desorption force of the physisorbed PEG chain from the substrate. The histogram shows that the random number X1 follows a very similar distribution to that of the force measurements, see Fig. S15.†![[thin space (1/6-em)]](https://www.rsc.org/images/entities/char_2009.gif) 000 times. Each time we select the smaller number in X1 and X2 as the rupture force in that single pulling event, since the polymer bridge always breaks at the weakest point of the chain. The histogram shows the most probable rupture force value of 1006 pN, which is much higher than that obtained in the experiments (675 pN), see Fig. S16 and S17.† This marked discrepancy implies that the previous assumption is not reasonable. That is to say, the two distributions of the desorption forces of PEG, one from AFM tip and the other from the substrate, should be different.
000 times. Each time we select the smaller number in X1 and X2 as the rupture force in that single pulling event, since the polymer bridge always breaks at the weakest point of the chain. The histogram shows the most probable rupture force value of 1006 pN, which is much higher than that obtained in the experiments (675 pN), see Fig. S16 and S17.† This marked discrepancy implies that the previous assumption is not reasonable. That is to say, the two distributions of the desorption forces of PEG, one from AFM tip and the other from the substrate, should be different.Then we try to generate random number X1 and X2 from two different Gaussian distributions, respectively, the first one with μ = 1092 pN and σ = 160 pN (represents the desorption force from substrate) and the second one with a smaller μ and similar σ value (represents the desorption force from AFM tip). After trial and error, we find that when a Gaussian distribution of μ = 675 pN and σ = 140 pN is used to represent the desorption force from AFM tip, the final result of the simulations agrees well with the results in the experiments, see Fig. 6. Note that the second distribution used in the MC simulations (μ = 675 pN and σ = 140 pN) is exactly the same to that of the experimental desorption force for the sample of physisorption. This result clearly shows that in the experiments, the desorption force from AFM tip (μ = 675 pN) is much lower than that from the substrate (μ = 1092 pN). This explains well why the desorption force for the sample of physisorption is much lower than that for the sample of chemisorption. On the other hand, this result predicts that a polymer chain prefers to stay on the substrate, when the surface components of the AFM tip and substrate are similar. This is in good agreement with our experience in SMFS: after a series of pulling cycles (∼1000 times) on the substrate with physisorbed polymer, the AFM tip is often clean enough for further experiments on the same sample.11,36
Note that in the case of physisorption, both the AFM tip and the substrate are modified with hydroxyl groups. The lower desorption force from the tip implies that other factors rather than the surface components influence the desorption force. The following factors may contribute to the lower desorption forces: the size and shape of the AFM tip are largely different from that of the flat substrate. In this case, the PEG chain may have less anchor points on the AFM tip, which lead to a lower binding force.
4. Conclusions
With two methods (physisorption or chemisorption) and two surfaces (AFM tip or quartz substrate), four types of samples can be prepared from the polymer solution. The performance of these samples with the same species of PEG are directly compared by SMFS. It is found that among these samples, two of them, i.e., tip-CS and substrate-PS, are suitable for SMFS. The advantage of substrate-PS is the simple preparation. In contrast, the advantage of tip-CS is the higher rupture force and the lower sample consumption. The former feature will be time saving if a high rupture force is needed in the analysis. The latter feature will be economic when an expensive sample is used. Monte Carlo simulations show that in the case of substrate-PS, the polymer chain tends to detach from the AFM tip, possibly due to the fewer anchor points. The other two types of samples, i.e., tip-PS and substrate-CS show lower data yield and lower rupture force. In summary, the tip-CS and substrate-PS are recommended for sample preparation in SMFS. The tip-CS is the most promising protocol, if a functionalized polymer sample is available. Many kinds of end-functionalized polymers (especially PEG and DNA) are commercially available at present. It is expected that more and more kinds of end-functionalized polymers can be supplied in the future. Therefore, it is anticipated that the chemisorption route (with the click chemistry and other reactions) can be used in more and more systems.Acknowledgements
This work was supported by Natural Science Foundation of China (21574106 and 21534004) and Sichuan Youth Science & Technology Foundation (2017JQ0009).References
- K. Liu, Y. Song, W. Feng, N. N. Liu, W. K. Zhang and X. Zhang, J. Am. Chem. Soc., 2011, 133, 3226–3229 CrossRef CAS PubMed.
- Z. Zheng, F. Kuang and J. Zhao, Macromolecules, 2010, 43, 3165–3168 CrossRef CAS.
- M. Rief, M. Gautel, F. Oesterhelt, J. M. Fernandez and H. E. Gaub, Science, 1997, 276, 1109–1112 CrossRef CAS PubMed.
- P. E. Marszalek, A. F. Oberhauser, Y. P. Pang and J. M. Fernandez, Nature, 1998, 396, 661–664 CrossRef CAS PubMed.
- C. Liu, Z. Jiang, Y. Zhang, Z. Wang, X. Zhang, F. Feng and S. Wang, Langmuir, 2007, 23, 9140–9142 CrossRef CAS PubMed.
- P. Lussis, T. Svaldo-Lanero, A. Bertocco, C.-A. Fustin, D. A. Leigh and A.-S. Duwez, Nat. Nanotechnol., 2011, 6, 553–557 CrossRef CAS PubMed.
- S. Morris, S. Hanna and M. J. Miles, Nanotechnology, 2004, 15, 1296–1301 CrossRef CAS.
- M. L. Hughes and L. Dougan, Rep. Prog. Phys., 2016, 79, 076601 CrossRef PubMed.
- S. X. Cui, C. J. Liu and X. Zhang, Nano Lett., 2003, 3, 245–248 CrossRef CAS.
- Z. Luo, B. Cheng and S. Cui, Langmuir, 2015, 31, 6107–6113 CrossRef CAS PubMed.
- Z. L. Luo, B. Zhang, H. J. Qian, Z. Y. Lu and S. X. Cui, Nanoscale, 2016, 8, 17820–17827 RSC.
- X. Pang, B. Cheng and S. Cui, Chin. J. Polym. Sci., 2016, 34, 578–584 CrossRef CAS.
- Y. Nakahara, H. Mitani, S. Kado and K. Kimura, RSC Adv., 2014, 4, 57850–57854 RSC.
- Q. Li, T. Zhang, Y. Pan, L. C. Ciacchi, B. Xu and G. Wei, RSC Adv., 2016, 6, 12893–12912 RSC.
- S. JooáKim, J. HyunáSeo, J. WooáLee and H. JoonáCha, RSC Adv., 2015, 5, 105727–105730 RSC.
- E. Florin, V. T. Moy and H. E. Gaub, Science, 1994, 264, 415–417 CAS.
- M. Grandbois, M. Beyer, M. Rief, H. Clausen and H. E. Gaub, Science, 1999, 283, 1727–1730 CrossRef CAS PubMed.
- P. Hinterdorfer, F. Kienberger, A. Raab, H. J. Gruber, W. Baumgartner, G. Kada, C. Riener, S. Wielert-Badt, C. Borken and H. Schindler, Single Mol., 2000, 2, 99–103 CrossRef.
- A. Janshoff, M. Neitzert, Y. Oberdörfer and H. Fuchs, Angew. Chem., Int. Ed., 2000, 39, 3212–3237 CrossRef CAS PubMed.
- P. Hinterdorfer and Y. F. Dufrêne, Nat. Methods, 2006, 3, 347–355 CrossRef CAS PubMed.
- I. T. Li and G. C. Walker, J. Am. Chem. Soc., 2010, 132, 6530–6540 CrossRef CAS PubMed.
- I. T. Li and G. C. Walker, Proc. Natl. Acad. Sci. U. S. A., 2011, 108, 16527–16532 CrossRef CAS PubMed.
- J. Chung, A. M. Kushner, A. C. Weisman and Z. Guan, Nat. Mater., 2014, 13, 1055–1062 CrossRef CAS PubMed.
- C. Z. He, C. G. Hu, X. D. Hu, X. T. Hu, A. Xiao, T. T. Perkins and H. B. Li, Angew. Chem., Int. Ed., 2015, 54, 9921–9925 CrossRef CAS PubMed.
- F. Oesterhelt, M. Rief and H. Gaub, New J. Phys., 1999, 1, 6 CrossRef.
- S. Cui, Acta Polym. Sin., 2016, 1160–1165 CAS.
- S. X. Cui, C. Albrecht, F. Kühner and H. E. Gaub, J. Am. Chem. Soc., 2006, 128, 6636–6639 CrossRef CAS PubMed.
- C. E. Hoyle and C. N. Bowman, Angew. Chem., Int. Ed., 2010, 49, 1540–1573 CrossRef CAS PubMed.
- W. D. Cook, F. Chen, Q. D. Nghiem, T. F. Scott, C. N. Bowman, S. Chausson and L. Le Pluart, Macromol. Symp., 2010, 291, 50–65 CrossRef.
- H. C. Kolb, M. Finn and K. B. Sharpless, Angew. Chem., Int. Ed., 2001, 40, 2004–2021 CrossRef CAS PubMed.
- X. Kang, Y. Yu, Y. Bao, W. Cai and S. Cui, Polym. Chem., 2015, 6, 4252–4257 RSC.
- D. Zhang and C. Ortiz, Macromolecules, 2004, 37, 4271–4282 CrossRef CAS.
- K. F. Wang, X. C. Pang and S. X. Cui, Langmuir, 2013, 29, 4315–4319 CrossRef CAS PubMed.
- L. Livadaru, R. Netz and H. Kreuzer, Macromolecules, 2003, 36, 3732–3744 CrossRef CAS.
- T. Hugel, M. Rief, M. Seitz, H. E. Gaub and R. R. Netz, Phys. Rev. Lett., 2005, 94, 048301–048304 CrossRef PubMed.
- Y. Bao, H.-J. Qian, Z.-Y. Lu and S. Cui, Nanoscale, 2014, 6, 13421–13424 RSC.
- S. Cui, Y. Yu and Z. Lin, Polymer, 2009, 50, 930–935 CrossRef CAS.
- F. Variola, Phys. Chem. Chem. Phys., 2015, 17, 2950–2959 RSC.
- D. Wu, J. M. Lenhardt, A. L. Black, B. B. Akhremitchev and S. L. Craig, J. Am. Chem. Soc., 2010, 132, 15936–15938 CrossRef CAS PubMed.
Footnote |
| † Electronic supplementary information (ESI) available: QM-FRC model, scheme for the SMFS experiments of physisorption and chemisorption, control experiments, results of various PEG concentrations, Monte Carlo simulations. See DOI: 10.1039/c7ra05779b |
| This journal is © The Royal Society of Chemistry 2017 |

