 Open Access Article
Creative Commons Attribution 3.0 Unported Licence
Enhanced persistent properties of Mn2+ activated CaZnOS†
Yinjian Zhengab,
Haiming Zhanga,
Haoran Zhanga,
Xuejie Zhanga,
Yingliang Liu*a and
Bingfu Lei *ab
*ab
aGuangdong Provincial Engineering Technology Research Center for Optical Agricultural, College of Materials and Energy, South China Agricultural University, Guangzhou 510642, China. E-mail: tleibf@scau.edu.cn
bCollege of Horticulture, South China Agricultural University, Guangzhou 510642, China
First published on 7th August 2017
Abstract
The red emitting CaZnOS:Mn2+ long persistent phosphor was successfully prepared via a conventional high-temperature solid-state reaction method. The persistent luminescence emission of Mn2+-doped CaZnOS phosphor was investigated for the first time. Rare-earth trivalent ions were used as co-dopants to obtain a brighter red afterglow and longer persistence time. The optical properties of the as-prepared samples have been investigated systematically by employing photoluminescence spectroscopy, persistent luminescence spectroscopy, afterglow decay curves and thermoluminescence curves. In light of the experimental results of this study, a possible mechanism of persistent luminescence was illustrated and discussed in detail. These investigations provide a new and efficient long persistent phosphor.
Introduction
The phenomenon of luminescence has fascinated people since the earliest times. Persistent luminescent is a particular luminescence type for which the emission is delayed by minutes, hours or even days after the excitation has stopped.1 The luminescent materials with persistent luminescence properties are put into the context of emerging applications such as in imaging storage, optical memory and in vivo imaging.2,3 Since the efficient persistent phosphor SrAl2O4:Eu2+, Dy3+ has been reported,4 numerous novel persistent materials have been gaining attention among many researchers.5–10 More recently, materials with emission in the deep red or in the near-infrared are desired for surveillance applications and in vivo medical imaging.11 However, many researchers and publications on these persistent luminescent materials have focused on divalent europium as the doping ion. The broadband emission of Eu2+ is strongly dependent on the host material, more exactly, on the centroid shift and the strength of the crystal field acting on the ions.12 This mixture of effects leads to the so-called red shift, and the value depends strongly on the structure of the host compound and the local coordination of the europium dopant ion. It is quite common to obtain a blue or green afterglow using oxide host compounds, but it is much more challenging to find a suitable host solid with appropriate red shift, in order to obtain orange or red persistent luminescence. Moreover, red emitting Eu2+ doped persistent phosphors, such as CaS:Eu13 and (Ca, Sr)2Si5N8:Eu,14,15 the choice is limited and the host lattices are chemically unsteady or hard to prepare. At present, great efforts have been made to develop other doping ions in order to obtain efficient red radiating persistent materials.Calcium zinc oxysulfide (CaZnOS) is an intermediate production recovery of zinc from its sulfide by a carbothermal reduction in the presence of lime. This novel quaternary oxysulfide was first reported.16 Later on, Igiehon and coworkers17,18 tried to explore the products of carbothermal reduction of iron and zinc sulfides and to determine the crystal structures of CaZnOS and CaFeOS. In 2003, Petrova et al. refined the lattice parameters and determined the space group of this zinc calcium oxysulfide using the Rietveld profile analysis method. Subsequently, its synthesis, structure, and electrical properties were investigated in detail.19,20 Recently, the photoluminescence properties of CaZnOS:Mn2+ phosphor were reported.21 Mn2+-activated CaZnOS shows a single symmetric narrow red emission band in the wavelength range of 550–700 nm with the peak centered at 614 nm. Very recently, the multi-stress sensitive elastico-mechanoluminescence characteristics of CaZnOS:Mn2+ phosphor were for the first time discovered.22 It can simultaneously sense and image different mechanical stimuli including ultrasonic vibration, impact, friction, and compression with an intense emission, indicating the practical prospect on stress sensors. Upon reviewing the literature, it is clear that there is no research on the afterglow properties of Mn2+ doped CaZnOS phosphors. Thus, the investigation of the afterglow properties of CaZnOS:Mn2+ is a very interesting work.
In this article, Mn2+ doped CaZnOS phosphors were successfully prepared by solid-state reaction in an argon atmosphere. We report some new and preliminary phenomena of CaZnOS:Mn2+ phosphors. The red long afterglow emission enhancement of CaZnOS:Mn2+ by co-doping Ce3+/Pr3+ into the phosphor is also reported. The photoluminescence (PL), afterglow and thermoluminescence (TL) properties of CaZnOS:Mn2+ and CaZnOS:Mn2+, RE3+ (RE = Ce3+, Pr3+) phosphors were investigated in detail. It was found that the additive Ce3+ ions extended the persistent time much longer. This result is of course an exciting phenomenon in the investigation field of the red afterglow phosphors.
Experimental
Undoped and doped CaZnOS powder samples were prepared by the conventional high-temperature solid-state reaction method. The 4 N pure CaCO3, ZnS, MnCO3, CeF3 and Pr2O3 were employed as the starting materials. Phosphor with molar compositions of Ca0.99Zn0.99OS:0.01Mn2+,0.01RE3+ (RE = Ce3+, Pr3+) were thoroughly mixed and ground in an agate mortar, and subsequently sintered in an alumina crucible at 1273 K for 4 h in a horizontal tube furnace under a flowing argon atmosphere. After sintering, these samples were gradually cooled down to room temperature in the heating system. Finally, the samples crystallization behavior were examined by powder X-ray diffraction (XRD, Bruker D8) with Cu Kα radiation (λ = 1.54056 Å) operated at 36 kV and 30 mA in the 2θ range from 10° to 80° with a step size of 0.02° for a scanning rate of 2° min−1. The microstructure and morphological information of samples were measured using a scanning electron microscope (SEM, XL-30, Phillips) coupled with energy dispersive spectroscopy (EDS). X-ray photoelectron spectroscopy (XPS) measurements were performed by X-ray photoelectron spectrometer (Escalab 250Xi, Thermo Scientific) equipped with an Al Kα line within the 0–1300 eV energy range. The photoluminescence and persistent luminescence spectra of the as-synthesized materials were recorded using a fluorescence spectrometer (F-7000, Hitachi) equipped with a 150 W Xe lamp as the radiation source. Afterglow decay curves were measured by long afterglow phosphor tester after 15 min excitation with an unfiltered Xe arc lamp at 1000 lux (PR-305, Zhejiang Tri-color instrument Co. Ltd., Zhejiang, China). The thermoluminescence (TL) behaviors were investigated by a microcomputer controlled TL dosimeters (FJ427-AL; Beijing Nuclear Instrument Factory, Beijing, China) with a fixed heating ratio 1 K s−1. Before measuring the TL, the samples were pre-irradiated by 365 nm UV light for 10 min. All measurements were carried out at room temperature except for the TL curves.Results and discussion
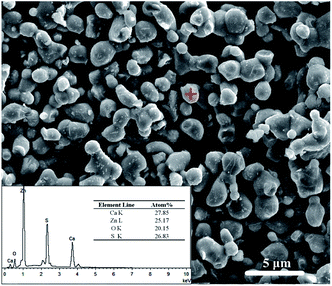
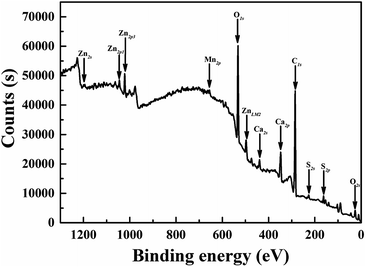
After prepared through solid-state reaction, the samples were ground. The size and shape of the particles are important when constructing of the optical device. The morphology and the size of a typical Mn2+-dope CaZnOS sample were examined by SEM, as shown in Fig. 1. It can be clearly seen that most of the particles are distributed in the crystal size range of 1–3 μm, together with some larger particles up to 5 μm. And the phosphors are composed of small, roughened spherical grains. Composition and quantity of all elements in a spot were analyzed by using Energy Dispersive X-ray Spectrometer (EDS), as shown in the inset of Fig. 1. The EDS spectrum of the CaZnOS:Mn sample revealed that it is composed of Ca, Zn, O and S. However, Mn element was not detected due to its low-concentration doping. The EPR spectra of the samples in the present study were measured and illustrated as Fig. S1.† The well resolved signature of Mn2+ ions observed in the EPR spectra confirms the existence of Mn2+ ions in samples. In order to confirm the constituent elements of the synthesized CaZnOS phosphor, X-ray photoelectron spectroscopy (XPS) measurement was also carried out, as shown in Fig. 2. The XPS spectrum contains Ca, Zn, O, C, S and Mn signal.23 As in the previous EDS testing result, we could not accurately determine the amount of Mn incorporated in the present XPS measurements because of the low sensitivity of the Mn signal.Fig. 3a shows the X-ray powder diffraction patterns of as-prepared samples and the standard ICSD card of CaZnOS for comparison. It is can be seen from Fig. 3a that all the diffraction peaks are in good agreement with the standard data of CaZnOS (ISCD#245309). It indicates that the obtained samples are well crystallized and the incorporation of Mn2+/Ce3+/Pr3+ ions almost has no significant influence on the host lattice. The structure of CaZnOS is investigated in detail by Clarke et al.20 Based on the above article, the oxysulfide compound crystallizes in the hexagonal space group P63mc with a = 3.75726(3) Å, c = 11.4013(1) Å, V = 139.388(2) Å3 and Z = 2. The crystal structure of CaZnOS and the coordination environments of the Ca2+/Zn2+ sites are plotted in Fig. 3b. It can be seen that the structure framework of CaZnOS host lattice is composed of layers of ZnS3O tetrahedral and CaS3O3 octahedral. Obviously, ZnS3O tetrahedra all aligned with Zn–O bond vectors parallel and directed parallel to c axis and linked at all their S-containing vertices, yielding [ZnS3/3O]2− layers. Ca2+ ions occupy distorted octahedral interstices between these [ZnS3/3O]2−.
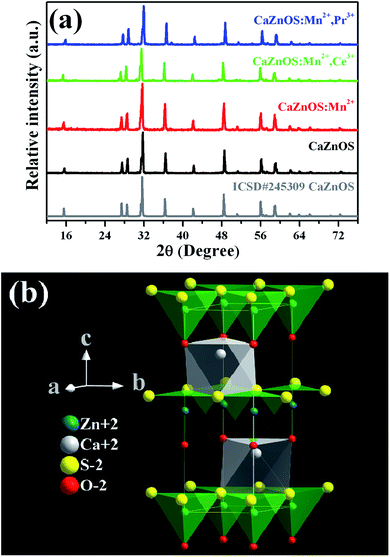 | ||
| Fig. 3 (a) X-ray diffraction patterns of the as-prepared samples and the pattern of ICSD#245309 for CaZnOS; (b) crystal structure of CaZnOS. | ||
To further examine the crystal structure and sites in this compound, Rietveld structure refinements of these typical samples have been performed using the GSAS program, and the final refinement patterns of the typical CaZnOS:Mn2+ sample are shown in Fig. 4. Correspondingly, these refinement parameters are shown in Table 1. The good fitness of χ2, Rwp, and Rp suggests that the refined results are reliable.
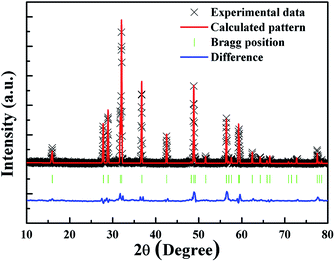 | ||
| Fig. 4 Observed (crossed) and calculated (red line) XRD patterns and the difference profile (blue line) of the Rietveld refinement of CaZnOS:Mn2+. Bragg reflections are shown as green vertical bars. | ||
| Formula | CaZnOS | CaZnOS:Mn2+ |
| Space group | P63mc | P63mc |
| a/Å | 3.75610(3) | 3.75611(2) |
| b/Å | 3.75610(3) | 3.75611(2) |
| c/Å | 11.4011(2) | 11.4012(7) |
| V/Å3 | 139.30 | 139.31 |
| α = β/° | 90 | 90 |
| γ/° | 120 | 120 |
| Z | 2 | 2 |
| Rwp/% | 3.99 | 3.76 |
| Rp/% | 2.55 | 2.71 |
| χ2 | 6.58 | 6.36 |
The effective ionic radii for the given coordination number (CN) are listed in Table 2. In view of similar ionic radii and valence state, the Mn2+ ions can be dissolved into the host lattice completely by the substitution for Zn2+ ions. The ionic radii of Ce3+ and Pr3+ are similar to that of Ca2+, but much larger than that of Zn2+. As a logical consequence, the Ca2+ sites will be substituted by Ce3+/Pr3+.
| Ion | CN | Ionic radius (Å) |
|---|---|---|
| Zn2+ | 4 | 0.60 |
| Ca2+ | 6 | 1.00 |
| Mn2+ | 4 (HS) | 0.66 |
| Mn2+ | 6 (LS) | 0.67 |
| Mn2+ | 6 (HS) | 0.83 |
| Ce3+ | 6 | 1.01 |
| Pr3+ | 6 | 0.99 |
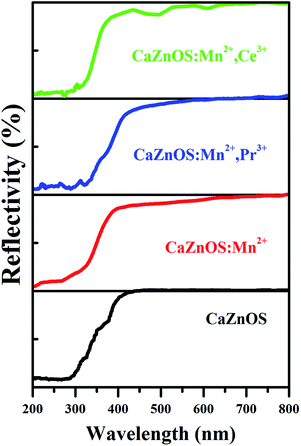
The diffuse reflectance spectra of nondoped and doped CaZnOS are comparatively demonstrated in Fig. 5. It is noticed that the CaZnOS host shows high reflection in the range of 450–800 nm and then starts to decline from 450 nm to 250 nm due to the host absorption. For CaZnOS:Mn2+ and CaZnOS:Mn2+,Pr3+, the similar reflection are observed in the range of 400–800 nm, and then they decrease obviously to 200 nm. For Mn2+, Ce3+ co-doped CaZnOS, the high reflection ends up until 450 nm, and then declines quickly to 320 nm. Two absorption bands can be observed (at about 500 and 600 nm), which should be related to the absorption of doped Ce3+.24,25
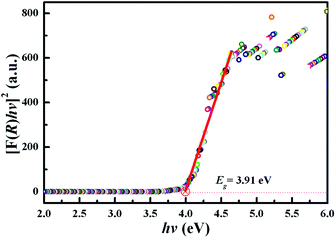
According to a previous report, the optical band gap (Eg) of the sample can be determined by the following equation provided by Tauc:26
| αhν = A(hν − Eg)n | (1) |
The α in eqn (1) is absorption coefficient h is Planck's constant, ν is the light frequency, A is the absorption constant, n is a constant exponent that determines the type of optical transitions. n = 3 represents indirect forbidden transition, n = 2 represents indirectly allowed transition, n = 3/2 represents direct forbidden transition and n = 1/2 represents direct allowed transition. In the CaZnOS host, n = 1/2.20,24
Absorption coefficient α of the sample at different wavelengths is proportional to F(R). Based on Kubelka–Munk model,27 F(R) can be expressed by the following equation:28
| F(R) = (1 − R)2/2R | (2) |
Fig. 7 exhibits the excitation and emission spectra of as-prepared samples. Fig. 7a shows the excitation and emission spectra of host material CaZnOS. In the spectra, CaZnOS shows a very broad green light emission band between 400 and 650 nm with a dominated peak at about 500 nm. An asymmetrical excitation band centered at 376 nm is observed when monitoring host emission at 500 nm. According to a previous report,31 the green emission can be assigned to the recombination of donors (VO) and acceptors (VZn) which are associated with native defects. The photoluminescence of the Mn2+ doped CaZnOS exhibits a relatively broad orange-red emission band caused by 4T1–6A1 transition of Mn2+ (Fig. 7b). Normally, the tetrahedral Mn2+ will give out the green emission,32,33 this red emission observed is ascribed to further splitting of the two level system of Mn2+ ion into more levels in a distorted tetrahedral coordination environment resulting in the first excited-state shifting to lower energy. In addition to the strong 4T1–6A1 emission from Mn2+, there is a weak emission band located at 530 nm. This band is most likely due to the Mn2+-related trap levels introduced into host lattice CaZnOS.26 Interestingly, it is complete disappearanced by codoping Pr3+ or Ce3+ into CaZnOS:Mn2+ (Fig. 7d and c). We will examine this situation in more detail below. The excitation spectra of CaZnOS:Mn2+ extended a broad range of wavelength, which could be ascribed to the host lattice absorption and a small part of weak d–d transition of Mn2+. Similarly, the excitation spectra of CaZnOS:Mn2+,M (M = Pr3+, Ce3+) also consist of two parts, one is the excitation band of host lattice (200–325 nm) and the other one is d–d transition of Mn2+ (325–550 nm). The former is much stronger than the latter. In addition, if compared with CaZnOS:Mn2+, the intensities of Mn2+ (d–d transition) absorption peaks of CaZnOS:Mn2+, Ce3+ increased obviously. These peaks at approximately 380 nm, 436 nm and 495 nm can be attributed to the transitions of 6A1 (6S) to 4T2 (4D), [4E (4G), 4A1 (4G)] and 4T2 (4G), respectively. According to Dexter theory,34 an efficient energy transfer requires a spectral overlap between the donor emission and the acceptor excitation. Fig. 7 (the red bounding box) demonstrates a significant spectral overlap between the emission bands of CaZnOS host and the excitation peaks of the Pr3+/Ce3+ codoped CaZnOS:Mn2+ sample. As a result, there could exist efficient energy transfer from host to Mn2+ in CaZnOS:Mn2+,M (M = Pr3+, Ce3+). These results give strong evidence for why the emission intensities at about 530 nm in CaZnOS:Mn2+,M (M = Pr3+, Ce3+) decreased obviously. By codoping with Pr3+ or Ce3+ can significantly improve the intensity of Mn2+ emission peak.
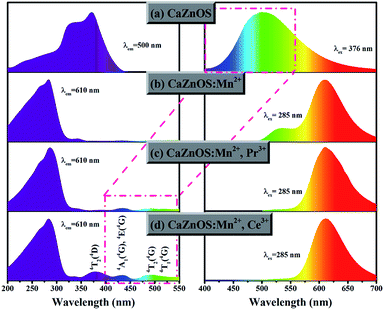 | ||
| Fig. 7 Comparison of the excitation and emission spectra from (a) CaZnOS, (b) CaZnOS:Mn2+, (c) CaZnOS:Mn2+,Pr3+, (d) CaZnOS:Mn2+,Ce3+. | ||
Fig. 8 displays persistent luminescence emission spectra recorded at different times after the 285 nm excitation source is switched off. As can be seen in Fig. 8a–c, the persistent luminescence intensity of CaZnOS:Mn2+,M (M = Pr3+, Ce3+) are remarkably stronger than that of CaZnOS:Mn2+ in the same test conditions. It is found that the emission peaks at about 610 nm and the spectral features in the persistent luminescence spectra remain unchanged and are consistent with the photoluminescence emission. Moreover, no other typical emission which belongs to the Pr3+ or Ce3+ are observed in the persistent luminescence emission spectra (Fig. 8b and c). These give evidence that the long afterglow characteristics in all cases are from the same 4T1–6A1 transition of Mn2+. It should be noted that the CaZnOS host also shows weak persistent luminescence emission. However, the persistent luminescence emission centered at 530 nm from the host in the CaZnOS:Mn2+ system is very weak (Fig. 8a).
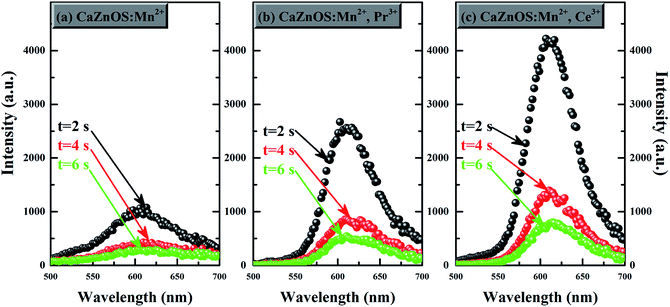 | ||
| Fig. 8 Persistent luminescence emission spectra of (a) CaZnOS:Mn2+; (b) CaZnOS:Mn2+,Pr3+; (c) CaZnOS:Mn2+,Ce3+ at different times after removal of the excitation source. | ||
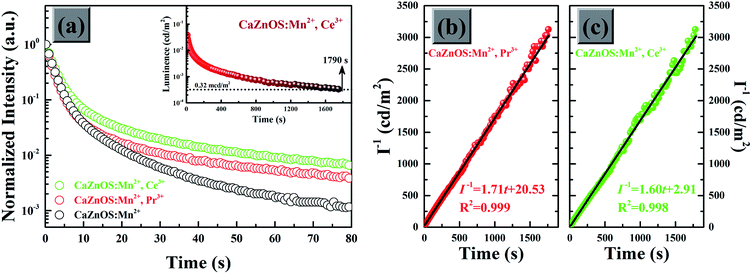
One of the most important result of the present work is that we have observed obvious enhancement and longer phosphorescence when RE3+ (Pr3+, Ce3+) co-doped into CaZnOS:Mn2+. Accordingly, the afterglow decay curves of as-prepared samples after irradiation by an artificial light have been conducted in Fig. 9a. Their initial intensity is normalized for comparison. The afterglow intensity of all samples exhibits a rapid decay and subsequential long-lasting phosphorescence. Clearly, the RE3+ (Pr3+, Ce3+) co-dopants can increase the intrinsic positive defects and result in longer the duration time. In particular, it is very exciting to note that the afterglow intensity of the CaZnOS:Mn2+,Ce3+ sample can be recorded for about 1790 s by definition of 0.32 mcd m−2 after the 1000 lux artificial light promoted (the inset of Fig. 9a). As shown in Fig. 9b and c, the afterglow decay curves of the RE3+ co-doped CaZnOS:Mn2+ samples are plotted as a function of the reciprocal afterglow intensity (I−1) versus time (t). Both of the curves can be well fitted by the linear equations. The linear dependence of I−1 vs. t indicates that the afterglow of the samples are probably caused by only one type effective trap center.35 The electron traps created by Pr3+ and Ce3+ seemed to have similar nature. This result demonstrates that the incorporation of RE3+ (Pr3+, Ce3+) does not influence the type of traps, which are predominantly responsible for the afterglow.
As already known, the density of traps generally plays a key role in the afterglow emission of optical materials. Defects with suitable structure could capture the carrier more effectively and deliver them more slowly to the emission centers. The thermoluminescence technique was carried out because of its sensitivity to the trapping property of defects. Fig. 10 represents the TL spectra of CaZnOS:Mn2+ and CaZnOS:Mn2+,RE3+ (Pr3+, Ce3+) samples. One very weak peak is observed above room temperature at around 350 K in CaZnOS:Mn2+ sample, which is formed by native defect in CaZnOS (Fig. 10a). As show in Fig. 10b and c, the TL intensity of CaZnOS:Mn2+, RE3+ (Pr3+, Ce3+) samples are more higher than the CaZnOS:Mn2+, which indicating that more traps are created when RE3+ (Pr3+, Ce3+) co-doped in CaZnOS:Mn2+. Because of the nonequivalent substitution, an excess of positive charge in the lattice must be compensated. There are two possible ways to fulfill the charge compensation of the RE3+ co-doped in CaZnOS:Mn2+ phosphor. One possible way is that two RE3+ ions replace three Ca2+ ions to balance the charge of the phosphor, which creates two  positive defects and one
  negative defect. The other possibility of the charge compensation, the vacancies of
  created during the synthesis process, is also feasible because of the relatively high vapor pressure of the Zn2+ component. By adsorbing and integrating the previous research results,36,37 it is considered that the mainly defects in Fig. 10 belong to
  created. This negative defect is responsible for the improvement of long afterglow of Mn2+. According to Chen's method,38 the trap depth and density of TL peak can be estimated by the following equations:39,40
| E = [2.52 + 10.2(μg − 0.42)](kBTm2/ω) − 2kBTm | (3) |
| n0 = ωIm/[2.52β + 10.2β(μg − 0.42)] | (4) |
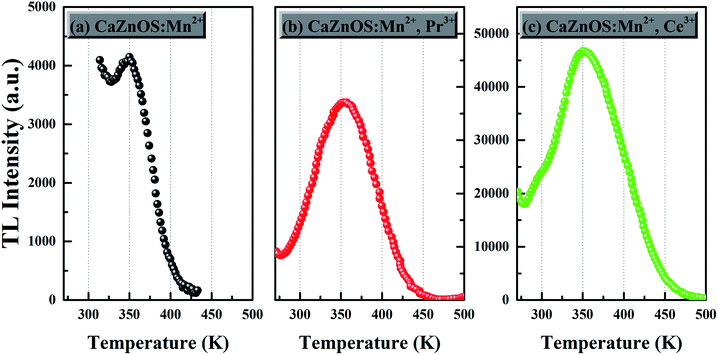 | ||
| Fig. 10 Thermoluminescence curves of (a) CaZnOS:Mn2+, (b) CaZnOS:Mn2+,Pr3+ and (c) CaZnOS:Mn2+,Ce3+. | ||
Fig. 11 displays the schematic diagram of the generation processes of host emission in CaZnOS and the after grow emission in CaZnOS:Mn2+,Ce3+. For undoped CaZnOS, under the 376 nm excitation, electrons can be pumped from valence band (VB) into conduction band (CB). The recombination of electrons and holes immediately generates the emission of host (500 nm). According to previous studies and the above results, we give the possible mechanism of afterglow in CaZnOS:Mn2+,Ce3+ as following. After UV excitation, electrons are excited to CB and holes are generated in VB in CaZnOS:Mn2+,Ce3+. Some of the excited electrons will be transferred via the lattice directly to the luminescence centers Mn2+ and finally to excited energy level of 4T1 (4G) with non-radiative transitions. Afterwards, they will release to ground state and combines with holes accompanying with the 610 nm red emission. However, most of the excited electrons and the holes are trapped by lattice defects. Subsequently, with the thermal disturbance, these carriers will be released from the traps and transferred via the host to the excited state of Mn2+ ions. In addition, some of released electrons also will transfer gradually to the excited level of Mn2+ ions through tunneling. Owing to the slowly releasing of trapped carriers, the Mn2+ emission can last for a relatively long time after the removal of excitation.
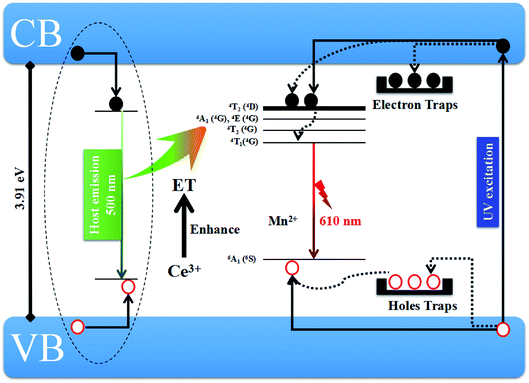 | ||
| Fig. 11 Possible schematic diagram of host emission and the red afterglow emission in CaZnOS:Mn2+,Ce3+. | ||
Conclusions
In conclusion, we extend the persistent luminescence into the red spectral region by developing a novel Mn2+-doped CaZnOS persistent phosphor. The structure and luminescent properties of CaZnOS and CaZnOS:Mn2+ phosphors were investigated. Codoping with RE3+ (Pr3+, Ce3+) ions, the CaZnOS:Mn2+,RE3+ (Pr3+, Ce3+) sample has more stronger afterglow intensity and longer duration of the afterglow. The afterglow intensity for the CaZnOS:Mn2+,Ce3+ phosphor can be recorded for about 1790 s by definition of 0.32 mcd m−2 after the irradiation have been removed. From the TL curves, we can calculate that the trap depth of CaZnOS:Mn2+,Pr3+ is 0.623 eV and CaZnOS:Mn2+,Ce3+ is 0.652 eV. Moreover, a simplified schematic illustration was also constructed based on the photoluminescence and thermoluminescence results. The results suggest that CaZnOS may be an excellent host material for Mn2+-based long afterglow. The further work can be focused on the improvement of the decay time and further enhancement of the afterglow brightness by adjusting the concentrations of RE3+ (Pr3+, Ce3+) and Mn2+.Acknowledgements
The present work was supported by the National Natural Science Foundation of China (Grant No. 21371062 and 21571067), the Project for Construction of High-level University in Guangdong Province, and the Teamwork Projects funded by the Guangdong Natural Science Foundation (Grant No. S2013030012842), the Provincial Science and Technology Project of Guangdong Province (No. 2016A050502043), and the Guangzhou Science & Technology Project (No. 201605030005).References
- P. F. Smet, D. Poelman and M. P. Hehlen, Opt. Mater. Express, 2012, 2, 452–454 CrossRef.
- F. Liu, W. Yan, Y. Chuang, Z. Zhen, J. Xie and Z. Pan, Sci. Rep., 2013, 3, 15543–15548 Search PubMed.
- T. Maldiney, A. Lecointre, B. Viana, A. Bessiere, M. Bessodes, D. Gourier, C. Richard and D. Scherman, J. Am. Chem. Soc., 2011, 133, 11810–11815 CrossRef CAS PubMed.
- T. Matsuzawa, Y. Aoki, N. Takeuchi and Y. Murayama, J. Electrochem. Soc., 1996, 143, 2670–2673 CrossRef CAS.
- K. Van den Eeckhout, P. F. Smet and D. Poelman, Materials, 2010, 3, 2536–2566 CrossRef CAS.
- K. Van den Eeckhout, D. Poelman and P. F. Smet, Materials, 2013, 6, 2789–2818 CrossRef CAS.
- S. Deng, Z. Xue, Y. Liu, B. Lei, Y. Xiao and M. Y. Zheng, J. Alloys Compd., 2012, 542, 207–212 CrossRef CAS.
- Y. Jin, Y. Hu, H. Duan, L. Chen and X. Wang, RSC Adv., 2014, 4, 11360–11366 RSC.
- A. Mondal, S. Das and J. Manam, RSC Adv., 2016, 6, 82484–82495 RSC.
- R. E. Hernandez, F. Marcos, E. Enríquez, M. A. Rubia and J. F. Fernandez, RSC Adv., 2015, 5, 42559–42567 RSC.
- T. Maldiney, A. Bessière, J. Seguin, E. Teston, S. K. Sharma, B. Viana, A. J. Bos, P. Dorenbos, M. Bessodes and D. Gourier, Nat. Mater., 2013, 13, 418–426 CrossRef PubMed.
- T. Aitasalo, J. Hölsä, H. Jungner, M. Lastusaari and J. Niittykoski, J. Phys. Chem. B, 2006, 110, 4589–4598 CrossRef CAS PubMed.
- D. C. Rodríguez Burbano, S. K. Sharma, P. Dorenbos, B. Viana and J. A. Capobianco, Adv. Opt. Mater., 2015, 3, 551–557 CrossRef.
- J. Wang, H. Zhang, B. Lei, H. Dong, H. Zhang, Y. Liu, N. Lai, Y. Fang and Z. Chen, Opt. Mater., 2014, 36, 1855–1858 CrossRef CAS.
- J. Wang, H. Zhang, B. Lei, H. Dong, H. Zhang, Y. Liu, M. Zheng and Y. Xiao, J. Am. Ceram. Soc., 2015, 98, 1823–1828 CrossRef CAS.
- S. A. Petrova, V. P. Mar'Evich, R. G. Zakharov, E. N. Selivanov, V. M. Chumarev and L. Y. Udoeva, Dokl. Chem., 2003, 393, 255–258 CrossRef CAS.
- A. Jha, U. O. Igiehon and P. Grieveson, Scand. J. Metall., 1991, 20, 270–278 CAS.
- U. O. Igiehon, B. S. Terry and P. Grieveson, Trans. Inst. Min. Metall., Sect. C, 1992, 101, C155–C158 CAS.
- R. I. Gulyaeva, E. N. Selivanov, A. D. Vershinin and V. M. Chumarev, Inorg. Mater., 2006, 42, 897–900 CrossRef CAS.
- T. Sambrook, C. F. Smura, S. J. Clarke, K. M. Ok and P. S. Halasyamani, Inorg. Chem., 2007, 46, 2571–2574 CrossRef CAS PubMed.
- C. J. Duan, A. Delsing and H. T. Hintzen, Chem. Mater., 2009, 21, 1010–1016 CrossRef CAS.
- J. Zhang, C. Xu, S. Kamimura, Y. Terasawa, H. Yamada and X. Wang, Opt. Express, 2013, 21, 12976–12986 CrossRef CAS PubMed.
- J. Nara and S. Adachi, J. Appl. Phys., 2013, 113, 33519 CrossRef.
- Z. J. Zhang, A. Feng, X. Y. Sun, K. Guo, Z. Y. Man and J. T. Zhao, J. Alloys Compd., 2014, 592, 73–79 CrossRef CAS.
- P. Dorenbos, J. Lumin., 2013, 135, 93–104 CrossRef CAS.
- J. C. Zhang, L. Z. Zhao, Y. Z. Long, H. D. Zhang, B. Sun, W. P. Han, X. Yan and X. Wang, Chem. Mater., 2015, 27, 7481–7489 CrossRef CAS.
- P. Kubelka and F. Munk, Z. Tech. Phys., 1931, 12, 593–601 Search PubMed.
- J. Tauc, Mater. Res. Bull., 1986, 3, 37–46 CrossRef.
- Y. Jin, Y. Hu, L. Chen and X. Wang, J. Am. Ceram. Soc., 2014, 97, 2573–2579 CrossRef CAS.
- Z. Zhang, A. Feng, X. Chen and J. Zhao, J. Appl. Phys., 2013, 114, 213518 CrossRef.
- B. Huang, Phys. Chem. Chem. Phys., 2016, 18, 25946–25974 RSC.
- P. F. Li, M. Y. Peng, L. Wondraczek, Y. Q. Zhao and B. Viana, J. Mater. Chem. C, 2015, 3, 3406–3415 RSC.
- L. J. Li, K. L. Wong, P. F. Lia and M. Y. Peng, J. Mater. Chem. C, 2016, 4, 8166 RSC.
- D. L. Dexter, J. Chem. Phys., 1953, 21, 836–850 CrossRef CAS.
- Z. Wang, W. Wang, H. Zhou, J. Zhang, S. Peng, Z. Zhao and Y. Wang, Inorg. Chem., 2016, 55, 12822–12831 CrossRef CAS PubMed.
- D. Li, Y. Wang, K. Xu, H. Zhao and Z. Hu, RSC Adv., 2015, 5, 20972–20975 RSC.
- R. Pang, W. Sun, J. Fu, H. Li, Y. Jia, D. Li, L. Jiang, S. Zhang and C. Li, RSC Adv., 2015, 5, 82704–82710 RSC.
- R. Chen, J. Electrochem. Soc., 1969, 116, 1254–1257 CrossRef.
- M. Wan, Y. Wang, X. Wang, H. Zhao and Z. Hu, Opt. Mater., 2014, 36, 650–654 CrossRef CAS.
- Y. Jin, Y. Hu, Y. Fu, G. Ju, Z. Mu, R. Chen, J. Lin and Z. Wang, J. Am. Ceram. Soc., 2015, 98, 1555–1561 CrossRef CAS.
Footnote |
| † Electronic supplementary information (ESI) available. See DOI: 10.1039/c7ra05861f |
| This journal is © The Royal Society of Chemistry 2017 |

