 Open Access Article
Coumarin centered copper(II) complex with appended-imidazole as cancer chemotherapeutic agents against lung cancer: molecular insight via DFT-based vibrational analysis†
Mohammad Usmana,
Mehvash Zakia,
Rais Ahmad Khanb,
Ali Alsalmeb,
Musheer Ahmadc and
Sartaj Tabassum *a
*a
aDepartment of Chemistry, Aligarh Muslim University, Aligarh – 202002, India. E-mail: tsartaj62@yahoo.com; Tel: +91 9358255791
bDepartment of Chemistry, College of Science, King Saud University, P.O. Box 2455, Riyadh 11451, Kingdom of Saudi Arabia
cDepartment of Applied Chemistry, Aligarh Muslim University, Aligarh – 202002, India
First published on 20th July 2017
Abstract
Coumarins are well known for the design of target-specific therapeutics for cancer oncology. In lieu of their potential applications as antitumor chemotherapeutics, a new coumarin-based copper(II) complex 1 was synthesized employing 6-methyl-3-((quinolin-8-ylimino)methyl)-3H-chromene-2,4-dione (L). The structure elucidation of 1 was done by various spectroscopic techniques (viz., IR, Raman, UV-vis, and EPR), elemental analysis and single crystal X-ray diffraction. Raman and IR combined with B3LYP/DFT frequency calculations were used to characterize the lattice dynamics with an emphasis on the doming mode vibrations of the copper site. Prominent features in the Raman and far-IR spectrum, indicative of doming modes, appeared in the 35–150 cm−1, other out-of-plane and in-plane mode of vibrations in the range of 160–250 cm−1 and 260–700 cm−1, respectively. Furthermore, preliminary in vitro binding studies of L and complex 1 with CT-DNA were carried out by various biophysical techniques. The results demonstrated that 1 avidly binds to CT DNA as compared to L and cisplatin (marketed drug in use for treating solid cancers) via a partial intercalative mode. Furthermore, pBR322 cleavage studies of 1 revealed the hydrolytically double-stranded cleavage pattern verified by T4 ligase religation. The cytotoxicity activity of L and complex 1 was carried out to evaluate cell growth inhibition in a human alveolar epithelial A549 cancer cells (human lung carcinoma) by the MTT assay. Interestingly, the IC50 value of complex 1 was found to be 4.6 ± 0.3 μM which is significantly lower as compared to the IC50 values of previously reported Cu(II) complexes. Furthermore, in the presence of 1, the level of reactive oxygen species (ROS) and thiobarbituric acid reactive substance (TBARS) displayed significant increase, coupled with reduced glutathione (GSH) levels on the A549 cancer cell. Thus, the results confirm the important role of ROS generation and discover Cu(II) complex 1 induced cell apoptosis and validate its potential to act as a robust anticancer drug entity.
Introduction
Medicinal inorganic chemistry is a thriving field of interdisciplinary research in which metal complexes are explored for interaction with biomolecules viz., DNA/RNA and proteins; this field gained momentum after the revolutionary success of cisplatin, cis-diamminedichloroplatinum(II), a clinically approved antitumor drug for the treatment of solid malignancies. Cisplatin obstructs DNA through binding to guanine bases is known, inducing kinks in the biomolecule, which leads to cell death.1 Nevertheless, systemic side effects of cisplatin remain a challenge to overcome and result in new design strategies for developing efficacious antitumor drugs based on metals other than platinum. Next to ruthenium, copper complexes are regarded as the most promising alternatives for classical cisplatin-type drugs.2,3Copper(II) complexes have attracted considerable attention as antitumor drugs owing to their capability of interacting directly with DNA/nuclear proteins.4 Copper possesses high affinity for nucleobases and has demonstrated broad anticancer activity due to the selective permeability of cancer cell membranes to copper complexes.5,6 Additionally, copper is an essential cofactor for numerous enzymes involved in oxidative metabolism, superoxide dismutase, ascorbic acid oxidase, ceruloplasmin, and tyrosinase etc.7 Besides this, copper is a physiologically important endogenous metal centre that plays a crucial role in redox reactions and triggers the generation of reactive oxygen species (ROS) which induce apoptosis in cancer cells.
Since cancers are derived from multiple aetiologies and various phenotypes (more than 200) of cancers exist, therefore, one-size fits all concept does not work and present day researchers are focusing on targeted cancer therapies which involve the use of drugs or other natural compounds that inhibit the progress and spread of cancerous cells by interfering with particular molecules or pathways that are involved in cancer growth or progression.8 The ligand scaffolds in such compounds not only control the reactivity of the metal but also exhibit a vital role in shaping the nature of coordination-sphere interactions involved in recognition of biological target sites. The heterocyclic ligands are capable of in situ transformations/other modifications e.g. hydrolysis or redox reactions mediated by the metal.9 In lieu of this, natural product compounds like chromones, flavonoids, coumarins, etc. are considered to be privileged ligand scaffolds for inorganic medicinal chemistry that involve different types of cancer targets, viz. nucleic acids (DNA/RNA),10 enzymes (kinase inhibitors and topoisomerases)11,12 and membrane receptors (dopamine D2 receptor agonists)13 etc.
Coumarins and their analogs are the key components of many bioactive compounds. Because of a diverse array of pharmacological and biochemical properties exhibited by coumarins and its derivatives, such as anticancer,14 antioxidant,15 anti-inflammatory,16 anti-HIV,17 antimicrobial,18 and anticoagulant activities,19 they are extremely in the mandate for use as precursors in metal-based drug regimes. The coumarin compounds serve as unique and versatile scaffolds for the development of target-specific therapeutics that may exhibit diverse mechanisms of action on a variety of biological targets in cancer oncology.20,21
Furthermore, probing vibrations coupled to localized electronic excitations during the chemical reactions could be crucial to depict the interactions at the active site on the molecular level.22 Experimental identification of in-plane and out-of-plane vibrations could significantly contribute to binding interactions with biological molecules and their reaction dynamics.23 Among the out-of-plane vibrations, the most significant modes in the low-frequency region are the doming modes. They are reactive modes, because they may facilitate binding towards the specific biological targets.22b
In pursuit of our continuous investigation for the design and synthesis of targeted metal based chemotherapeutic antitumor agents,24,41 we have opted for a new elegant modality in metal-based drug design by incorporating an endogenously biocompatible metal ion into the metal binding domain of a bioactive pharmacophore. Herein, we describe the synthesis, spectroscopic characterization, and single-crystal X-ray studies of the Cu(II) complex (1) of the in situ-generated coumarin scaffold 6-methyl-3-((quinolin-8-ylimino)methyl)-3H-chromene-2,4-dione (L). In vitro DNA-binding profile, pBR322 DNA cleavage and cytotoxic activity of complex 1 against human adenocarcinoma alveolar basal epithelial (A-549) cell line were also evaluated. Also, ROS generation, intracellular glutathione depletion, and lipid peroxidation assays were carried out to support the results of cytotoxicity.
Experimental
Materials
Commercially obtained chemicals and solvents were used without further purification. Cu(NO3)2·3H2O (Merck), 3-formyl-6-methyl chromone (Sigma-Aldrich), 8-aminoquinoline (Sigma-Aldrich), 6X loading dye (Fermentas Life Science), and supercoiled pBR322 DNA (E. coli) (Sigma-Aldrich) were utilized as received. The disodium salt of CT-DNA was purchased from Sigma Chem. Co. and was stored at 4 °C.The diagnostic kits, reagents, and other specified chemicals, for cytotoxic studies, were procured from Sigma Chemical Company Pvt. Ltd, St Louis, MO, USA. DMEM, antibiotics/antimycotics solution and FBS were purchased from Invitrogen, Life Technologies (USA). Plastic and Culture wares consumables used in this study were procured from Nunc, Denmark.
Physical measurements
Carbon, hydrogen, and nitrogen contents were carried out on CHN Elemental Analyzer (model: Elementar Vario EL III). The CON 510 Bench conductivity TDS Meter, was used to measure molar conductance. Fourier-transform infrared (FT-IR) spectra were recorded on Spectrum Two PerkinElmer FT-IR spectrometers. The ESR spectrum of the Cu(II) complex was obtained on a JEOL FA 200 ESR spectrometer using X-band frequency (9.5 GHz) at room temperature in the solid state. Electronic spectra were recorded on PerkinElmer Lambda 35 UV-vis spectrometer in MeOH using 1 cm path length cuvette, and data were reported in λmax/nm. Fluorescence measurements were determined on an RF-5301 PC spectrofluorophotometer (Shimadzu). Cyclic voltammetric were performed in a single compartmental cell of volume 10–15 ml containing a three electrode system comprised of a Pt disk working electrode, Pt wire as an auxiliary electrode and an Ag/AgCl electrode as a reference electrode.Synthesis
![[thin space (1/6-em)]](https://www.rsc.org/images/entities/char_2009.gif) :
:![[thin space (1/6-em)]](https://www.rsc.org/images/entities/char_2009.gif) 1, electrolyte). UV-vis (1 × 10³ M, MeOH, nm): 214, 266, 399, 636.
1, electrolyte). UV-vis (1 × 10³ M, MeOH, nm): 214, 266, 399, 636.Computational details
All reported computations were performed using ORCA 3.0 computational package.25 Experimental geometry was obtained from single crystal X-ray data. The frequency calculation carried out by hybrid B3LYP functional26 using Aldrich's def2-TZVP basis set for copper atom and def2-SVP basis set for C, H, O, N atoms.27 The structure was further re-calculated using def2-TZVP basis set for all atoms to calculate the HOMO and LUMO energies. To speed up the calculations we employed the resolution of identity (RI) approximation with the decontracted auxiliary def2-SVP/J and def2-TZV/J coulomb fitting basis sets and the chain-of-spheres (RIJCOSX) approximation to exact exchange as executed in ORCA.28 The molecular docking studies have been performed by using AutodockVina version 1.1.2.29 All rotatable bonds inside the ligand were allowed to rotate freely, and receptor was considered rigid. The crystal structure of the B-DNA dodecamer d(CGCGAATTCGCG)2 (PDB ID: 1BNA) was retrieved from the protein data bank (http://www.rcsb.org./pdb). The visualization of minimum energy favorable docked poses has been performed using Discovery Studio 4.1 and PyMol.30Crystal structure determination
Bruker SMART APEX CCD diffractometer was used to collect single crystal X-ray data of complex 1 at 100 K on a using graphite monochromatic MoKα radiation (λ = 0.71073 Å). The linear absorption coefficients, scattering factors for the atoms and the anomalous dispersion corrections were referred from the International Tables for X-ray crystallography.31 The data integration and reduction were worked out with SAINT software.32 Empirical absorption correction was applied to the collected reflections with SADABS,33 and the space group was determined using XPREP.34The structure was solved by the direct methods using SHELXTL-2016 and refined on F2 by full-matrix least-squares using the SIR-97 program package.35 Only a few H atoms could be located in the difference Fourier maps in the structure. The remaining were positioned in calculated positions using idealized geometries (riding model) and assigned fixed isotropic displacement parameters. All non-H atoms were refined anisotropically. The refinement and crystal data are presented in Table 1. Selective bond distances and angles are given in Tables S1 and S2.†
| Parameters | Complex 1 |
|---|---|
| a GoF is defined as {Σ[w(F02 − Fc2)]/(n − p)}1/2 where n is the number of data and p is the number of parameters.b R = {Σ||F0| − |Fc||/Σ|F0|}, wR2 = {Σw(F02 − Fc2)2/Σw(F02)2}1/2. | |
| Formula | C23H17CuN5O6 |
| Fw (g mol−1) | 427.31 |
| Crystal system | Monoclinic |
| Space group | P21/n |
| a (Å) | 8.009(5) |
| b (Å) | 8.714(5) |
| c (Å) | 29.961(5) |
| α (deg) | 90 |
| β (deg) | 94.39 |
| γ (deg) | 90 |
| U (Å3) | 2084.9(18) |
| Z | 4 |
| ρcalc (g cm−3) | 1.666 |
| μ (mm−1) | 1.103 |
| F (000) | 1068 |
| Crystal size (mm) | 0.29 × 0.21 × 0.16 |
| Temp (K) | 100(2) |
| Measured reflns | 15![[thin space (1/6-em)]](https://www.rsc.org/images/entities/char_2009.gif) 483 483 |
| Unique reflns | 3143 |
| θ range (deg)/completeness (%) | 2.59 to 25.00/0.999 |
| GOFa | 1.066 |
| Final Rb indices [I > 2σ(I)] | R1 = 0.0386 |
| wR2 = 0.0972 | |
| Rb indices (all data) | R1 = 0.0497 |
| wR2 = 0.1030 | |
| Largest diff. peak/hole (e Å−3) | 0.474/−0.389 |
| CCDC | 1452079 |
Methodology for biological studies
DNA binding experiments include absorption spectral traces, emission spectroscopy, DNA cleavage experiment confirmed to the standard protocol and practices earlier adopted by our laboratory.36,37 DNA religation experiment was carried out by adopting standard portocol38 to ascertain hydrolytic mechanism DNA cleavage using T4 ligase enzyme. In vitro experiment on A549 cell line viz., cell proliferation, cell culture, MTT assay, ROS generation, depletion of intracellular glutathione and lipid peroxidation assay were carried by adopting standard methods38,39 with slight modification as reported earlier and references therein.40–43Results and discussion
Synthesis and characterization
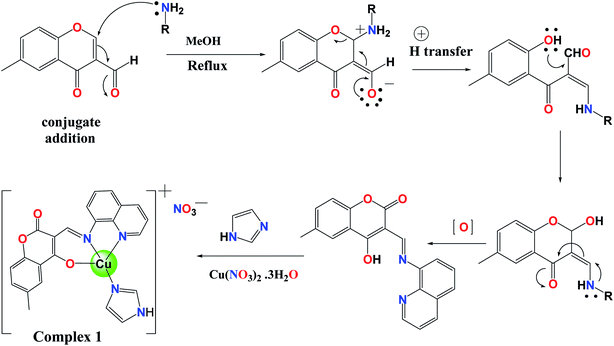
The tridentate coordinating Schiff base ligand L was prepared by condensation of 3-formyl-6-methyl chromone with 8-aminoquinoline in methanol. The reaction of aldehyde 1 with aryl-amine 2 in methanol produced the ligand L by following conjugate addition of amine to α,β-unsaturated system as shown below in scheme (Fig. 1).44The reaction of L and imidazole with Cu(NO3)2·3H2O in a 1![[thin space (1/6-em)]](https://www.rsc.org/images/entities/char_2009.gif) :
:![[thin space (1/6-em)]](https://www.rsc.org/images/entities/char_2009.gif) 1
1![[thin space (1/6-em)]](https://www.rsc.org/images/entities/char_2009.gif) :
:![[thin space (1/6-em)]](https://www.rsc.org/images/entities/char_2009.gif) 1 molar ratio in the presence of triethylamine (Et3N) at pH 8–10 in dry methanol at 40 °C yielded dark green colored crystals of complex 1. The molecular structure elucidation of L and complex 1 was done by analytical and spectral studies, and furthermore, the structure of complex 1 was confirmed by using a single crystal X-ray diffraction study which revealed that complex 1 exists in a distorted square-planar environment. The molar conductivity value of the complex 1 is equal to 121 Ω−1 cm2 mol−1 in MeOH, indicating its electrolytic (1
1 molar ratio in the presence of triethylamine (Et3N) at pH 8–10 in dry methanol at 40 °C yielded dark green colored crystals of complex 1. The molecular structure elucidation of L and complex 1 was done by analytical and spectral studies, and furthermore, the structure of complex 1 was confirmed by using a single crystal X-ray diffraction study which revealed that complex 1 exists in a distorted square-planar environment. The molar conductivity value of the complex 1 is equal to 121 Ω−1 cm2 mol−1 in MeOH, indicating its electrolytic (1![[thin space (1/6-em)]](https://www.rsc.org/images/entities/char_2009.gif) :
:![[thin space (1/6-em)]](https://www.rsc.org/images/entities/char_2009.gif) 1) behavior.
1) behavior.
Crystal structure description of [Cu(L)(ImH)]NO3 (1)
The mixed-ligand mononuclear copper(II) complex [Cu(L)(ImH)]NO3 1 was structurally characterized by single-crystal X-ray crystallography (Fig. 2).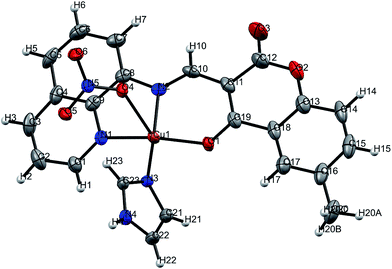 | ||
| Fig. 2 ORTEP view of complex 1 with partial numbering. Solid thermal ellipsoids are reported at the 50% probability level. | ||
Details of the crystallography data and refinement parameters are summarized in Table 1. Selected bond angles and distances are listed in Tables S1 and S2.† Details of the hydrogen bonding parameters are listed in Table S3.† Single-crystal X-ray structural study revealed that complex 1 crystallized in the monoclinic P21/n space group possessing the lattice parameters, a = 8.009(5) Å, b = 8.714(5) Å, c = 29.961(5) Å, α = γ = 90°, β = 94.390° per unit cell. As shown in Fig. 1, the asymmetric unit content for [Cu(L)(ImH)]NO3 1, is consist of a Cu(II) ion coordinated by a tridentate monoanionic Schiff base ligand (L−1), acting as an (ONN) donor and by an imidazole (Im) moiety. The tetra-coordinated Cu(II) center exhibits a square-planar coordination environment, with three donor atoms [Cu(1)–N(1) 1.990 Å, Cu(1)–N(2) 1.944 Å, and Cu(1)–O(1) 1.918 Å] from the deprotonated Schiff base ligand (L−1), and one nitrogen of the imidazole moiety [Cu(1)–N(3) 1.949 Å]. The coordination geometry of the Cu(II) center can be described as a slightly distorted square-planar arrangement. Interestingly, one nitrate anion present in the outside of the coordination sphere might be showing the semi-coordination type of weak interaction [Cu(1)–O(4) 2.639 Å] with substantial elongation than reported coordinate-covalent bond lengths.45 It is noteworthy that the oxygen atom O(5) of the nitrate group has a strong intermolecular hydrogen bond with the uncoordinated N(4) atom of the imidazole moiety [O(5)⋯N(4) = 1.949 Å]. Despite the H-bonding, the 2D supramolecular architecture is also stabilized by a multi-point intricate array of π⋯π and –CH⋯π interactions as depicted in Fig. S1–S3.†
Spectroscopic investigation
The 1H NMR spectra (Fig. S4–S6†) of ligand L exhibited azomethine proton (–CH![[double bond, length as m-dash]](https://www.rsc.org/images/entities/char_e001.gif) N), protons associated with quinolone's and chromone's aromatic moieties and the aliphatic protons of the methyl group in the characteristic signature regions (for detail see Experimental section above).46,47 Similarly, 13C NMR spectrum of the ligand “L” (Fig. S7†) displayed distinct signals for the all the carbon, a prominent resonance peak for the carbonyl group was observed at 180.29 ppm. However, the signals associated with aldimine carbon, quinoline and chromone moieties in the 153.44–101.27 ppm range (aromatic), respectively whereas the methyl carbon atoms were observed slightly upfield at 20.21 ppm.
N), protons associated with quinolone's and chromone's aromatic moieties and the aliphatic protons of the methyl group in the characteristic signature regions (for detail see Experimental section above).46,47 Similarly, 13C NMR spectrum of the ligand “L” (Fig. S7†) displayed distinct signals for the all the carbon, a prominent resonance peak for the carbonyl group was observed at 180.29 ppm. However, the signals associated with aldimine carbon, quinoline and chromone moieties in the 153.44–101.27 ppm range (aromatic), respectively whereas the methyl carbon atoms were observed slightly upfield at 20.21 ppm.
The electronic spectrum (Fig. S8†) of ligand L displayed intense absorption bands at 211 nm corresponding to n–π* transition which was shifted to 216 nm upon coordination with the Cu(II) metal ion. Besides that, the ligand L and complex 1 exhibited an intense transition at 275 and 270 nm, respectively attributed to the intraligand π–π* transition of the Schiff base ligand while the absorption band at 404 nm characteristic of the LMCT was observed predominantly at higher complex concentrations. The low energy broadband in the visible region appeared at 606 nm consistent with the distorted square planar environment around Cu(II) ion.48
EPR study of a polycrystalline sample of complex 1 recorded at room temperature (Fig. S9†) exhibited g∥ and g⊥ values of 2.23 and 2.05, respectively, while gav value was determined to be 2.11 from the relation gav2 = 1/3(g∥2 + 2g⊥2). These calculated data were in agreement with an orbitally non-degenerate state for four-coordinate Cu(II) complexes. The value of g∥ > g⊥ > 2.0023 revealed that the unpaired electron was most likely to be formally localized in the dx2−y2 ground state, and a square planar geometry proposed for the complex 1.49 The value g∥ > 2.3 is characteristic of an ionic environment and g∥ < 2.3 of covalent environment in M–L bonding.50 The experimental g∥ values for complexes were less than 2.3, in agreement with the covalent character of the M–L bond.
Stability of the complex
The stability of synthesized ligand and complex 1 in Tris–HCl buffer under physiological conditions (pH = 7.3 and T = 310 K) was measured over different time intervals (0 h, 1 h, 3 h, 6 h, 12, 24, and 48 h) using UV-Vis spectrophotometer (Fig. S10†). The recorded UV-Vis spectra did not reveal any appreciable change in either the intensity or the position of the absorption bands indicating their stability under physiological conditions.Vibrational mode analysis
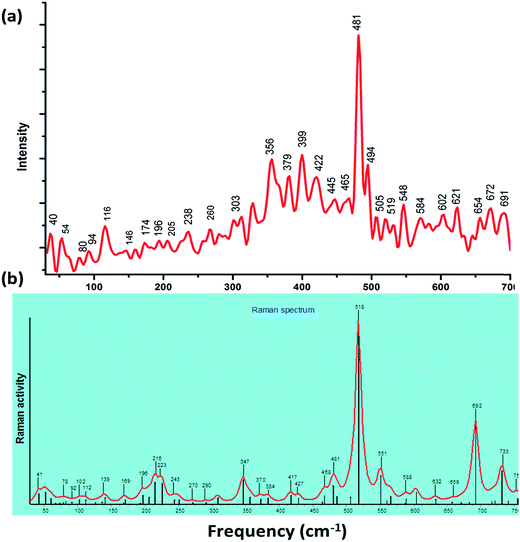
The study of assignments of Cu skeletal doming and other vibrational modes of biological relevance is scarce in the literature due to the absence of direct techniques, and therefore, it was quite appealing to probe the motion of Cu nuclei in low-frequency range 30–400 cm−1 by employing far-IR and Raman spectroscopic method combined with DFT calculations. The calculations predicted all 3N-6 vibrational modes with real frequencies, which range from 30 cm−1 to ca. 4000 cm−1. We have focused in the range 0–700 cm−1 which involve the O–Cu–O/N–Cu–N/Cu–O/Cu–N vibrations. DFT results revealed the several types of metal-assisted vibrations (a) doming modes (b) out-of-plane and (c) in-plane vibrations. Doming mode51 is a specific type out-of-plane mode which appears below 150 cm−1 (it involves relative translation of the Cu nuclei perpendicular to its mean plane, counterbalanced by motion of other O, N-donor ligand moiety in the opposite direction) that could helpful in the destabilizing the structure and functioning of the bio-macro-molecules viz., DNA, RNA, enzymes and proteins.The experimental and simulated IR (Fig. S11 and S12†) and Raman spectra of complex 1 are depicted in Fig. 3. For complex 1, out-of-plane vibrational modes were observed at 54, 80, 94, 116, 146, 174 and 205 cm−1 which involved various complicated vibrations of skeletal framework along with the dynamics of Cu(II) ion and in-plane vibrational modes in the range of 250–700 cm−1.
The observed, as well as theoretical vibrational modes, correspond to out of plane (doming, wagging, twisting) and in-plane (stretching, anti-symmetric stretching, rocking) as depicted in Table 2. Some animated images of significant modes of vibration with displacement vectors have also been included in the ESI material.†
| Raman | IR | Mode of vibrations | ||
|---|---|---|---|---|
| Exp. band | DFT band | Exp. band | DFT band | |
| 54 | 58 | N(4)–Cu–N(5) + γN(2)–Cu–O(3) (doming mode) + NO3 (twisting) | ||
| 80 | 82 | 75 | 78 | N(4)–Cu–N(5) + γN(2)–Cu–O(3) (doming mode) |
| 94 | 92 | NO3 (twisting) | ||
| 116 | 112, 125 | 117 | 125 | N(4)–Cu–N(5) + N(2)–Cu–O(3) (doming mode) |
| 146 | 139, 135 | N(2)–Cu–O(3) (doming mode) | ||
| 174 | 169 | 174 | 169 | N(2)–Cu–O(3) (wagging) + N(4)–Cu–N(5) (wagging) |
| 196 | 196 | N(2)–Cu–N(5) (scissoring-deformation in-plane) | ||
| 205 | 206, 226 | 205 | 206, 226 | O(3)–Cu–N(5) (wagging), N(4)–Cu–N(5) + N(2)–Cu–O(3) (doming mode) |
| 238 | 243 | 240 | 246 | O(3)–Cu–N(4) (scissoring-deformation in-plane) |
| 260 | 270 | 260 | 270 | Cu–O(1) (symmetrical stretching)-semi-coordination of Cu–NO3 |
| 303 | 307 | 304 | 307 | N(4)–Cu–N(5) (anti-symmetrical stretching) |
| 356 | 347, 357 | 352 | 347 | N(2)–Cu–N(4) (twisting) |
| 465 | 462, 468 | 472 | 468 | N(2)–Cu–N(4) (wagging) |
| 519 | 518 | Cu–N4 (symmetrical stretching) | ||
| 548 | 551, 556 | 541 | Cu–O3 (symmetrical stretching) | |
| 584 | 588 | 581 | 588 | N4–Cu–O3 (rocking) |
| 672 | 672 | Cu–N2 (symmetrical stretching) | ||
| 691 | 692 | 692 | N4–Cu–O3 (anti-symmetrical stretching) | |
Preliminary DNA binding profile
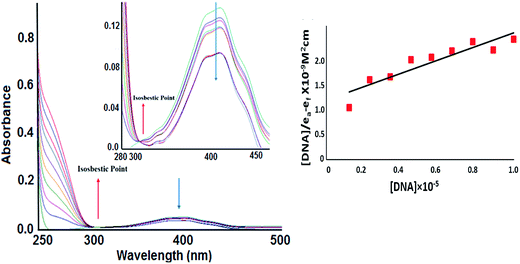
To determine the binding mode of ligand L and complex 1 with calf thymus DNA (CT-DNA), absorption titrations experiments were carried out. The absorption spectra were recorded upon addition of increasing concentration of CT DNA to the fixed concentration of L (Fig. S13†) and 1 as depicted in Fig. 4. ‘Hyperchromic’’ and ‘‘hypochromic’’ effects are the spectral features of DNA concerning its double-helix structure. Hyperchromism is endorsed to the presence of synergic non-covalent interactions: external contact (electrostatic binding), hydrogen bonding and groove surface binding (major or minor) along outside of DNA helix. While ‘hypochromism’ is the characteristic of the intercalative mode of binding and is attributed to the strong π → π* stacking interaction between the aromatic chromophore ligand of metal complexes and base pairs of DNA, stabilizing the DNA duplex.The ligand centered transitions at 266 and 399 nm for complex 1 attributed to the π–π* transition and LMCT bands, respectively were considered for the corresponding absorptivity changes upon the incremental addition of DNA. The band centered at 266 nm exhibited ‘hyperchromism’ with strong blue shift of 5–7 nm and the weak band at 399 nm exhibited ‘hypochromism’ of about 30% and 66%, respectively revealing the favorable electrostatic interaction of the cationic core to the polyanionic phosphate backbone of the DNA double helix, in addition to the active participation of coumarin chromophores via partial intercalation. The appearance of a sharp isosbestic point at 299 nm indicated that there is an equilibrium between the free and the DNA-bound probe in the ground state. On the other hand, ligand L on the addition of CT DNA exhibited ‘hyperchromism’ of (47%) with a strong blue shift of 5 nm at 269 nm band. These changes in spectra can be ascribed to non-covalent binding interactions leading to the alteration in the conformation of DNA. Furthermore, the spectral features are also evocative of an end-stacking binding mode and could involve accompanying interactions with DNA loops and phosphate backbone. To evaluate quantitatively the binding strength of complex 1 and ligand L with CT-DNA, the intrinsic binding constant, Kb was determined by monitoring the changes in the absorbance in the intraligand band at the corresponding λmax with increasing concentration of DNA and is given by the ratio of the slope to the intercept in plots of [DNA]/(εa − εf) versus [DNA]. The Kb values for L and 1 were found to be 6.5 × 10³ and 1.1 × 10⁴ M−1 (with a mean standard deviation of ±0.13), respectively indicating that 1 avidly binds to CT DNA much greater than the free ligand L.
DNA thermal denaturation studies
The thermal denaturation studies in the presence of metal complexes can give insight into DNA conformational changes and provide information about their relative binding strengths. When the temperature of DNA has raised the hydrogen bonding, and base stacking interactions between the strands of the double helix in DNA can be disrupted, resulting in the unfolding of the double helix into single strands.52 The breakage of double-stranded-DNA into single strand-DNA can be detected by the ‘‘hyperchromic effect’’ in the UV absorption at 260 nm because the molar extinction coefficient of the DNA base pairs of ss-DNA is much higher than in ds-DNA. The temperature at which half of the double-helical DNA strands are unfolded to single strands is the melting temperature (Tm) of DNA. The extent of ΔTm is the interface between the value induced by electrostatic and intercalative binding. Intercalation of small organic molecules and metallo-intercalators stabilizes the DNA duplex through π–π stacking resulting in a substantial increase in the Tm of DNA, while groove binding/electrostatic interaction leads to an imperceptible variation (1–3 °C) in the value of Tm. The melting profile of DNA in the absence and presence of ligand L and complex 1 is depicted in Fig. S14.† The Tm value CT DNA (free) was 78 ± 0.5 °C under our experimental conditions. The melting temperatures (Tm) value in the presence of ligand L and complex 1 were found to be is 82 ± 0.5 and 84 ± 0.5 °C. The observed ΔTm value of 4–6 °C is similar to that of other groove binders as well as partial intercalators but less than that of other intercalators like [Ru(bpy)2(dppz)]2+ which exhibited ΔTm of around 7–14 °C.53Fluorescence spectral studies
The fluorescence spectral method has been used to examine the potential interaction of metal complexes with DNA due to its high sensitivity, good repeatability, and accuracy. Literature revealed that many small molecules are useful, sensitive probes for assessing the local structure of nucleic acid and they can interact with DNA by specific binding modes.54 Therefore, the binding ability of the complex with DNA was investigated by fluorescence spectroscopy by monitoring the changes in emission intensity by the aliquot addition to DNA. In general, intercalation between the metal complexes and DNA results in hypochromism with or without red/blue shift; on the other hand, non-intercalative/electrostatic interaction causes hyperchromism. The emission spectra of ligand L and complex 1 displayed an intense luminescence at 326–327 and 442–436 nm in 0.01 Tris–HCl/50 mM NaCl buffer at room temperature in the absence of DNA when excited at 266 nm. From the emissive titration spectra it is apparent that on addition of increasing concentration of CT DNA (0.8 × 10⁻⁵ to 5.6 × 10⁻⁵ M) to fixed amount of L (Fig. S15†) and 1 (Fig. 5), displayed hypochromism of about 89% and 92%, respectively at 442 and 436 nm with strong red shift of 14 nm and in complex 1 no shift in the wavelength was observed.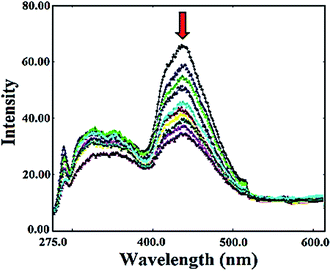 | ||
| Fig. 5 Emission spectra of complex 1 in Tris–HCl buffer (pH 7.2) with and without of CT DNA at room temperature. The arrow shows a change in intensity with increasing concentration of DNA. | ||
The observed hypochromism demonstrated that the binding of the L and 1 with DNA was due to change in microenvironment around fluorophore residue inside the DNA helix which suggests an intercalative mode of binding involving a strong pi–pi stacking interaction between aromatic ligand and the base pairs of DNA.55,56 The intrinsic binding constant K for L and 1 determined from Scatchard equation from the plot of r/CF versus r (=CB/[DNA]) were found to be 9.4 × 10³ and 8.3 × 10⁴ M−1, respectively.
Ethidium bromide displacement assay
EB is a planar cationic dye which is widely used as a sensitive fluorescence probe for native DNA. EB emits strong fluorescence in the presence of DNA due to its strong intercalation of the planar phenenthridinium ring between the adjacent DNA base pairs. Molecules that change the fluorescence intensity of EB–DNA system has been reported as a standard intercalating agent of DNA, and it is a reliable tool to measure the affinity of the complex for DNA, irrespective of the binding modes.57a The addition of a second DNA-binding molecule can quench the DNA–EB adduct emission by either replacing the EB and/or by accepting the excited-state electron of the EB through a photoelectron transfer mechanism.57b Upon addition of increasing concentration of L and 1 to pretreated CT DNA with EB ([DNA]/[EB] = 1) solution, the emission band at 596 nm exhibited quenching of the emission intensity up to 39 and 45% of the initial fluorescence intensity when the molar ratio of the ligand/complex to DNA (r = [ligand/complex]/[DNA]) range from 1.6 to 15.0 (Fig. S16†).The observed quenching of DNA–EB fluorescence indicated that the EB molecule was displaced by ligand L and complex 1 from their DNA binding sites.
Since EB was not completely displaced, partial intercalation in addition to the electrostatic mode of binding cannot be ruled out.58 The quenching efficiency (Ksv) was evaluated, and quenching data is in agreement with the classical linear Stern–Volmer equation,
| I0/I = 1 + Ksv[Q] |
| KEB[EB] = Kapp[complex] |
Cyclic voltammetry studies
The electrochemical methods are employed to study the redox behavior of metal complexes due to their accessible redox states. Moreover, the application of the cyclic voltammetry technique to investigate the interaction of metal complexes and DNA provide a useful complement to the spectroscopic methods. The cyclic voltammogram (CV) of complex 1 in absence and presence of CT DNA in Tris–HCl buffer solution was depicted in Fig. 6.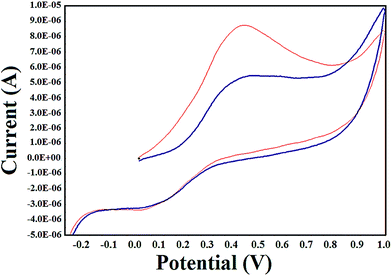 | ||
Fig. 6 Cyclic voltammogram of complex 1 in the absence (red line ( )) and presence (blue line ( )) and presence (blue line ( )) of CT DNA at 150 mV s−1 scan rate under a nitrogen atmosphere. [Complex 1] = 0.4 mM, [DNA] = 0.6 mM. )) of CT DNA at 150 mV s−1 scan rate under a nitrogen atmosphere. [Complex 1] = 0.4 mM, [DNA] = 0.6 mM. | ||
The cyclic voltammogram of complex 1 showed quasi-reversible one electron Cu(II)/Cu(I) redox wave at 100 V s−1 scan rate using Ag/AgCl electrode in the potential range −1 to +1 V. The cathodic peak potential (Epc), anodic peak potential (Epa), formal potential (E1/2) and the difference of the anodic and cathodic peak potential (ΔEp) were estimated to be 0.01 V, 0.43 V, 0.22 V and 0.42 V, respectively. The ratio of the oxidation peak current to reduction peak current (Ipa/Ipc) = 0.95 for complex 1 indicated that the redox process was quasi-reversible.60 No new peaks appeared after the addition of DNA to complex 1. However, in the presence of DNA, the anodic peak potential decreased significantly and showed positive shift attributed to the slow diffusion of complex 1 bound to DNA. The Epc, Epa, E1/2, ΔEp the ratios of the peak current (Ipa/Ipc) were calculated to be 0.05, 0.47, 0.26, 0.42 and 0.95, respectively indicating the intercalation of the complex 1 inside the DNA helix. Previous literature reports reveal that copper complexes exhibit a positive shift in peak potential on intercalation via hydrophobic interactions while the electrostatic interactions (groove binding) lead to a negative shift in peak potential.61 Hence it can be concluded that 1 was bound to DNA via intercalation, by insertion of the complex 1 between the base pairs of the DNA duplex. The binding constant, K, for the interaction of the complex 1 with DNA was calculated according to the following equation:62
| log(1/[DNA]) = log(K) + log(Ifree/(Ifree − Ibond)) |
Furthermore, the LUMO and HOMO orbital energy parameters are significantly accountable for the charge transfer, chemical reactivity and kinetic/thermodynamic stability of a molecule. Metal complexes with a small energy gap (ΔE) between HOMO and LUMO are more polarizable; thereby act as soft molecules with higher chemical reactivity. However, complexes with large energy gap offer greater stability and low chemical reactivity than those with small HOMO–LUMO energy gap. The oxidation and reduction potentials can be used to determine the HOMO, and LUMO energy levels and the potential difference can be used to estimate the energy gap Eg = HOMO − LUMO. The oxidation route corresponds to the removal of one electron from the HOMO molecular orbital so that the potential Eox at which oxidation reaction occurs in CV is directly correlated with the energy necessary to take away the electron from the molecule. In a similar way, reduction peak potentials are used to determine the energy level of LUMO, which is the energy necessary to accommodate an electron into a molecule. The determination of HOMO and LUMO energies from CV data can be calculated by the equation given by Bredas et al.63
| E(HOMO) = −((Eox)on + 4.4) eV |
| E(LUMO) = −((Ered)on + 4.4) eV |
The HOMO and LUMO energy levels of complex 1 were calculated from their corresponding oxidation and reduction potentials. The HOMO levels of complex 1 were estimated to be −4.83 eV and LUMO level were found to be −4.41 eV. Moreover, the electrochemical LUMO–HOMO energy gap was calculated to be 0.42 eV indicating the great intraligand charge transfer transition due to the presence of aromatic chromophore.64 The EHOMO and ELUMO values obtained from the CV measurements were comparable with the DFT results, depicted in Fig. 7.
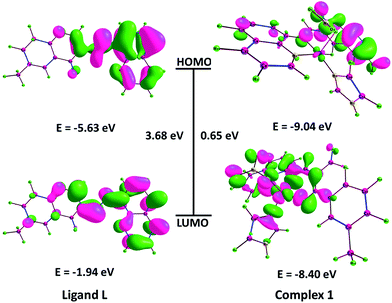 | ||
| Fig. 7 Isodensity surfaces for the MOs of ligand L and complex 1 were generated from the Kohn–Sham orbitals. | ||
The greater magnitude of binding of complex 1 in comparison to ligand L has been warranted by reviewing the effects of Frontier molecular orbital (HOMO and LUMO) analysis (Fig. 7) obtained from CV measurements and B3LYP/DFT calculations. Earlier literature reports have proven the fact that higher HOMO energy of DNA and lower LUMO energy of the interacting molecule reveal much stronger binding propensity, because “electronic charge cloud” transfers facilitate from the HOMO of the DNA molecule to the LUMO of the interacting molecule and accordingly, a stronger interaction between DNA and the interacting molecule takes place.35 Therefore, it was established that lower LUMO energy of the complex, greater would be the binding propensity and complex 1 has lower LUMO energy (−8.40 eV) as compared to ligand L (−1.94 eV).
Circular dichroic studies
The circular dichroism is a sensitive method to determine the conformational changes of the DNA helix and provides detailed information of the binding events with the target biomolecules (Fig. S17†). The CD spectrum of DNA exhibits characteristic B-type signature in the UV part of the spectra with a positive band due to base stacking at 276 nm (UV: λmax, 260 nm, CD [mdeg] 0.9602) and a negative band due to the right-handed helicity at 244 nm (CD [mdeg] −0.8893) of the B-DNA form (with a zero-crossover around 254 nm) and are reasonably sensitive to the mode of DNA interactions with small molecules. The CD spectrum of ligand L in the presence of DNA showed a slight change in the intensity of both negative (CD [mdeg] −0.794) as well as a positive band (CD [mdeg] 0.8833) of DNA with a slight red shift in both the bands. However, CD spectrum of complex 1 upon the addition of DNA, displayed marked decrease in intensity in both negative band (CD [mdeg] −0.3843) and positive band (CD [mdeg] 0.5785) with strong redshifts of 4–8 nm, respectively revealing strong interaction of complex 1 with DNA as compared to ligand L. The observed decrease in the positive bands of both L and 1 suggested that the complex could unwind the DNA helix and lead to loss of helicity65 which is attributed to conformational changes of B-DNA–A-DNA.66 These changes are by the above spectroscopic studies revealing the complex 1 interacts via groove binding mode.To elucidate the thermal profile of DNA in the absence and presence of ligand L and complex 1 variable temperature-dependent CD studies were undertaken at different wavelengths 276 and 244 nm. Intercalation of small molecules can stabilize the double helix structure causing an increase in the Tm by about 5–8 °C while groove binding and electrostatic binding cause less or no apparent increase in Tm. The value of Tm for DNA was determined by monitoring the changes in the CD spectra at 276 and 244 nm at a temperature ranging from 25 °C to 90 °C. For each transition, the value of Tm was determined as the transition midpoint of the melting curve. The melting point curves of DNA in the absence and presence of complex 1 were S-shaped.67 In the presence of complex 1, the Tm of DNA remarkably increased from 66.8 °C to ≈73 °C, respectively at both wavelengths 276 and 244 nm revealing the intercalative mode of binding.68 The observed results showed that complex 1 exhibited high thermal stability preferably stabilizing DNA more potently than ligand L at both wavelengths coincident with the results of UV-vis DNA melting temperature studies.69
DNA cleavage studies
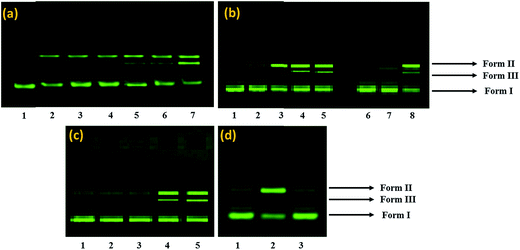
The DNA nuclease activity of complex 1 was examined by agarose gel electrophoresis using supercoiled pBR322 plasmid DNA as a substrate in a medium of 5 mM Tris–HCl/50 mM NaCl buffer, at pH 7.2. The activity of complex 1 was assessed by the conversion of DNA from Form I (supercoiled form) to Form II (nicked circular) and then to Form III (linear form). The concentration dependent DNA cleavage activity of complex 1 was observed by gel electrophoresis as shown in Fig. 8a. With the increase in the concentration of complex 1, the amount of Form I gradually diminished whereas Form II increased (Lane 2–7). However, at 30 μM concentration, complex 1 exhibited potent nuclease activity, and there was sufficient conversion of Form I into Form II with the appearance of Form III in between Form I and Form II (Lane 5–7) suggestive of double-strand cleavage.Many copper complexes have been proven to cleave DNA more efficiently in the presence of exogenous agents viz.; H2O2, ascorbate (Asc), 3-mercaptopropionic acid (MPA) and glutathione (GSH). As shown in Fig. 8b, the cleavage activity of 1 was significantly enhanced by these activators. Their activating efficacy follows the order H2O2 > MPA ≈ GSH > Asc.70
Mechanistic investigations were carried out using various additives to understand the nature of reactive oxygen species (ROS) such as hydroxyl radical scavengers (DMSO, tBuOH), singlet oxygen scavenger (NaN3) and a superoxide scavenger (SOD) involved in the DNA cleavage reactions Fig. 8c, The experimental results showed that the DNA breakdown mediated by 1 was clearly inhibited in the presence of DMSO and tert-butyl alcohol (Lane 2 and 3), indicating that the freely diffusible hydroxyl radical is one of the reactive species involved in the DNA strand scission. In contrast, the addition of NaN3 and SOD did not show significant quenching of the cleavage revealing that singlet oxygen and superoxide anion were not involved in the cleavage process (Lane 4 and 5). Since, the complex 1 was able to cleave DNA in the absence of any reducing agent, which implies that DNA might be cleaved by a discernible hydrolytic pathway. Hydrolytic pathways usually depend on the Lewis acidity of the central metal ion, which serves to activate the phosphodiester bonds towards nucleophilic attack via charge neutralization. Also, the presence of nitrate ion in the complex provides an inbuilt nucleophile in the complex 1, which attacks the phosphorus atom thereby leading to direct hydrolysis of the phosphodiester bonds.71 Complex 1 nitrate molecule, which facilitates the nucleophilic attack of nitrate oxygen to phosphorus, followed by a five-coordinate phosphate intermediate and subsequent rearrangement of the phosphate allows the DNA to be cleaved readily.
The potential interacting site of 1 with pBR322 DNA was further explored in the presence of the minor groove binding agent, distamycin (DIST) and the major groove binding agent, methyl green (MG). The supercoiled DNA was treated with DIST or methyl green prior to the addition of 1 (Fig. 8b), demonstrated that the DNA cleavage activity of 1 was inhibited in the presence of DIST while it remains unaffected in the presence of methyl green (Lane 7 and 8, Fig. 8b) indicating minor groove-binding propensity of the complex 1.
T4 DNA ligation experiment
The cleavage activity of complex 1 with pBR322 DNA demonstrated the hydrolytic mechanism of DNA scission. To further validate our results of cleavage activity, T4 ligase assay in the presence of complex 1 was carried out by gel electrophoresis. It is well known that in DNA hydrolytic cleavage 3′-OH and 5′-OPO3 (5′-OH and 3′-OPO3) fragments remain intact and that these fragments can be enzymatically ligated and end-labeled. In some cases, the hydrolytic products either did not end at the required 5′-phosphate and 3′-OH (ribose) termini or the complex sometimes bound to the termini of cleaved DNA.72 Complex 1 yielded linearized DNA which was relegated by using T4 ligase enzyme (Fig. 8d). In this study, DNA religation was complete, and after ligation, there was complete repair which was quantitatively ascertained by comparison of complex treated DNA and with the control DNA alone in supercoiled form. These results validate that the DNA cleavage mediated by complex 1 occurs via a hydrolytic pathway. Complex 1 could, therefore, be useful not only in drug design but also in revealing the specific role of metal ions in enzyme catalysis.73Molecular docking
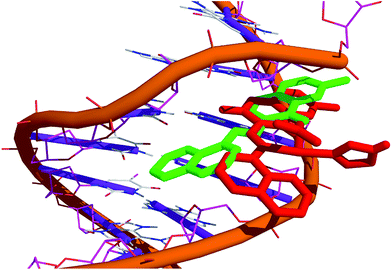
To account for the topology of target-specific binding between ligand L and complex 1 with DNA, blind molecular docking was carried out to mimic the interaction modes. In the present study, structures of the ligand L, complex 1 and DNA were kept flexible to attain different conformations to envisage the best minimum energy docked complex (L or 1 + DNA). The docking studies revealed that both the ligand and its copper complex 1 preferentially recognized minor groove regions in the double helical structure of the DNA. The binding of planar part of the coumarin pharmacophore ligand makes intimate interactions with the base-pair guanine residues (Gua10 and Gua16) of minor groove, and as a result of this interaction, plentiful non-covalent contacts (electrostatic and hydrogen bonding) occur between the L and DNA bases. While in the case of complex 1, the minimum energy docked pose revealed that the complex 1 remained in the minor groove, in close distance to the phosphate and the sugar groups and form electrostatic, hydrogen bonding and hydrophobic interactions with the cytosine and guanine (Cyt11, Gua10) residues along with the phosphate backbone (DG12, DC11), Table 3.| Name | Distance (Å) | Category | Type | Binding affinity (kcal mol−1) |
|---|---|---|---|---|
| Ligand L | ||||
| A:DG10:H22–:L:O | 2.04 | Hydrogen bond | Conventional | −5.3 |
| B:DG16:H3–:L:O | 2.67 | |||
| A:DG10:OP1–:L | 4.62 | Electrostatic | Pi-anion | |
![[thin space (1/6-em)]](https://www.rsc.org/images/entities/char_2009.gif) |
||||
| Complex 1 | ||||
| A:DG10:H22–1:O2 | 2.06 | Hydrogen bond | Conventional | −9.2 |
| A:DG10:H3–1:O1P | 2.06 | |||
| 1:N5–A:DC11:OP1 | 5.36 | Electrostatic | Attractive charge | |
| 1:N5–A:DG12:OP2 | 5.36 | |||
| 1–A:DC11 | 5.82 | Hydrophobic | Pi–pi stacked | |
The affinity of copper for the negatively charged phosphate groups present in the backbone of the DNA molecules restricts a deeper interaction of complex 1 in comparison to the ligand with the bases. Complex 1 links to O1P and O2P, interacts with the deoxyribose by means of attractive charge electrostatic interactions between the sugar group and N5 nitrogen atom of the complex 1.
Moreover, the smallest interatomic distance between the sugar-phosphate backbone and complex 1 is only 2.5–3.5 Å, could facilitate the nucleophilic attack on the phosphate group by nitrate ion, which support the hydrolytic DNA cleavage mechanism (Fig. 9).
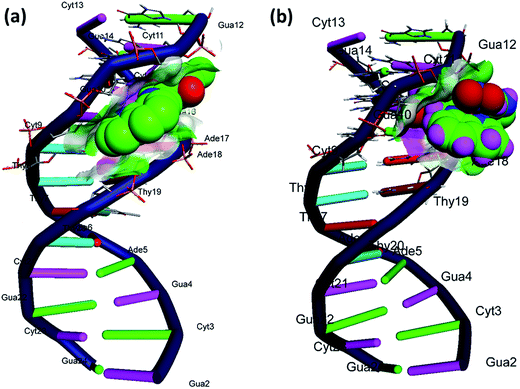 | ||
| Fig. 9 Molecular docked model of (a) ligand and (b) complex 1 with DNA [dodecamer duplex of sequence d(CGCGAATTCGCG)2 (PDB ID: 1BNA)]. | ||
The relative binding energy of the docked structures of L and 1 was found to be −5.3 kcal mol−1 and −9.2 kcal mol−1, respectively. Therefore, we can conclude that there is a good agreement between the experimental DNA binding/cleavage studies and computational studies (Fig. 10).
More importantly, our results suggest that the copper complex with aromatic coumarin ligand forming a partial-intercalation within the DNA bases along with the electrostatic mode of interaction with sugar-phosphate back bone of the DNA helix. This interaction mechanism need further exploration as the docking analysis has limitation, deal with the geometrical and energetics of the system, but dual binding mechanism especially partial-intercalation with electrostatic mode of interaction need the quantum mechanical treatment (QTAIM) for more clear explanation.74
In vitro anticancer studies
| Compounds | IC50 (μM) | Ref. |
|---|---|---|
| [Cu(4,7-dimethyl-phenanthroline)(glycinate)]NO3 | 6 | 76 |
| [Cu(HL1)Cl2] | 39 | 77 |
| [Cu(HL2)Cl2] | 9.9 | |
| [Cu2(heae)(tpa)]n·nH2O | 11.0 | 78 |
| [Cu(H2O)2(L1)(phen)](ClO4) | 16.42 | 79 |
| [Cu(H2O)(L2)(phen)](ClO4) | 5.82 | |
| Cu(quercetin)2(H2O)2 | 78.1 | 80 |
| Cisplatin | 57.7 | |
| Ligand (L) | 29.2 | This work |
| [Cu(L)(ImH)]NO3 | 4.6 | This work |
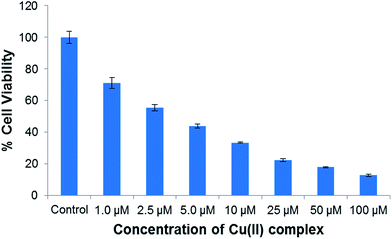
The perceptible changes in the morphology of A549 cells were observed of ligand and complex 1 to A549 cells, loss in normal morphology and cell adhesion capacity was evident as compared with control (Fig. 11).
 | ||
| Fig. 11 Morphological changes in A549 (human adenocarcinoma) cells upon exposure to copper(II) complex for 24 h. Images were collected by the help of phase contrast inverted microscope 20×. | ||
The results of both MTT (Table 4) and NRU assay showed the concentration-dependent pattern of the cytotoxicity of ligand and complex 1 against A549 cancer cell lines (Fig. 12) Furthermore, more experiments were carried out for the preliminary insight into the mechanistic pathways of cytotoxicity of complex 1 on A549 cancer cell viz., ROS generation, GSH depletion, LPO assay.
ROS generation
The anticancer activities of the copper complexes, in particular, is associated with their ability to create reactive oxygen species (ROS), viz. O2˙−, H2O2, and OH˙. In general, CuI ions reduces H2O2 to OH˙ whereas CuII ions may in order get reduced to CuI by O2˙− or glutathione. Thus, it is documented that the generation of ROS such as OH˙ is facilitated from copper, irrespective of the oxidation state in which it is introduced into the body firstly viz., CuI/CuII. The presence of surplus intracellular ROS could cause DNA damage in cells under oxidative stress and trigger various genes, enzymes and other signals which facilitate apoptosis in the cells.Thus to check the level of intracellular ROS generation is an important parameter to have a mechanistic clue for cytotoxicity. Therefore, we examined intracellular ROS generation in A549 lung cancer. The cells treated with the synthesized complex 1 exhibited significantly triggered ROS generation and followed a dose-dependent pattern as depicted from the Fig. S18.† Thus it endorses the production of ROS species and as a result confirms the role in cell apoptosis upon treatment of complex 1, which is in conformity with the previous literature that the anticancer property of copper complexes involves intracellular ROS species generation.
Glutathione depletion (GSH) assay
To evaluate the role of oxidative stress cytotoxicity, the CuII complex 1 will exhibit a substantial reduction in intracellular GSH levels. The GSH/GSSG ratio in a cancerous cell, shown to effect the cell cycle regulation, DNA synthesis, growth, and mutagenic mechanisms, etc. Glutathione (GSH), an intracellular antioxidant, it protects from oxidative stress inside the cells. In vivo, CuII gets reduced to CuI by interaction with O2˙−/GSH. The CuI ion enters the cell through a specific copper transporter (hCtr). This unique property of entering the cell enables copper compounds to inflow the cell surface without the need of other binding agents.It is known that in cancerous cells when compared with normal cells the level of GSH is usually higher. Thus, we have tested complex 1 for the potential of depletion of GSH level by treating it against A549 human lung cancer cell lines. The results are depicted in Fig. S19,† which showed a concomitant decrease in the level of GSH with an increase in the concentration of complex 1 (concentration dependent pattern). A noteworthy diminution in the level of GSH of ∼55% at a low concentration of 10 μM against A549 lung cancer cell line, confirms the role of oxidative stress.
Thiobarbituric acid reactive substance (TBARS) assay
The complex 1 was treated with A549 human lung cancer cell line for 24 h and the effect on lipid peroxidation was studied (Fig. S20†), using the thiobarbituric acid reactive substance (TBARS) assay. Upon treatment with varying concentration of complex 1 (1–10 μM) to A549 lung cancer cells, the results exhibited exponential increase and followed concentration dependent pattern. These findings suggested the accretion of ROS species in A549 cancer cells attributed to the redox changes offered by CuII complex, which inhibit the concentration of thiols/GSH but increases lipid oxidation. This will lead towards the damage to the organelles such as mitochondria and cause the death of the cell.Conclusions
Novel coumarin-appended copper(II) complex 1 was synthesized as potential antitumor chemotherapeutic agents and thoroughly characterized by single crystal X-ray diffraction analysis and other spectroscopic techniques. Furthermore, tentative assignment of biological relevant doming modes, assigned in the 35–150 cm−1, other out-of-plane and in-plane mode of vibrations in the range of 160–250 cm−1 and 260–700 cm−1, respectively. In vitro DNA binding profile of coumarin-appended copper(II) complex exhibited characteristic hyperchromic shift in UV-vis absorptions titrations with CT-DNA indicative of electrostatic binding mode of the cationic copper(II) site to the negatively charged oxygen atoms of sugar-phosphate backbone of the DNA double helix, in addition to the active participation of aromatic chromophores of coumarin appended ligand L via partial intercalation between adjacent base pairs of DNA double helix. The observed two-fold greater magnitude of binding of 1, as compared to L has been justified by the effects of lower LUMO energy of complex 1. The mechanistic pathway of cell death was studied by biological assays viz. pBR322 DNA cleavage, intracellular glutathione depletion and lipid peroxidation assays. The complex 1 demonstrates DNA cleavage via hydrolytic mechanism induced by reactive oxygen species (ROS) viz. OH˙. In vitro, cytotoxic activity revealed that the complex 1 exhibited significantly good activity for MCF-7 (breast cancer) and was moderately active on HepG2 (liver cancer) cell lines. Furthermore, on exposure of complex 1 to A549 human cancer cell line, ROS and Thiobarbituric Acid Reactive Substance (TBARS) levels were significantly increased which were coupled with the concomitant reduction of GSH levels. Thus, the results of in vitro biological assays validate that 1 could be safely utilized for specific targeted chemotherapeutic intervention, particularly in the case of A549 breast carcinomas and warrant further in vivo investigations.Acknowledgements
We gratefully acknowledge the DST-PURSE program, DST-FIST and DRS-1 (SAP) from UGC, New Delhi, India. Author M. Z. is highly thankful for SRF (Ext) from CSIR India. The authors extend their appreciation to the Deanship of Scientific Research at King Saud University for funding this work through research group no. RG-1438-006. Authors are thankful to the staff of IIT KANPUR for the assistance in Single Crystal X-ray studies.References
- J. Grau, R. F. Brissos, J. Salinas-Uber, A. B. Caballero, A. Caubet, O. Roubeau, L. Korrodi-Gregorio, R. Perez-Tomas and P. Gamez, Dalton Trans., 2015, 44, 16061–16072 RSC.
- D. Mahendiran, P. Gurumoorthy, K. Gunasekaran, R. S. Kumar and A. K. Rahiman, New J. Chem., 2015, 39, 7895–7911 RSC.
- M. Magnarin, A. Bergamo, M. E. Carotenuto, S. Zorzet and G. Sava, Anticancer Res., 2000, 20, 2939–2944 CAS.
- A. Paul, S. Anbu, G. Sharma, M. L. Kuznetsov, B. Koch, M. Fátima, C. G. da Silva and A. J. L. Pombeiro, Dalton Trans., 2015, 44, 19983–19996 RSC.
- D. G. Barceloux, J. Toxicol., Clin. Toxicol., 1999, 37, 217–230 CrossRef CAS PubMed.
- S. Ishida, F. McCormick, K. Smith-McCune and D. Hanahan, Cancer Cell, 2010, 17, 574–583 CrossRef CAS PubMed.
- S. Sarkar, T. Mukherjee, S. Sen, E. Zangrando and P. Chattopadhyay, J. Mol. Struct., 2010, 980, 117–123 CrossRef CAS.
- M. V. Blagosklonny, Drug Discovery Today, 2003, 8, 1104–1107 CrossRef CAS PubMed.
- P. J. Sadler, Dalton Trans., 2009, 10647 CAS.
- (a) B. D. Wang, Z. Y. Yang, P. Crewdson and D. Q. Wang, J. Inorg. Biochem., 2007, 101, 1492–1504 CrossRef CAS PubMed; (b) F. Arjmand and I. Yousuf, J. Organomet. Chem., 2013, 743, 55–62 CrossRef CAS.
- M. Frazzetto, C. Suphioglu, J. Zhu, O. Schmidt-Kittler, I. G. Jennings, S. L. Cranmer, S. P. Jackson, K. W. Kinzler, B. Vogelstein and P. E. Thompson, Biochem. J., 2008, 414, 383–390 CrossRef CAS PubMed.
- S. Singh, A. T. Baviskar, V. Jain, N. Mishra, U. C. Banerjee, P. V. Bharatam, K. Tikoo and M. P. S. Isha, MedChemComm, 2013, 4, 1257–1266 RSC.
- R. H. Erickson, K. J. Natalie, W. Bock, Z. Lu, F. Farzin, R. G. Sherrill, D. J. Meloni, R. J. Sherrill, D. J. Meloni, R. J. Patch, W. J. Rzesotarski, J. Clifton, M. J. Pontecorvo, M. A. Bailey, K. Naper and W. Karbon, J. Med. Chem., 1992, 35, 1526–1535 CrossRef CAS PubMed.
- F. Belluti, G. Fontana, L. Dal Bo, N. Carenini, C. Giommarelli and F. Zunino, Bioorg. Med. Chem., 2010, 18, 3543 CrossRef CAS PubMed.
- R. S. Hoult and M. Paya, Gen. Pharmacol., 1996, 27, 713 CrossRef PubMed.
- H. A. Stefani, K. Gueogjan, F. Manarin, S. H. P. Farsky, J. Zukerman-Schpector, I. Caracelli, S. R. P. Rodrigues, M. N. Muscara, S. A. Teixeira, J. R. Santin, I. D. Machado, S. M. Bolonheis, R. Curi and M. A. Vinolo, Eur. J. Med. Chem., 2012, 58, 117 CrossRef CAS PubMed.
- Y. Kashman, K. R. Gustafson, R. W. Fuller, J. H. Cardellina, J. B. McMahon, M. J. Currens, R. W. Buckheit, S. H. Hughes, G. M. Cragg and M. R. Boyd, J. Med. Chem., 1992, 35, 2739 CrossRef.
- M. Basanagouda, K. Shivashankar, M. V. Kulkarni, V. P. Rasal, H. Patel, S. S. Mutha and A. A. Mohite, Eur. J. Med. Chem., 2010, 45, 1151 CrossRef CAS PubMed.
- R. Deng, J. Wu and L. Long, Bull. Soc. Chim. Belg., 1992, 101, 439 CrossRef CAS.
- M. J. Matos, C. Teran, Y. Perez-Castillo, E. Uriarte, L. Santana and D. Vina, J. Med. Chem., 2011, 54, 7127 CrossRef CAS PubMed.
- R. Singh, M. Afzal, M. Zaki, M. Ahmad, S. Tabassum and P. K. Bharadwaj, RSC Adv., 2014, 4, 43504–43515 RSC.
- (a) B. M. Leu, M. Z. Zgierski, G. R. A. Wyllie, W. R. Scheidt, W. Sturhahn, E. E. Alp, S. M. Durbin and J. T. Sage, J. Am. Chem. Soc., 2004, 126, 4211 CrossRef CAS PubMed; (b) J. W. Pavlik, A. Barabanschikov, A. G. Oliver, E. E. Alp, W. Sturhahn, J. Zhao, J. T. Sage and W. R. Scheidt, Angew. Chem., Int. Ed., 2010, 49, 4400 CrossRef CAS PubMed.
- (a) A. Barabanschikov, A. Demidov, M. Kubo, P. M. Champion, J. T. Sage, J. Zhao, W. Sturhahn and E. E. Alp, J. Chem. Phys., 2011, 135, 015101 CrossRef PubMed; (b) B. M. Leu, M. Z. Zgierski, C. Bischoff, M. Li, M. Y. Hu, J. Zhao, S. W. Martin, E. E. Alp and W. R. Scheidt, Inorg. Chem., 2013, 52, 9948 CrossRef CAS PubMed; (c) H. Ogata, T. Kramer, H. Wang, D. Schilter, V. Pelmenschikov, M. van Gastel, F. Neese, T. B. Rauchfuss, L. B. Gee, A. D. Scott, Y. Yoda, Y. Tanaka, W. Lubitz and S. P. Cramer, Nat. Commun., 2015, 6, 1 Search PubMed.
- (a) S. Tabassum, M. Zaki, M. Afzal and F. Arjmand, Dalton Trans., 2013, 42, 10029 RSC; (b) S. Tabassum, M. Zaki, M. Afzal and F. Arjmand, Eur. J. Med. Chem., 2014, 74, 509–523 CrossRef CAS PubMed; (c) R. A. Khan, S. Yadav, Z. Hussain, F. Arjmand and S. Tabassum, Dalton Trans., 2014, 43, 2534 RSC.
- (a) F. Neese, Wiley Interdiscip. Rev.: Comput. Mol. Sci., 2012, 2, 73–78 CrossRef CAS; (b) F. Neese, Orca. An ab Initio, Density Functional and Semiempirical Program Package version, 2009 Search PubMed.
- C. Lee, W. Yang and R. G. Parr, Phys. Rev. B: Condens. Matter Mater. Phys., 1988, 37, 785–789 CrossRef CAS.
- (a) F. Weigend and R. Ahlrichs, Phys. Chem. Chem. Phys., 2005, 7, 3297–3305 RSC; (b) A. Schaefer, C. Huber and R. Ahlrichs, J. Chem. Phys., 1994, 100, 5829–5835 CrossRef CAS; (c) A. Schaefer, H. Horn and R. Ahlrichs, J. Chem. Phys., 1992, 97, 2571–2577 CrossRef CAS.
- (a) S. Grimme, J. Antony, S. Ehrlich and H. Krieg, J. Chem. Phys., 2010, 132 Search PubMed; (b) C. Steffen, K. Thomas, U. Huniar, A. Hellweg, O. Rubner and A. Schroer, J. Comput. Chem., 2010, 31, 2967–2970 CAS.
- (a) O. Trott and A. J. Olson, J. Comput. Chem., 2010, 31, 455–461 CAS; (b) M. F. Sanner, J. Mol. Graphics Modell., 1999, 17, 57–61 CAS.
- (a) Accelrys Software Inc., Discovery Studio Modeling Environment, Release 4.0, San Diego, Accelrys Software Inc., 2013 Search PubMed; (b) The PyMOL Molecular Graphics System, Version 1.5.0.4, Schrödinger, LLC Search PubMed.
- International Tables for X-ray Crystallography, ed. C. H. Macgillavry, G. D. Rieck and K. Lonsdale, Kynoch Press, Birmingham, England, 1952, vol. III, pp. 257–269 Search PubMed.
- SAINT, version 6.02, Bruker AXS, Madison, WI, 1999 Search PubMed.
- M. Sheldrick, SADABS, Empirical Absorption Correction Program, University of Göttingen, Göttingen, Germany, 1997 Search PubMed.
- XPREP, version 5.1, Siemens Industrial Automation Inc., Madison, WI, 1995 Search PubMed.
- G. M. Sheldrick, SHELXTL Version, 2016, http://shelx.uniac.gwdg.de/SHELX/index.php Search PubMed.
- (a) J. Marmur, J. Mol. Biol., 1961, 3, 208–218 CrossRef CAS; (b) M. E. Reicmann, S. A. Rice, C. A. Thomas and P. Doty, J. Am. Chem. Soc., 1954, 76, 3047–3053 CrossRef; (c) A. Wolfe, G. H. Shimer and T. Meehan, Biochemistry, 1987, 26, 6392–6396 CrossRef CAS PubMed; (d) J. R. Lakowicz and G. Weber, Biochemistry, 1973, 12, 4161–4170 CrossRef CAS PubMed.
- (a) F. Arjmand, M. Muddassir and R. H. Khan, Eur. J. Med. Chem., 2010, 45, 3549–3557 CrossRef CAS PubMed; (b) S. Yadav, I. Yousuf, M. Usman, M. Ahmad, F. Arjmand and S. Tabassum, RSC Adv., 2015, 5, 50673–50690 RSC.
- X. Q. Chen, X. Peng, J. Wang, Y. Wang, S. Wu, L. Zhang, T. Wu and Y. Wu, Eur. J. Inorg. Chem., 2007, 42, 5400–5407 CrossRef.
- (a) D. Chandra, K. V. Ramana, L. Wang, B. N. Christensen, A. Bhatnagar and S. K. Srivastava, Invest. Ophthalmol. Visual Sci., 2002, 43, 2285–2292 Search PubMed; (b) J. A. Buege and S. D. Aust, Methods Enzymol., 1978, 52, 302–310 CAS.
- M. A. Siddiqui, G. Singh, M. P. Kashyap, V. K. Khanna, S. Yadav, D. Chandra and A. B. Pant, Toxicol. In Vitro, 2008, 22, 1681–1688 CrossRef CAS PubMed.
- I. Yousuf, F. Arjmand, S. Tabassum, L. Toupet, R. A. Khan and M. A. Siddiqui, Dalton Trans., 2015, 44, 10330–10342 RSC.
- S. Tabassum, A. Asim, R. A. Khan, F. Arjmand, D. Rajakumar, P. Balaji and M. A. Akbarsha, RSC Adv., 2015, 5, 47439–47450 RSC.
- (a) R. A. Khan, S. Yadav, Z. Hussain, F. Arjmand and S. Tabassum, Dalton Trans., 2014, 43, 2534–2548 RSC; (b) R. A. Khan, A. de Almeida, K. Al-Farhan, A. Alsalme, A. Casini, M. Ghazzali and J. Reedijk, J. Inorg. Biochem., 2016, 165, 128–135 CrossRef CAS PubMed; (c) R. A. Khan, K. Al-Farhan, A. de Almeida, A. Alsalme, A. Casini, M. Ghazzali and J. Reedijk, J. Inorg. Biochem., 2014, 140, 1–5 CrossRef PubMed.
- J. Vicario, D. Aparicio and F. Palacios, J. Org. Chem., 2009, 74(1), 452–455 CrossRef CAS PubMed.
- R. Fernández de Luis, E. S. Larrea, J. Orive, L. Lezama and M. I. Arriortua, Inorg. Chem., 2016, 55, 11662–11675 CrossRef PubMed.
- D. C. Ilies, E. Pahontu, S. Shova, R. Georgescu, N. Stanica, R. Olar, A. Gulea and T. Rosu, Polyhedron, 2014, 81, 123–131 CrossRef CAS.
- M. K. Paira, J. Dinda, T. H. Lu, A. R. Paital and C. Sinha, Polyhedron, 2007, 26, 4131–4140 CrossRef CAS.
- V. Selvarani, B. Annaraj, M. A. Neelakantan, S. Sundaramoorthy and D. Velmurugan, Polyhedron, 2013, 54, 74–83 CrossRef CAS.
- M. Usman, F. Arjmand, M. Ahmad, M. S. Khan, I. Ahmad and S. Tabassum, Inorg. Chim. Acta, 2016, 453, 193–201 CrossRef CAS.
- D. N. Kumar, B. K. Singh, B. S. Garg and P. K. Singh, Spectrochim. Acta, Part A, 2003, 59, 1487–1496 CrossRef.
- F. Arjmand, S. Sharma, M. Usman, B. M. Leu, M. Y. Hu, L. Toupet, D. Gosztola and S. Tabassum, Phys. Chem. Chem. Phys., 2016, 18, 17805–17809 RSC.
- V. A. Kawade, A. A. Kumbhar, A. S. Kumbhar, C. Nather, A. Erxleben, U. B. Sonawane and R. R. Joshi, Dalton Trans., 2011, 40, 639–650 RSC.
- (a) V. G. Vaidyanathan and B. U. Nair, J. Inorg. Biochem., 2002, 91, 405–412 CrossRef CAS PubMed; (b) T. Nandhini, K. R. Anju, V. M. Manikandamathavan, V. G. Vaidyanathan and B. U. Nair, Dalton Trans., 2015, 44, 9044–9051 RSC.
- J. Li, B. Li, Y. Wu, S. Shuang, C. Dong and M. M. F. Choi, Spectrochim. Acta, Part A, 2012, 95, 80 CrossRef CAS PubMed.
- P. Vijayan, P. Viswanathamurthi, P. Sugumar, M. N. Ponnuswamy, M. D. Balakumaran, P. T. Kalaichelvan, K. Velmurugan, R. Nandhakumard and R. J. Butchere, Inorg. Chem. Front., 2015, 2, 620–639 RSC.
- S. Niroomand, M. Khorasani-Motlagh, M. Noroozifar and A. Moodi, J. Photochem. Photobiol., B, 2012, 117, 132–139 CrossRef CAS PubMed.
- (a) M. Muralisankar, N. S. P. Bhuvaneshb and A. Sreekanth, New J. Chem., 2016, 40, 2661–2679 RSC; (b) C. K. Baig and J. Duhamel, J. Phys. Chem. B, 2010, 114, 13950–13960 CrossRef CAS PubMed.
- J.-L. Li, L. Jiang, B. W. Wang, J. L. Tian, W. Gu, X. Liu and S. P. Yan, New J. Chem., 2015, 39, 529–538 RSC.
- M. Cory, D. D. McKee, J. Kagan, D. W. Henry and J. A. Miller, J. Am. Chem. Soc., 1985, 107, 2528–2536 CrossRef CAS.
- Q. Gana, C. L. Zhanga, B. F. Wang, Y. H. Xiong, Y. L. Fu, Z. W. Mao and X. Y. Le, RSC Adv., 2016, 6, 35952–35965 RSC.
- S. Ambika, S. Arunachalam, R. Arun and K. Premkumar, RSC Adv., 2013, 3, 16456–16468 RSC.
- (a) I. Pradeep, S. Megarajan, S. Arunachalam, R. Dhivya, A. Vinothkanna, M. A. Akbarsha and S. Sekar, New J. Chem., 2014, 38, 4204–4211 RSC; (b) M. S. Ibrahim, Anal. Chim. Acta, 2001, 443, 63–72 CrossRef CAS.
- (a) A. R. Freitas, M. Silva, M. L. Ramos, L. L. G. Justino, S. M. Fonseca, M. M. Barsan, C. M. A. Brett, M. R. Silva and H. D. Burrows, Dalton Trans., 2015, 44, 11491–11503 RSC; (b) J. L. Bredas, R. Silbey, D. S. Boudreux and R. R. Chance, J. Am. Chem. Soc., 1983, 105, 6555–6559 CrossRef CAS.
- Y. Yang, F. Liu, H. Wang, M. Zhang, H. Xu, S. Bo, J. Liu, L. Qiu, Z. Zhen and X. Liu, Phys. Chem. Chem. Phys., 2014, 16, 20209–20215 RSC.
- K. Karidi, A. Garoufis, N. Hadjiliadis and J. Reedijk, Dalton Trans., 2005, 728–734 RSC.
- (a) F. Arjmand, S. Parveen and D. K. Mohapatra, Inorg. Chim. Acta, 2012, 388, 1–10 CrossRef CAS; (b) J. P. Macquet and J. L. Butour, Eur. J. Biochem., 1978, 83, 375–387 CrossRef CAS PubMed.
- M. Airoldi, C. A. Boicelli, G. Gennaro, M. Giomini, A. M. Giuliani and M. Giustini, Phys. Chem. Chem. Phys., 2000, 2, 4636–4641 RSC.
- H. Fujita, Y. Imaizumi, Y. Kasahara, S. Kitadume, H. Ozaki, M. Kuwahara and N. Sugimoto, Pharmaceuticals, 2013, 6, 1082–1093 CrossRef CAS PubMed.
- (a) B. Maji, S. K. Samanta and S. Bhattacharya, Nanoscale, 2014, 6, 3721–3730 RSC; (b) N. Narayanaswamy, G. Suresh, U. D. Priyakumar and T. Govindaraju, Chem. Commun., 2015, 51, 5493–5496 RSC.
- A. Mazumder, C. L. Sutton and D. S. Sigman, Inorg. Chem., 1993, 32, 3516–3520 CrossRef CAS.
- F. Mancin, P. Scrimin, P. Tecillab and U. Tonellato, Chem. Commun., 2005, 2540–2548 RSC.
- M. E. Branum, A. K. Tipton, S. Zhu and L. Que Jr, J. Am. Chem. Soc., 2001, 123, 1898–1904 CrossRef CAS PubMed.
- (a) D. Mandal, M. Chauhan, F. Arjmand, G. Aromi and D. Ray, Dalton Trans., 2009, 9183–9191 RSC; (b) A. Sarkar, A. R. Paital, R. A. Khan, F. Arjmand, V. Bertolasi, C. Mathoniere, R. Clérac and D. Ray, Dalton Trans., 2013, 42, 12495–12506 RSC.
- R. G. Murillo, L. R. Azuara, R. M. Esparza and F. C. Guzman, Phys. Chem. Chem. Phys., 2012, 14, 15539–15546 RSC.
- World Cancer Report 2014, World Health Organization, 2014, ch. 5.1, ISBN 9283204298 Search PubMed.
- R. Kachadourian, H. M. Brechbuhl, L. R. Azuara, I. G. Mora and B. J. Day, Toxicology, 2010, 268, 176–183 CrossRef CAS PubMed.
- M. F. Primik, G. Muhlgassner, M. A. Jakupec, O. Zava, P. J. Dyson, V. B. Arion and B. K. Keppler, Inorg. Chem., 2010, 49, 302–311 CrossRef CAS PubMed.
- F. H. He, M. Jiang, Y. T. Li, Z. Y. Wu and C. W. Yan, J. Inorg. Organomet. Polym., 2012, 22, 756–765 CrossRef CAS.
- L. V. Tamayo, L. R. Gouvea, A. C. Sousa, R. M. Albuquerque, S. F. Teixeira, R. A. de Azevedo, S. R. W. Louro, A. K. Ferreira and H. Beraldo, BioMetals, 2016, 29, 39–52 CrossRef CAS PubMed.
- J. Tan, B. Wang and L. Zhu, J. Biol. Inorg Chem., 2009, 14, 727–739 CrossRef CAS PubMed.
Footnote |
| † Electronic supplementary information (ESI) available. CCDC 1452079. For ESI and crystallographic data in CIF or other electronic format see DOI: 10.1039/c7ra05874h |
| This journal is © The Royal Society of Chemistry 2017 |

