 Open Access Article
Creative Commons Attribution 3.0 Unported Licence
Magnetic nanoparticle modified chitosan for surface enhanced laser desorption/ionization mass spectrometry of surfactants†
Hani Nasser Abdelhamidab,
Yu Chih Lina and
Hui-Fen Wu *acde
*acde
aDepartment of Chemistry, National Sun Yat-Sen University, Kaohsiung, 804, Taiwan. E-mail: hwu@faculty.nsysu.edu.tw; Fax: +886-7-525-3908; Tel: +886-7-525-2000 ext. 3955
bDepartment of Chemistry, Assuit University, Assuit, 71515, Egypt
cSchool of Pharmacy, College of Pharmacy, Kaohsiung Medical University, Kaohsiung, 800, Taiwan
dInstitute of Medical Science and Technology, National Sun Yat-Sen University, Kaohsiung, 804, Taiwan
eDoctoral Degree Program in Marine Biotechnology, National Sun Yat-Sen University and Academia Sinica, Kaohsiung, 80424, Taiwan
First published on 25th August 2017
Abstract
Chitosan (CTS) modified magnetic nanoparticles (CTS@Fe3O4 MNPs) offer dual functions for the detection of surfactants using surface enhanced laser desorption/ionization mass spectrometry (SELDI-MS). The characterization of CTS@Fe3O4 MNPs is carried out using X-ray diffraction, Fourier transform infrared spectroscopy, transmission electron microscopy, and UV-vis absorption. CTS@Fe3O4 magnetic nanoparticles offer a simple separation method for surfactants. CTS@Fe3O4 MNPs show an absorption band at 337 nm that matches the laser wavelength of the N2 laser. The material provides dual functionalities; as a probe and for surface enhanced LDI-MS. Analysis of surfactants using CTS@Fe3O4 MNPs shows a remarkable limit of detection, offers high throughput analysis and fast separation (<5 min). Compared to a conventional organic matrix (2,5-DHB), the spectra obtained using CTS@Fe3O4 MNPs are interference-free. The interactions of the surfactants and CTS@Fe3O4 MNPs are also investigated using FTIR and UV-vis absorption.
Introduction
Surfactants are widely used in many fields such as household detergents, hospitals, consumer products, capping agents for the synthesis of nanoparticles, natural dispersants (biosurfactants) that emulsify oil in water1 and clinical formulations.2 Several million tons of surfactants are produced every year. Over one million tons of anionic surfactants are being disposed of down the drain annually in the US alone.3 Surfactants interact with DNA,4 humic acids,5 the outer membrane of bacterial cells6 and other biomolecules. It was reported that the ecotoxicity of hospital wastewater identified detergents and disinfectants as the main causes of toxicity.7 Surfactants as capping agents of nanoparticles affect their cytotoxicities against human skin keratinocytes (HaCaT) and blood T lymphocytes (TIB-152).8 Thus, the detection or determination of these species are paramount important for human being. Concentration or distribution of surfactants have been followed using liquid chromatography mass spectrometry (LC/MS/MS),3 methylene blue active substances (MBAS),9 capillary electrophoresis,10 and others.11 However, these methods require tedious procedures, show signal instability as well as requiring the use of large amounts of chlorinated solvents that are not readily biodegradable.Matrix assisted laser desorption/ionization mass spectrometry (MALDI-MS) is a common analytical tool for the analysis of non-volatile compounds.12–16 It has been applied for the analysis of analytes such as proteins and their interactions,15,17,18 bacterial cells,19–22 fungi,23 metals,24,25 and others.26,27 Surprisingly, very few studies are available for the detection of surfactants using MALDI-MS.28 There are many challenges for the analysis of these species using conventional MALDI-MS. First, surfactants have small molecules and usually they undergo ion suppression due to the ions peaks of conventional organic matrices. Second, traditional organic matrices produce many interferences peaks.29 Third, surfactants are present in low concentration and that require a preconcentration step.3
Magnetite nanoparticles (e.g. iron oxide (Fe3O4) MNPs) is a cubic inverse spinel structure with oxygen forming face centered cubic (fcc) close packing and Fe cations occupying interstitial tetrahedral sites and octahedral sites.30 Magnetic nanoparticles have been applied for biomedicine,31 catalysis,32–34 biotechnology included protein purification, drug delivery, medical imaging,35 environmental applications36 and as platforms for detection and separation applications.37,38 Magnetic nanoparticles and their modification were applied as adsorbent for removing methyl orange (MO, using chitosan/Al2O3/magnetic iron oxide nanoparticle),39 for the removal of Hg(II),40 aflatoxins,41 antidepressant drugs,42 endocrine-disrupting phenols43 and others.44,45 It has been applied to separate and enrichment of analytes; such as glycoproteins,46 phosphopeptides,47 endotoxins,48 biothiols,49 pathogenic bacteria50 and others.51–53 Magnetic nanoparticles were used as probe for separation and enrichment of analytes. To the best of our knowledge, the preconcentration of surfactants using magnetic nanoparticles and MALDI-MS is not reported.
Herein, chitosan (CTS) modified magnetic nanoparticles (CTS@Fe3O4 MNPs) was synthesized, characterized and applied as probe for the preconcentration of surfactants. CTS@Fe3O4 MNPs was synthesized in basic medium using hydrothermal method. The synthesized nanoparticles were characterized using transmission electron microscopy (TEM), Fourier transform infrared (FTIR), X-ray diffraction (XRD), and UV-vis absorption. The particle size is less than 10 nm. FTIR spectrum confirms the surface modification of Fe3O4 MNPs using chitosan. CTS@Fe3O4 MNPs displays UV band absorption at 337 nm that matches with the N2 laser. Thus, CTS@Fe3O4 MNPs offers potential application for surface enhanced laser desorption/ionization mass spectrometry (SELDI-MS). CTS@Fe3O4 MNPs put forward multi-functional applications; probe for pre-concentration, matrix and surface for SELDI-MS.
Materials and methods
Chitosan (molecular weight > 75![[thin space (1/6-em)]](https://www.rsc.org/images/entities/char_2009.gif) 000 g mol−1, deacetylated > 75%) was purchased from J.T. Baker (India). 2,5-DHB (2,5-dihydroxybenzoic acid) was purchased from Alfa Aeser (Great Britain). Cetyltrimethyl ammonium bromide (CTAB), cetylpyridinium chloride monohydrates (CPC), sodium dodecyl benzene sulfonate (SDBS), and sodium stearate (SS), were purchased from Sigma Aldrich (USA). The de-ionized water obtained from Milli-Q Plus water purification system (Millipore, Bedford, MA, USA) was used for all experiments.
000 g mol−1, deacetylated > 75%) was purchased from J.T. Baker (India). 2,5-DHB (2,5-dihydroxybenzoic acid) was purchased from Alfa Aeser (Great Britain). Cetyltrimethyl ammonium bromide (CTAB), cetylpyridinium chloride monohydrates (CPC), sodium dodecyl benzene sulfonate (SDBS), and sodium stearate (SS), were purchased from Sigma Aldrich (USA). The de-ionized water obtained from Milli-Q Plus water purification system (Millipore, Bedford, MA, USA) was used for all experiments.
Synthesis of chitosan modified magnetic nanoparticles (CTS@Fe3O4 MNPs)
Chitosan modified magnetic nanoparticles (CTS@Fe3O4 MNPs) was synthesized using one pot method.54 Mixture of FeCl2·4H2O (0.63 g), and FeCl3·6H2O (1.73 g) were mixed into chitosan solution (0.2 g, 25 mL H2O, 1 mL acetic acid). The mixture was stirred for 12 h at room temperature. The pH of the solution was adjusted to 9 using NH4OH and was purged with nitrogen. The mixture was stirred in water bath at 90 °C for 3 h. The precipitate was separated by external magnets and exhaustively washed with water (2 × 30 mL).Instruments
UV-vis absorption measurements of chitosan modified magnetic nanoparticles before and after interaction with surfactants were undertaken in a UV spectrophotometer (Perkin Elmer 100, Germany). Fourier transform infrared (FT-IR) spectra of chitosan modified magnetic nanoparticles before and after interaction with surfactants were recorded on FT-IR spectrometer (Spectrum 100, Perkin Elmer, USA). The particle size distributions of nanoparticles were determined using transmission electron microscope (TEM, JEOL-301, Tokyo, Japan). Matrix assisted laser desorption/ionization time of flight mass spectrometry (MALDI-TOF-MS) analysis were performed by employing positive mode on a time of flight mass spectrometer (Microflex, Daltonics Bruker, Bremen, Germany) with 1.25 m flight tube. Laser desorption/ionization mass spectrometry (LDI-MS) was obtained using 337 nm nitrogen laser with 3 ns pulse width. The accelerating potential in the source was maintained at +20 kV. The laser power was adjusted to slightly above the ionization threshold to obtain good resolution and signal to noise ratios. The spectra were calibrated using DHB peaks (molecular weight is 154 g mol−1, [DHB + Na]+ at 177 Da and [DHB–H2O + H]+ at 137 Da). The experiments were repeated at least three times to confirm reproducibility. X-ray diffraction (XRD) was recorded using X-ray diffractometer (XRD, Philips, The Netherlands).Separation and preconcentration of surfactants
Standard solution of surfactants; called cetyltrimethyl ammonium bromide (CTAB, 1 mM), cetylpyridinium chloride monohydrate (CPC, 1 mM), sodium dodecyl benzenesulfonate (SDBS, 1 mM), and sodium stearate (SS, 1 mM), were prepared in de-ionized water. Then, CTS@Fe3O4 magnetic nanoparticles (10 μL, 1 mg mL−1) were added to each solution of surfactant. The magnetic nanoparticles containing the surfactants were separated using external magnet. The separated species was re-dispersed in deionized water. Then, 2 μL was spotted to MALDI plate for analysis.Another 5 μL of the separated species was also mixed with 5 μL of DHB matrix solution (50 mM, 50![[thin space (1/6-em)]](https://www.rsc.org/images/entities/char_2009.gif) :
:![[thin space (1/6-em)]](https://www.rsc.org/images/entities/char_2009.gif) 50 methanol
50 methanol![[thin space (1/6-em)]](https://www.rsc.org/images/entities/char_2009.gif) :
:![[thin space (1/6-em)]](https://www.rsc.org/images/entities/char_2009.gif) water (vol/vol)). Then, 2 μL of the mixed solution was spotted in MALDI plate and leaved at room temperature for drying. Tape water was spiked with the surfactants and was analyzed suing the same protocol as mentioned above.
water (vol/vol)). Then, 2 μL of the mixed solution was spotted in MALDI plate and leaved at room temperature for drying. Tape water was spiked with the surfactants and was analyzed suing the same protocol as mentioned above.
Results and discussion
Material characterization
Magnetic nanoparticles modified with chitosan (CTS@Fe3O4 MNPs) are prepared by coordination of Fe2+ and Fe3+ ions in the backbone of chitosan before co-precipitation in basic medium. Chitosan function groups such as hydroxyl are important and can coordinate to the transition metal ions. Black magnetic nanoparticles are formed in basic solution under hydrothermal condition. Since the separation take placed using magnetic field, free chitosan would remain dispersed in the discarded aqueous phase and only that attached to the magnetic nanoparticles would appear in the final product. This method allows the collection of coated nanoparticles without free chitosan. The material is characterized using TEM (Fig. 1a), FTIR (Fig. 1b), UV-vis absorption (Fig. 1c), and XRD (Fig. 1d). TEM image of CTS@Fe3O4 MNPs shows that magnetic nanoparticles embedded in the backbone of chitosan (Fig. 1a). Data show that the mean diameters ranging from 10 to 30 nm. The interaction between chitosan and the surface of Fe3O4 MNPs is accomplished using FTIR spectra (Fig. 1b). The interaction takes place in many ways and is mainly based on dipole–dipole, hydrogen bond, or van der Waals interactions. The two bands at 2922 and 2850 cm−1 are attributed to the asymmetric of the methylene chains (–CH2–) stretch and the symmetric C–H stretch, respectively. The characteristic absorption bands for chitosan backbone was observed at 3450 (O–H stretching vibrations, a broad band), and a group of bands from 1100 to 1020 cm−1 (C–O–C and C–O stretching vibrations). The peak at 1660 cm−1 refers to C![[double bond, length as m-dash]](https://www.rsc.org/images/entities/char_e001.gif) O. UV-vis absorption of CTS@Fe3O4 MNPs was reported as shown in Fig. 1c. CTS@Fe3O4 MNPs displays absorption at 337 nm that matches with the wavelength of N2 laser of matrix assisted laser desorption/ionization mass spectrometry (MALDI-MS). XRD pattern shows good agreement of the experimental pattern with the simulated diffraction pattern (Fig. 1d). The patterns show no change after modification with chitosan (Fig. 1d).
O. UV-vis absorption of CTS@Fe3O4 MNPs was reported as shown in Fig. 1c. CTS@Fe3O4 MNPs displays absorption at 337 nm that matches with the wavelength of N2 laser of matrix assisted laser desorption/ionization mass spectrometry (MALDI-MS). XRD pattern shows good agreement of the experimental pattern with the simulated diffraction pattern (Fig. 1d). The patterns show no change after modification with chitosan (Fig. 1d).
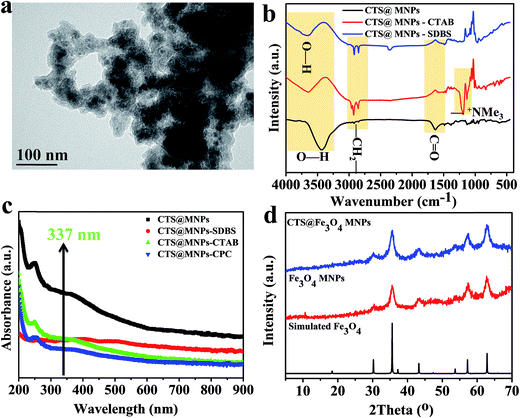 | ||
| Fig. 1 Characterization of CTS@Fe3O4 MNPs using (a) TEM monograph, (b) FTIR and (c) UV-vis absorption and (d) XRD. | ||
Principal of separation and detection of surfactants
The synergic effect of the large surface area and the absorption at 337 nm (Fig. 1c) of CTS@Fe3O4 MNPs reveal the promising applicability for SELDI-MS. Due to these two features i.e. absorption and large surface area, this technique can be coined as surface enhanced laser desorption/ionization mass spectrometry (SELDI-MS). Magnetic nanoparticles provide a simple probe for separation of target analytes.39–50 This character is highly required for preconcentration of the investigated analytes due to low concentration. In order to apply magnetic nanoparticles for species such as surfactants, the surface was modified with chitosan. General representation of the separation and detection of surfactants, called cetyltrimethyl ammonium bromide (CTAB), cetylpyridinium chloride monohydrate (CPC), sodium dodecyl benzenesulfonate (SDBS), and sodium stearate (SS), is presented in Fig. 2. CTS@Fe3O4 MNPs is added to the solution of the investigated surfactants. After few minutes (<5 min), external magnetic attracts the magnetic nanoparticles that have the target species. The separated particles are then deposited directly or after dispersion with a solution of conventional matrix “2,5-DHB”. The spots were desorbed and ionized using laser shots (337 nm). The chemical formula and the molecular weights of the investigated species are drawn as shown in Fig. S1.† The investigated species are small molecules with molecular weight less than 500 Da.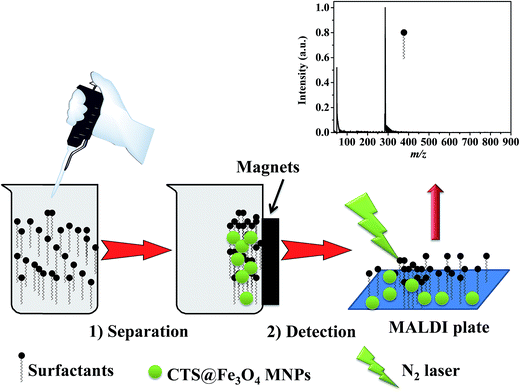 | ||
| Fig. 2 Schematic representation of preconcentration of aqueous surfactants using CTS@Fe3O4 MNPs prior to analysis using SELDI-MS. | ||
Comparison of conventional organic matrix (MALDI-MS, 2,5-DHB) and CTS@Fe3O4 MNPs (SELDI-MS)
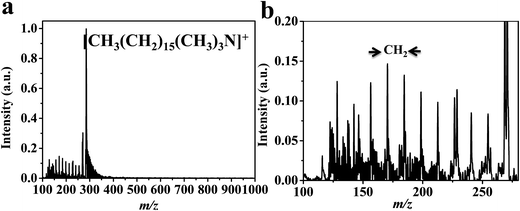
Laser desorption/ionization mass spectrometry (LDI-MS) is limited to analytes species that have absorption of laser energy. LDI-MS show no applicability for surfactants due to the absence of laser absorption. Thus, organic matrix such as 2,5-DHB is applied to the investigated analytes. However, self-ionization of the conventional matrix cause ion-suppression and their peaks complicate the spectrum. Hexadecyltrimethylammonium bromide (cetrimonium bromide) using DHB (Fig. 3) and CTS@Fe3O4 MNPs (Fig. 4) are compared. Spectra (Fig. 3, and 4) show peak at 285 (m/z) corresponding to [CH3(CH2)15(CH3)3N]+. CTS@Fe3O4 MNPs (Fig. 4) shows no interference peaks compared to 2,5-DHB (Fig. 3). There is no observable peak related to chitosan backbone. Furthermore, CTS@Fe3O4 MNPs (Fig. 4) offers low limit of detection (LOD, 10 fmole) that is higher than sensitivity of 2,5-DHB (100 fmole, Fig. 3). The spectrum (Fig. 3b) shows peak at m/z 137 that assign as [DHB–H2O + H]+. Zoom in the spectra of 2,5-DHB (Fig. 3b) and CTS@Fe3O4 MNPs (Fig. 4b) show the degradation of the parent ion. The spectra show peak with difference equal to 14 Da corresponding to –CH2– groups (Fig. 3b and 4b). It was found that the detection of CTAB is useful method for internalization of nanoparticles into cells.55 Thus, the current protocol is promising for further applications in cells analysis.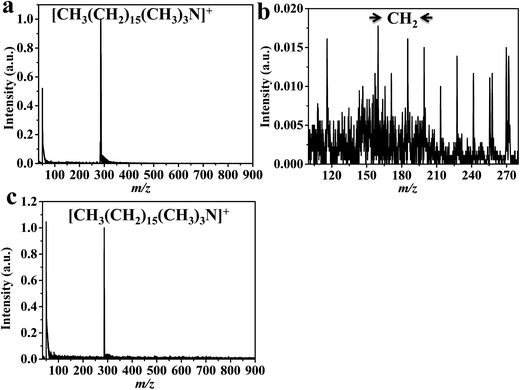 | ||
| Fig. 4 SELDI-MS analysis of CTAB using CTS@Fe3O4 MNPs; (a) from deionized water and (b) represent the magnification of the spectrum in the range of 100–280 Da, and (c) the analysis of tape water. | ||
Sensitivity of CTS@Fe3O4 MNPs for cationic and anionic surfactants
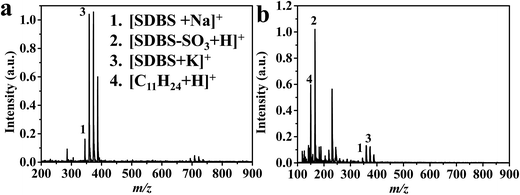
CTS@Fe3O4 MNPs has been applied for cetylpyridinium chloride monohydrate (CPC, Fig. 5), sodium dodecyl benzenesulfonate (SDBS, Fig. 6), and sodium stearate (SS, Fig. S2†). Spectrum of cetylpyridinium chloride monohydrate (CPC, Fig. 5) shows peak at m/z 305 corresponding to [CPC–Cl–H2O + H]+. The spectrum (Fig. 5b) shows also peak at m/z 610 that is assigned as [2CPC + H]+. This peak indicates that laser desorption/ionization using CTS@Fe3O4 MNPs is soft ionization method. Similar to CTAB (Fig. 4), CPC (Fig. 5) shows methylene groups (–CH2–, 14 Da) in the low mass range (50–280 Da). The peak of the parent ion ([CPC–Cl–H2O + H]+) is shown in Fig. 5c. This peak confirms absence of chloride isotopes (35Cl (75.78%) and 37Cl (24.22%)). Sodium dodecylbenzenesulfonate (SDBS, Fig. 6) shows peaks at m/z 348, 233, 364, 156 Da corresponding to [SDBS + Na]+, [SDBS–SO3 + H]+, [SDBS + K]+ and [C11H24]+, respectively. Spectrum of sodium stearate (SS, Fig. S2†) shows peaks at 306 and 322 Da that are assigned as [SS + Na]+ and [SS + Na]+, respectively.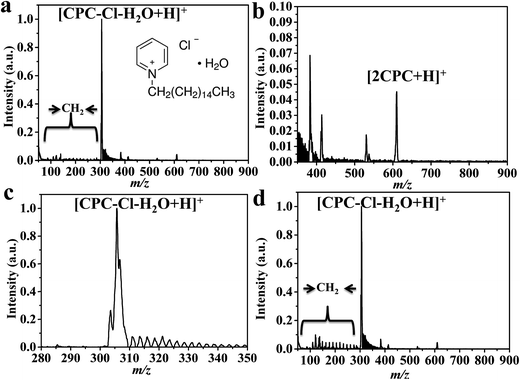 | ||
| Fig. 5 SELDI-MS analysis of (a) CPC using CTS@Fe3O4 MNPs; (b) magnification of the mass range of 350–900 Da, (c) the peak shape of the parent peak and (d) analysis of tape water. | ||
The mean concentrations of surfactants in tape water is very low.3 However, these low concentration can efficiently kill Gram-negative E. coli with a very low minimum inhibitory concentration (1.70–0.93 μM).6 The lowest observed effective concentration of cetylpyridinium chloride (CPC) was 1.5 μM.56 The limit of detection (LOD) using 2,5-DHB and CTS@Fe3O4 MNPs is 200 fmole and 50 fmole, respectively. The limit of detection for sodium dodecyl benzenesulfonate (SDBS, Fig. 6), and sodium stearate (SS, Fig. S2†) using CTS@Fe3O4 MNPs is 10 fmole and 20 fmole, respectively. These data indicate that the preconcentration of these species using CTS@Fe3O4 MNPs is a sensitive approach. The separation takes place in few minutes (<5 min) and requires simple external magnets. CTS@Fe3O4 MNPs offers dual functions; probe for preconcentration and surface with special features (absorbance and large surface area). CTS@Fe3O4 MNPs has large surface area and display absorption matches with the wavelength of N2 laser. These two features provide application for surface enhanced laser desorption ionization mass spectrometry (SELDI-MS). Thus, it provides low limit of detection, few interferences, higher resolution, and low fragmentations. These observations are confirmed from the analysis of tape water for CTAB (Fig. 4c) and CPC (Fig. 5d). The spectra show no background and display high resolutions.
Selectivity and tape water analysis
For real sample measurements, the four surfactants were mixed together in the tape water. They were mixed with the same concentration. Then, CTS@Fe3O4 MNPs were applied to extract the species as the same for the standard samples (vide supra). Conventional matrix (2,5-DHB, Fig. S3†) and CTS@Fe3O4 MNPs (Fig. S4†) are compared. The spectra show mainly the peaks of CTAB ions. This may be because the high ionizability of this analytes compared to the other species. Conventional matrix (2,5-DHB, Fig. S3†) shows peak at m/z 137 that assign as [DHB–H2O + H]+. In contrast, CTS@Fe3O4 MNPs (Fig. S4†) shows no interferences. It is also show higher resolution and very few fragmentation compared to conventional matrix i.e. 2,5-DHB. The limit of detection using 2,5-DHB and CTS@Fe3O4 MNPs is 100 fmole and 200 fmole, respectively. The data indicate the high reproducibility of our method.Analysis of the interactions of surfactants and CTS@Fe3O4 MNPs
The surface of magnetite NP's surface is either be O-rich or Fe-rich depending on the NP size. The presence of hydroxyl groups facilitates the modification of magnetic nanoparticles with chitosan. The functions groups of surface biomolecules i.e. chitosan are hydroxyl (–OH), carbonyl (C![[double bond, length as m-dash]](https://www.rsc.org/images/entities/char_e001.gif) O), carboxylic (–COO−) and ammonium (–+NH3). These groups assist the interaction of chitosan backbone with the target analytes such as surfactants. The interactions among CTS@Fe3O4 MNPs and surfactants are evaluated using FTIR (Fig. 1b) and UV-vis absorption (Fig. 1c).
O), carboxylic (–COO−) and ammonium (–+NH3). These groups assist the interaction of chitosan backbone with the target analytes such as surfactants. The interactions among CTS@Fe3O4 MNPs and surfactants are evaluated using FTIR (Fig. 1b) and UV-vis absorption (Fig. 1c).
The interactions between CTS@Fe3O4 MNPs surface and surfactants occur in many ways. The types of these interactions are mainly based on dipole–dipole, hydrogen bond, or van der Waals interactions. The two bands at 2922 and 2852 cm−1 are attributed to the asymmetric –CH2– stretch and the symmetric CH stretch, respectively. These two peaks become sharp after the interaction with the investigated surfactants. These observations reveal the van der Waals interactions. The broad band at 1639 cm−1 is characteristic of the ν(COO−). We didn't observe peaks related to –NH bending modes or any –NH2 wagging vibrations at 787 cm−1 in their FTIR data. However, after the interactions with CTAB, the –NH2 wagging vibrations at 787 cm−1 is observed. The characteristic absorption band for chitosan modified magnetic nanoparticles (CTS@Fe3O4 MNPs) at 3450 cm−1 (O–H stretching vibrations) shows shift to higher wavenumber (3550 cm−1). This observation is confirmed from the sharp peaks from 1100 to 1020 cm−1 (C–O–C and C–O stretching vibrations). The presence of SDBS can be confirmed from the peak of O![[double bond, length as m-dash]](https://www.rsc.org/images/entities/char_e001.gif) S
S![[double bond, length as m-dash]](https://www.rsc.org/images/entities/char_e001.gif) O at 2250 cm−1. The peak at 1423 cm−1 is assigned to ammounium ions for CTAB.
O at 2250 cm−1. The peak at 1423 cm−1 is assigned to ammounium ions for CTAB.
The interactions of surfactants and CTS@Fe3O4 MNPs were further investigated using UV-vis (Fig. 1c). Data show that the cationic surfactants cause no change in the absorption profile of CTS@Fe3O4 MNPs. However, the absorbance decreases upon the interactions with CTS@Fe3O4 MNPs. It was found that bovine serum albumin (BSA) modified magnetic nanoparticles (MNPs-BSA) system was more stable in the presence of cationic surfactants.57 These interactions may assist separation and improve the analysis of SELDI-MS.
Conclusions
We successfully reported the applications of chitosan modified magnetic nanoparticles (CTS@Fe3O4 MNPs) for preconcentration and detection of surfactants (cationic and anionic). The method utilizes the unique properties of CTS@Fe3O4 MNPs including high surface area, supermagnetism causing rapid separation (<5 min) and high absorbance matches at N2 wavelength (337 nm). Further investigation demonstrates that the presence of various surfactants on the surface of CTS@Fe3O4 MNPs affects the optical properties. However, surface enhanced laser desorption ionization mass spectrometry (SELDI-MS) using CTS@Fe3O4 MNPs effectively ionize these species in deionized and tape water. CTS@Fe3O4 MNPs offered dual functions; probe for preconcentration and matrix. These results may open a new venue for further applications for environmental and biomedical concerns.Conflicts of interest
There are no conflicts to declare.Acknowledgements
We acknowledge the financial support from the Ministry of science and technology Taiwan. H. N. Abdelhamid expresses his gratitude to Assuit University and Ministry of Higher Education (Egypt) for support.References
- S. Kleindienst, J. H. Paul and S. B. Joye, Nat. Rev. Microbiol., 2015, 13, 388–396 CrossRef CAS PubMed.
- Y. Zhang, W. Song, J. Geng, U. Chitgupi, H. Unsal, J. Federizon, J. Rzayev, D. K. Sukumaran, P. Alexandridis and J. F. Lovell, Nat. Commun., 2016, 7, 11649 CrossRef CAS PubMed.
- K. McDonough, K. Casteel, N. Itrich, J. Menzies, S. Belanger, K. Wehmeyer and T. Federle, Sci. Total Environ., 2016, 572, 434–441 CrossRef CAS PubMed.
- Q. Guo, Z. Zhang, Y. Song, S. Liu, W. Gao, H. Qiao, L. Guo and J. Wang, Chemosphere, 2016, 168, 599–605 CrossRef PubMed.
- R. D. Deese, M. R. LeBlanc and R. L. Cook, Environ. Chem., 2015, 13, 507–516 Search PubMed.
- C. Zhou, F. Wang, H. Chen, M. Li, F. Qiao, Z. Liu, Y. Hou, C. Wu, Y. Fan, L. Liu, S. Wang and Y. Wang, ACS Appl. Mater. Interfaces, 2016, 8, 4242–4249 CAS.
- C. Boillot and Y. Perrodin, Ecotoxicol. Environ. Saf., 2008, 71, 252–259 CrossRef CAS PubMed.
- Y. Zhang, X. Li and H. Yu, J. Environ. Sci. Health, Part C: Environ. Carcinog. Ecotoxicol. Rev., 2016, 34, 204–215 CrossRef CAS PubMed.
- A. D. Eaton, L. S. Clesceri, A. E. Greenberg and M. A. H. Franson, American Public Health Association, American Water Works Association and Water Environment Federation, Standard methods for the examination of water and wastewater, American Public Health Association, Washington DC, 1998 Search PubMed.
- K. Heinig and C. Vogt, Electrophoresis, 1999, 20, 3311–3328 CrossRef CAS PubMed.
- S. Hussain, A. H. Malik and P. K. Iyer, ACS Appl. Mater. Interfaces, 2015, 7, 3189–3198 CAS.
- H. N. Abdelhamid, TrAC, Trends Anal. Chem., 2017, 89, 68–98 CrossRef CAS.
- H. N. Abdelhamid and H.-F. Wu, Anal. Bioanal. Chem., 2016, 408, 4485–4502 CrossRef CAS PubMed.
- H. N. Abdelhamid and H.-F. Wu, TrAC, Trends Anal. Chem., 2014, 65, 30–46 CrossRef.
- H. F. Wu, J. Gopal, H. N. Abdelhamid and N. Hasan, Proteomics, 2012, 12, 2949–2961 CrossRef CAS PubMed.
- H. N. Abdelhamid, TrAC, Trends Anal. Chem., 2016, 77, 122–138 CrossRef CAS.
- H. N. Abdelhamid and H.-F. Wu, Anal. Bioanal. Chem., 2016, 408, 4485–4502 CrossRef CAS PubMed.
- H. N. Abdelhamid and H.-F. Wu, Analyst, 2015, 140, 1555–1565 RSC.
- H. N. Abdelhamid, M. L. Bhaisare and H.-F. Wu, Talanta, 2014, 120, 208–217 CrossRef CAS PubMed.
- H. N. Abdelhamid, J. Gopal and H. F. Wu, Anal. Chim. Acta, 2013, 767, 104–111 CrossRef CAS PubMed.
- B.-S. Wu, H. N. Abdelhamid and H.-F. Wu, RSC Adv., 2014, 4, 3722–3731 CAS.
- B. Li, T. J. Comi, T. Si, S. J. B. Dunham and J. V. Sweedler, J. Mass Spectrom., 2016, 51, 1030–1035 CrossRef PubMed.
- H. N. Abdelhamid, S. Kumaran and H.-F. Wu, RSC Adv., 2016, 6, 97629–97635 RSC.
- H. N. Abdelhamid and H.-F. Wu, RSC Adv., 2015, 5, 76107–76115 RSC.
- H. N. Abdelhamid and H.-F. Wu, J. Am. Soc. Mass Spectrom., 2014, 25, 861–868 CrossRef CAS PubMed.
- H. N. Abdelhamid, A. Talib and H.-F. Wu, Talanta, 2016, 166, 357–363 CrossRef PubMed.
- H. N. Abdelhamid and H. F. Wu, Microchim. Acta, 2017, 184, 1517–1527 CrossRef CAS.
- H. N. Abdelhamid, B.-S. Wu and H.-F. Wu, Talanta, 2014, 126, 27–37 CrossRef PubMed.
- H. Nasser Abdelhamid and H. F. Wu, Talanta, 2013, 115, 442–450 CrossRef CAS PubMed.
- S. Sun and H. Zeng, J. Am. Chem. Soc., 2002, 124, 8204–8205 CrossRef CAS PubMed.
- Q. A. Pankhurst, J. Connolly, S. K. Jones and J. Dobson, J. Phys. D: Appl. Phys., 2003, 36, R167–R181 CrossRef CAS.
- R. Yin, W. Guo, X. Zhou, H. Zheng, J. Du, Q. Wu, J. Chang and N. Ren, RSC Adv., 2016, 6, 19265–19270 RSC.
- N. Atar, T. Eren, M. L. Yola, H. Karimi-Maleh and B. Demirdögen, RSC Adv., 2015, 5, 26402–26409 RSC.
- F. Yang, A. Feng, C. Wang, S. Dong, C. Chi, X. Jia, L. Zhang and Y. Li, RSC Adv., 2016, 6, 16911–16916 RSC.
- G. A. O. Jinhao, G. U. Hongwei and X. U. Bing, Acc. Chem. Res., 2009, 42, 1097–1107 CrossRef PubMed.
- S. C. N. Tang and I. M. C. Lo, Water Res., 2013, 47, 2613–2632 CrossRef CAS PubMed.
- J. H. Jung, J. H. Lee and S. Shinkai, Chem. Soc. Rev., 2011, 40, 4464 RSC.
- H. N. Abdelhamid, Mater. Focus, 2016, 5, 305–323 CrossRef CAS.
- B. Tanhaei, A. Ayati, M. Lahtinen and M. Sillanpää, Chem. Eng. J., 2015, 259, 1–10 CrossRef CAS.
- S. Nasirimoghaddam, S. Zeinali and S. Sabbaghi, J. Ind. Eng. Chem., 2015, 27, 79–87 CrossRef CAS.
- Z. Taherimaslak, M. Amoli-Diva, M. Allahyari, K. Pourghazi and M. H. Manafi, RSC Adv., 2015, 5, 12747–12754 RSC.
- F. Zare, M. Ghaedi and A. Daneshfar, Microchim. Acta, 2015, 182, 1893–1902 CrossRef CAS.
- X. Jiang, J. Cheng, H. Zhou, F. Li, W. Wu and K. Ding, Talanta, 2015, 141, 239–246 CrossRef CAS PubMed.
- A. Malekpour and M. Khodadadi, RSC Adv., 2016, 6, 14705–14711 RSC.
- L. Tang, Z. Xie, G. Zeng, H. Dong, C. Fan, Y. Zhou, J. Wang, Y. Deng, J. Wang and X. Wei, RSC Adv., 2016, 6, 25724–25732 RSC.
- X. Zhang, J. Wang, X. He, L. Chen and Y. Zhang, ACS Appl. Mater. Interfaces, 2015, 7, 24576–24584 CAS.
- Y. Chen, Z. Xiong, L. Peng, Y. Gan, Y. Zhao, J. Shen, J. Qian, L. Zhang and W. Zhang, ACS Appl. Mater. Interfaces, 2015, 7, 16338–16347 CAS.
- J. Gopal, H. N. Abdelhamid, P.-Y. Hua and H.-F. Wu, J. Mater. Chem. B, 2013, 1, 2463–2475 RSC.
- H. N. Abdelhamid and H.-F. Wu, Mater. Sci. Eng., C, 2014, 45, 438–445 CrossRef CAS PubMed.
- M. L. Bhaisare, H. N. Abdelhamid, B.-S. Wu and H.-F. Wu, J. Mater. Chem. B, 2014, 2, 4671–4683 RSC.
- H. N. Abdelhamid, S. Kumaran and H.-F. Wu, RSC Adv., 2016, 6, 97629–97635 RSC.
- H. N. Abdelhamid, A. Talib and H.-F. Wu, RSC Adv., 2015, 5, 34594–34602 RSC.
- H. N. Abdelhamid, Mater. Sci. Forum, 2015, 832, 28–53 CrossRef.
- H. N. Abdelhamid and H.-F. Wu, J. Mater. Chem. B, 2013, 1, 3950–3961 RSC.
- I. García, M. Henriksen-Lacey, A. Sánchez-Iglesias, M. Grzelczak, S. Penadés and L. M. Liz-Marzán, J. Phys. Chem. Lett., 2015, 6, 2003–2008 CrossRef PubMed.
- C. J. Park, S. H. Song, D. H. Kim and M. C. Gye, Aquat. Toxicol., 2016, 177, 446–453 CrossRef CAS PubMed.
- D. Joseph, S. Sachar, N. Kishore and S. Chandra, Colloids Surf., B, 2015, 135, 596–603 CrossRef CAS PubMed.
Footnote |
| † Electronic supplementary information (ESI) available. See DOI: 10.1039/c7ra05982e |
| This journal is © The Royal Society of Chemistry 2017 |

