 Open Access Article
Creative Commons Attribution 3.0 Unported Licence
Preparation, characterization and thermal analysis of urea-formaldehyde foam
Weijing Yuan†
,
Decai Li†,
Yunwen Shen,
Yang Jiang,
Yanhua Zhang *,
Jiyou Gu* and
Haiyan Tan
Materials Science and Engineering College, Key Laboratory of Bio-Based Material Science and Technology, Ministry of Education, Northeast Forestry University, Harbin, 150040, P. R. China. E-mail: zyhnefu@163.com; dldgujy@163.com; Fax: +86-451-82191068; Tel: +86-451-82191330
First published on 21st July 2017
Abstract
Urea formaldehyde foam (UFF) possesses outstanding properties of fire resistance, low smoke emission, low toxicity, and excellent insulation. These properties make it suitable for thermal insulation in buildings. UFFs were prepared in this work via a foaming technology using hexane as a physical-blowing agent. By the use of varying dosages of hexane, the effect of hexane on the properties of UFF was investigated. Increased hexane dosage was shown to cause an adverse effect on the properties including compression strength, pulverization rate and limiting oxygen index. Foam microstructure was analyzed through scanning electron microscopy (SEM); cell sizes were determined and the mean cell size increased with increasing hexane dosage. This work further investigated the relationship between the physical properties and density of UFF. Furthermore, the pyrolysis behaviour of UFF and the corresponding evolution of gaseous products were examined by using a thermogravimetric analyzer coupled with Fourier transform infrared spectrometry (TG-FTIR). Gaseous products during the pyrolysis such as HNCO, NH2CN, HCN, H2O and CO2 were found in the infrared spectra. And possible formation pathways for the main pyrolysis products were tentatively presented. The flammability of UFF was measured by cone calorimetry.
Introduction
Polymeric foams with high porosity are of great interest as they combine the property characteristics of polymers and porous materials. Polymeric foams have been used in various applications for daily necessities, such as in energy conversation, vibration suppression, sound absorption and heat insulation. Foams, such as polyurethane (PU) foams,1 polystyrene (PS) foams2 and polyethylene (PE) foams3 are characterized by their properties of light weight, high porosity, and good insulation performance which make them ideal materials widely used in building insulation. However, the importance of the fire risk of using these materials was often ignored. They present a greater fire hazard, being easily ignitable, burning quite rapidly and having higher fire toxicity.4–6 Once fire occurs, these foams can melt to a liquid or droplets which can cause excessive damage, which has been of great concern worldwide in recent years. Therefore, the fire hazard of these materials makes them unsuitable for building insulation materials.7 Compared with the thermosetting foams, urea formaldehyde (UF) foam has valuable characteristics of non-flammability, self-extinguishing, and not forming droplets in the case of fire. Moreover, UF resins have a very low price, good fire resistance and low thermal conductivity advantages. UF foams, therefore, have been widely promoted as the most suitable building insulation materials.8Some studies have been focused on the thermal insulation UF foams and modified UF foams which can be produced through a free foaming method.9 But the intensity of the foaming method efficiency is low, cannot meet the basic requirements. And the dosage of the blowing agent used to prepare foam mainly influences the volume of UF foam. Therefore, the effect of blowing agent on the properties of UF foams (compression strength, pulverization rate, thermal conductivity and limit oxygen index) was investigated, and thermal and flammability properties were measured and discussed. In this work, mass fractions (based on the UF resin mass) of blowing agent were 1.8 wt%, 2 wt%, 2.2 wt%, 2.4 wt%, 2.6 wt%, respectively.
In many published studies,10–12 properties of foams are correlated to the foam density. Density is an important parameter that influences the properties and performance of UF foams. Hence, an attempt is made to reveal relations between density and physical and mechanical properties in this work. To evaluate the combustion properties of UF foam, thermogravimetric analysis was performed to study the degradation characteristics of UF foam and flammability properties were measured using a cone calorimeter. The work was significantly important for the future application in building thermal insulation materials.
Experimental
Material
UF resin was self-synthesized in the laboratory to avoid the impact of uncertainty factor on the properties of UF foams, its details can be seen in Table 1. Hexane was provided from Tianjin Yongda chemical reagent Co., Ltd.| Properties | Solid content (%) | Viscosity (s) | pH |
|---|---|---|---|
| Value | 50.2 | 23 | 8.2 |
Preparation of UF foams
Blowing agent, surfactant, curing agent were blending with UF prepolymer to provide a stable emulsion. Then the mixture was poured into a self-made mould. After curing at 80 °C for 3 hours in an oven, the foam was formed.Emulsion morphology observation
Emulsion morphology was observed using a polarizing microscope modeled. A small drop of emulsion was immediately transferred onto a slide for observation at magnification of 10 × 40.Foaming ratio
The initial height of emulsion in the mould and the height of the foam were recorded. Foaming ratio is calculated by the following formula:| Foaming ratio = H1/H2 | (1) |
Dielectric analysis
In order to monitoring the cure processing of the emulsion, a dielectric cure monitoring technique was used. A DEA 288 Epsilon was used. The sample was heated to 80 °C at rate of 10 °C min−1, and then kept at the temperature for 90 min. The electric properties were measured during resin cure.Scanning electron microscope (SEM) morphology
To detect the cell structure and quantify the cell size, a FEI QUATA 200 scanning electron microscopy (SEM) was used. In particular, the foams were cut with a razor and sputter-coated with gold for SEM observation at an accelerating voltage of 10 kV. The obtained graph was processed using the image analysis software Image Pro to quantify the cell diameter and cell size distribution. In order to facilitate the calculation, the apparent shape of the cells is determined assuming sphericity.Apparent density and compression strength tests
The compression test of UF foam was performed according to ISO 844. The apparent density is measured according to ISO 845. For these purposes, a sample size of 50 mm × 50 mm × 50 mm was made and weighted. The samples were compressed in a direction parallel to the growth direction of the foam.Brittleness test
The pulverization rate of the UF foams was measured using a method according to ISO 6187. Firstly, a sample size of 30 mm × 30 mm × 30 mm was made and weighted. Then, the test piece was abraded against fixed abrasive paper grit 280 with constant horizontal push forces (as seen in Fig. 1). Every sample was loaded with a load of 10 N and was pushed back and forth against the same paper in the same track for 30 times. Before and after the experiment, the sample was cleaned with a brush to remove wear debris followed by weighing on Ohaus balance with an accuracy of 0.0001 mg. The pulverization rate mt was calculated from the following formula:| mt = (m1 − m2)/m1 | (2) |
 | ||
| Fig. 1 Schematic of test method for pulverization rate studies.13 | ||
Thermal conductivity test
The thermal conductivity is measured by steady state method. For that purpose, a sample in the form of discoidal shape with a diameter of 130 mm and a thickness of 20 mm was produced. The solutions to the differential equation of heat conduction are readily available according to Fourier's Law.Limit oxygen index test
The limit oxygen index (LOI) test was performed using oxygen index test instrument in terms of the standard LOI test, ISO 4589. For that purpose, the dimension of the specimens 10 mm × 10 mm × (90 mm–110 mm) were prepared.Thermal analysis
Thermogravimetric-FTIR measurement was carried out with a Perkin Elmer Pyris STA 6000 thermo-gravimetric analyzer coupled with a Mid-IR FTIR spectrometer. Sample (∼5 mg) was heated from room temperature to 700 °C at a scanning rate of 10 °C min−1 under nitrogen atmosphere. FTIR spectra were collected with 2 cm−1 resolution in the range of 4000–400 cm−1 to determine the nature of evolved gas during pyrolysis.Cone calorimeter analysis
Combustion performance was tested with CONE, produced by Stanton Redcroft. Samples size of 100 mm × 100 mm × 10 mm were tested under a heat flux of 50 kW m−2.Results and discussion
Foaming process and mechanism of UF foams
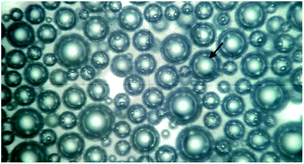
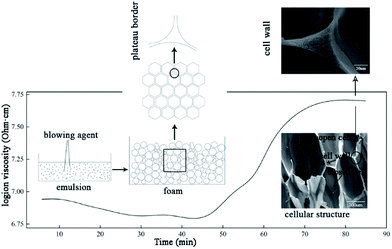
To prepare the UF foam, a two-procedure method was developed. The first step was to mix the UF and foaming agent together to prepare an emulsion. Hexane, having a boiling point of 69 °C, was used as a kind of physical blowing agent in the process. In order to prepare a stable emulsion, surfactant and high-speed mixers were used to stabilize the liquid droplets. As observed from the polarizing microscope image of emulsion, shown in Fig. 2, isolated spherical liquid droplets were dispersed in the UF resin, illustrating that the hexane was well dispersed via stirring with the presence of surfactant. Thus, a UF emulsion used to prepare UF foam was formed. Porosity of UF foam was then generated by evaporation of hexane.A schematic foaming process of UF foam is shown in Fig. 3. Dielectric analysis (DEA) was used to monitor the curing of UF emulsion. The dielectric signal data is plotted versus time during UF emulsion curing in this figure. The dielectric response is directly correlated with the degree of curing conversion. The immobilization of molecular groups as a result of condensation causes a decrease in the dielectric conductivity, namely an increase of login ion viscosity. Therefore, the change of login ion viscosity is an indication of the resin viscosity change induced by the resin cure reaction. As observed from the login ion viscosity curve, a significant increase was found when it was curing for 45 minutes. Thus, it can be concluded that cross-linking reactions of the mixture occurred rapidly in a range between 45 and 70 minutes after putting into the oven. Accompanied with this change simultaneously, the change in liquid foam volume was seen no increase in growth.
The preparation of UF foam can be divided into two steps: (1) mixing resin with blowing agent, surfactant and curing agent, and (2) heating in an oven. The first step in the foaming process was to make a homogenous foam emulsion, where blowing agent was well distributed. In the second step, blowing agent volatilized causing the formation of bubbles. At the same time, volume of liquid foam increased continuously with bubbles in the mixture forming, growing up and even rupturing. Finally, before bubbles slumping, the liquid distributed between films, Plateau borders, and nodes (Plateau-border junctions) was cured to form struts and cell walls. Thus, open cell UF foam is formed.
The foam density and cell morphology
Micro-structure of cellular materials has proven to exhibit some relations with some of the behavior of cellular solids. Generally, most cell geometry is honeycomb-like or polyhedral. An SEM micrograph of UF foams with different dose of hexane is shown in Fig. 4.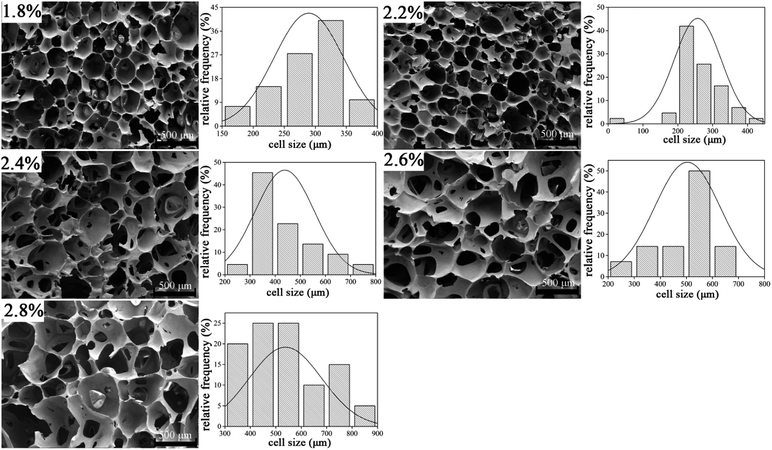 | ||
| Fig. 4 Micro-structure and cell size distribution of UF foam with different dosage of hexane (transverse direction). | ||
It is evident that cell model of UF foam has a polygon open-cell structure. That is two adjoining cells share a wall and three cell edges meet at a curved triangular plateau border. SEM images clearly indicate that the cell size significantly increased by the more addition of hexane. Simultaneously, cells were found to be slightly elongated in the rise direction, resulting from the directional foaming process. And foams prepared by varying dosage of hexane all have hollow polyhedron pores that form a three-dimensional array. The main difference is that, with the increasing hexane addition, cell struts begin to lengthen and thinner. Furthermore, the cell size has been shown to become wider with increasing hexane addition.
The average cell size of each foam sample is summarized in Table 2. It can be seen that the mean cell size of the foam is increased with the increase in dosage of hexane. The average cell diameter of UF foam with 2.6% hexane addition is approximated twice as that with 1.8% hexane. This result reveals that foaming agent plays an important role in controlling the cell size and cell geometry.
| Hexane addition (%) | 1.8 | 2.0 | 2.2 | 2.4 | 2.6 |
| Mean cell diameter (μm) | 283 | 278 | 453 | 518 | 556 |
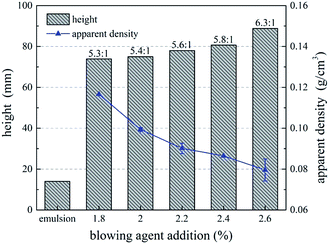
Fig. 5 shows the effect of blowing agent addition on foaming ratio and apparent density of UF foam. As shown in the figure, foaming ratio of UF foam slowly increased with increasing addition of hexane. While apparent density decreased with increasing addition of hexane. This demonstrated that lower foam density can be achieved by increasing hexane addition. That is, a higher-dose use of blowing agent and thereby a lower density foamed product. This is directly related to the fact that adding more blowing agent enabled more bubbles producing in the foam. The most important factor influencing the apparent density is porosity, high porosity resulting in low apparent density. Thus, an increase in the ratio of gas volume to total volume of foam is observed. This illustrated that foaming agent affects cell size, cell shape and foam density.
Correlations between mechanical properties and density
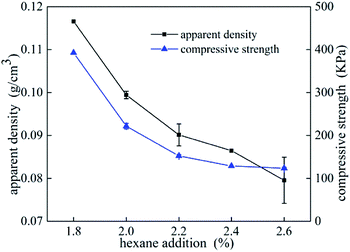
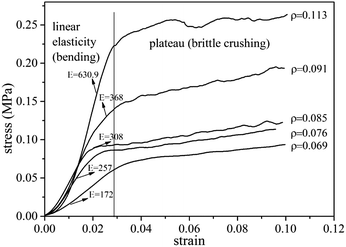
Compressive tests were performed on UF foams with different dosage of hexane addition. In Fig. 6, it can be seen that compressive strength dramatically decreased with increasing addition of blowing agent, and it presents the same tendency as apparent density. As shown in Fig. 6, the compressive strength of UF foam decreases from 392 kPa to 123 kPa, with the decrease in density from 117 kg cm−3 to 79 kg cm−3. An implication is that compression strength presents strongly depend on the density. Cell geography is also a factor that leads to this change. Since the cell sizes were significantly larger in the case of higher dose of hexane, it was initially thought that relatively thinner cell walls and edges would lead to lower foam strength.14The compressive stress–strain curves obtained from foam samples with different densities are shown in Fig. 7. The curves exhibit two obvious stages during the process. A dramatically linear elastic region is found in the initial stage, caused by the plastic yielding and bending of cell struts. A stress plateau is occurred in the second stage, caused by the collapse of the struts and densification of the overall structure. Generally, the stress/strain curves for all foams display a third stage, namely final densification. This stage is not observed during the test due to lower strain values. It is seen that the elastic modulus (E), calculated by the initial slope of the stress–strain curves, increased with foam density increasing. The yield stress occurs when the compressive strain is about 1.5 mm. In comparison with the data of lower density foam, the plateau stress of higher density foam is approximated triple as high as that of lower density foam.
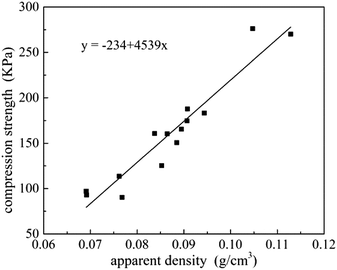
Relationship between compression strength and apparent density is shown in Fig. 8. A linear curve-fitting was used to fit the scattered points, and the possible correlation between compression strength and apparent density can be described as a function of the following mathematical equation Y = −234 + 4539x, implying that density is a significant factor affected the changes in compressive strength. And for densities in a range from 0.07 g cm−3 to 0.11 g cm−3, a 10% higher apparent density will give approximately 30% higher compression strength.
Pulverization rate
The effect of blowing agent addition on pulverization rate of UF foam is seen in Fig. 9a. It is indicated that raising the addition of hexane would increase the pulverization rate of UF foam. Furthermore, it might be thought that an increase in apparent density was associated with a decrease in pulverization rate. Fig. 9b shows the relationship between pulverization rate and apparent density. It is shown that the pulverization rate bears a direct linear relation to the apparent density. It can therefore be concluded that as apparent density increases, the pulverization rate tends to decreases linearly.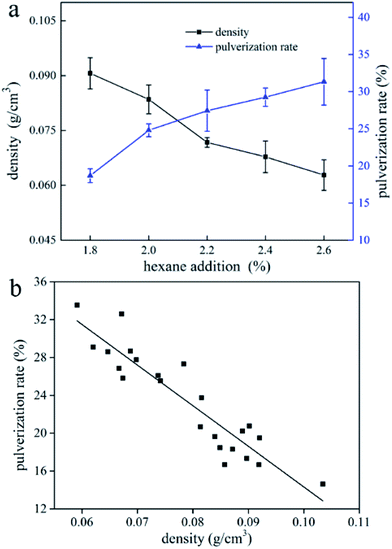 | ||
| Fig. 9 (a) Effect of blowing agent addition on pulverization rate of UF foam; (b) pulverization rate of UF foam samples as a function of apparent density. | ||
Thermal conductivity
Low thermal conductivity is a primary limitation in the development of energy-efficient heat transfer fluids required in many industrial applications. Thermal conductivity of UF foam with different dosage of hexane is shown in Table 3. It can be seen that thermal conductivity of UF foam ranges from 0.0343 to 0.0373 W m−1 K−1. The addition of hexane shows no obvious effect to the thermal conductivity of UF foam. Thermal conductivity of a material is mainly made up from four contributions, conduction through the solid matrix and the gaseous, thermal radiation and free convection.15 It is suggested that solid matrix and gas thermal conductivity accounts for most part of the total on effective thermal conductivity,16 convection can be negligible for closed cells foams since cells are small enough to avoid cell gas movements.17 Generally, the gas thermal conductivity is lower than the solid thermal conductivity, a decrease in foam density will lead to a decrease in total thermal conductivity. However the value increased when hexane addition reaches to 2.6%, this is related to the enhancement of convective heat transfer with increment of porosity.| Hexane addition (%) | 1.8 | 2.0 | 2.2 | 2.4 | 2.6 |
| Thermal conductivity (W m−1 K−1) | 0.0346 | 0.0360 | 0.0345 | 0.0343 | 0.0373 |
Limit oxygen index
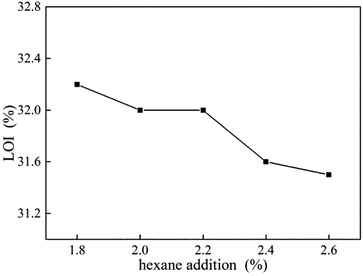
LOI value of UF foam with different hexane addition is shown in Fig. 10. As shown in the figure, LOI levels decreased slowly as the hexane dosage increased. This result is attributed to lower density gives higher oxygen concentration with enough oxygen to keep burning. It can be seen that LOI value of UF foam is beyond 31%, which is safe for people's health, which can effectively prevent the occurrence of fire.18TG-FTIR analysis UF foam
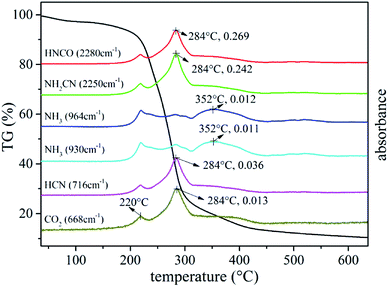
Investigation of thermal degradation is essential for understanding flame retardancy mechanism. TG-FTIR was carried out on UF foam to detect gaseous products. Fig. 11 illustrates weight loss (TG), associated derivative thermograms (DTG), and total infrared absorbance profiles during UF foam pyrolysis process.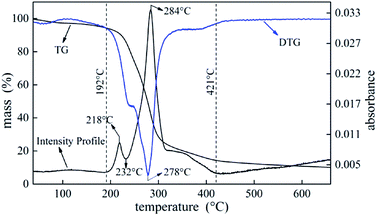 | ||
| Fig. 11 The curves of TG, DTG and the total FTIR absorbance intensity of evolved gases obtained during the UF foam pyrolysis process by TG-FTIR. | ||
The intensity profile curve shows two distinct stages which are consistent with the pyrolysis DTG curve. According to the intensity profile, the degradation process can be divided into three stages. The first stage occurs at temperature between 192 °C and 232 °C and the second stage occurs at temperature between 232 °C to 421 °C. The last stage that occurs above 421 °C is the further pyrolysis process of a thermally stable residues formed in the former stage with slight weight loss.
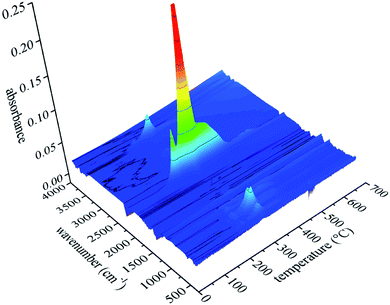
Fig. 12 shows the FTIR three-dimensional spectra of gaseous products of UF foam. The majority of the gaseous products released at the temperature of fastest degradation of 278 °C, this implies that various volatiles might reach the maximum production simultaneously.
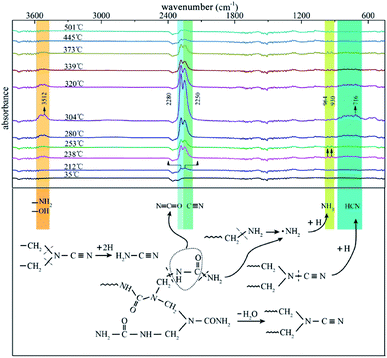
To provide a survey of the yields from reactions occurring in UF foam as a function of temperature, an individual analysis with evolved gas analysis from 35–600 °C is presented in Fig. 13. It can be seen that at low temperature (below 192 °C) no volatiles are detected. With the elevation of the pyrolysis temperatures, a few gaseous products are released out in the first pyrolysis stage, the major adsorption peaks at 2280 cm−1 and 2250 cm−1 which are assigned to the –N![[double bond, length as m-dash]](https://www.rsc.org/images/entities/char_e001.gif) C
C![[double bond, length as m-dash]](https://www.rsc.org/images/entities/char_e001.gif) O and –C
O and –C![[triple bond, length as m-dash]](https://www.rsc.org/images/entities/char_e002.gif) N were clearly visible.19,20
N were clearly visible.19,20
Other peaks emerge at around 3512 cm−1 and 964 cm−1, 930 cm−1 might be associate to –OH, –NH2 and NH3 respectively. There is an increase in the peak intensity compared with the previous stage when pyrolysis progresses into the primary stage (second stage), implying that more gaseous products are released out. In addition, appearance of new adsorption bands around 716 cm−1 might be associated to HCN.21 A summary of the gaseous products are present in Table 4. It can be seen that nitrogen containing compounds were the main species of the gaseous products. This well demonstrates the inherent flame retardant of UFF.
| Possible products | Corresponding wavenumbers (cm−1) | Formative stage | |
|---|---|---|---|
| NH3 | 964, 930 (δN–H) | 3335 (νN–H) | 1, 2 |
H2N–C![[triple bond, length as m-dash]](https://www.rsc.org/images/entities/char_e002.gif) N N |
2250 (νC![[triple bond, length as m-dash]](https://www.rsc.org/images/entities/char_e002.gif) N) N) |
3400–3600 (νN–H) | 1, 2, 3 |
HN![[double bond, length as m-dash]](https://www.rsc.org/images/entities/char_e001.gif) C C![[double bond, length as m-dash]](https://www.rsc.org/images/entities/char_e001.gif) O O |
2280 (νN![[double bond, length as m-dash]](https://www.rsc.org/images/entities/char_e001.gif) C C![[double bond, length as m-dash]](https://www.rsc.org/images/entities/char_e001.gif) O) O) |
3531 (νN–H) | 1, 2, 3 |
| HCN | 716 (δC–H) | 3250–3350 (νC–H) | 2 |
| CO2 | 668 (δO![[double bond, length as m-dash]](https://www.rsc.org/images/entities/char_e001.gif) C C![[double bond, length as m-dash]](https://www.rsc.org/images/entities/char_e001.gif) O) O) |
2300–2400 (νO![[double bond, length as m-dash]](https://www.rsc.org/images/entities/char_e001.gif) C C![[double bond, length as m-dash]](https://www.rsc.org/images/entities/char_e001.gif) O) O) |
1, 2 |
| H2O | 3500–4000 (νO–H) | — | 1, 2, 3 |
The above results can be further confirmed in Fig. 14. In addition, it was worth to mention that the FTIR data in Fig. 14 also evidenced the formation of volatile organic species with the weak peak absorbance of CO2 at 668 cm−1.
Combustion performance of UF foam
Combustion environment of CONE is very similar to that of the real fire. Therefore, CONE is the widely applied comprehensive risk assessment method. One key factor to assess the hazard of developing fires is peak heat release rate (PHRR) for the fact that a relatively high heat release tends to ignite other combustible objects more readily and PHRR is believed by many fire scientists to be the major determinant of the onset of flashover in the real fire situation. Another key factor is the toxic gases released. As most fire deaths are not caused by burns, but by smoke inhalation.A comparison of TTI, PHRR and TSR of UFF and commercial PU foam obtained by the specific measurement and analysis software of CONE was shown in Table 5. It is noteworthy that PU foam burns very rapidly after ignition with a PHRR of 379 kW m−2 whereas the PHRR of UFF is much lower than that of PU foam. It is also found that during the burning test of UFF almost no smoke is detected compared to combustion of PU foam. Av-CO and Av-CO2 of UFF are also less than that of PU foam. These facts indicated that UFF has a lower fire risk than PU foam.
| Parameters | UFF | PU foam |
|---|---|---|
| a TTI = time to ignition, total smoke release = TSR, Av-HRR = average heat release rate, Av-CO = average CO yield, Av-CO2 = average CO2 yield. | ||
| TTI (s) | 3 | 1 |
| PHRR (kW m−2) | 152 | 379 |
| Av-HRR (kW m−2) | 82 | 138 |
| Av-CO (kg kg−1) | 0.0077 | 0.0137 |
| Av-CO2 (kg kg−1) | 0.3108 | 1.3221 |
| TSR (m2 m−2) | 0.26 | 235 |
Conclusions
In this research, some basis properties and combustion characteristics of UFF were studied by changing the hexane adding amount. It was found that the density of UFF can be adjusted by the dosage of hexane. The compressive strength and pulverization rate were a function of apparent density and with an increase of density resulting in higher compressive strength and lower pulverization rate. For densities between 0.07 g cm−3 and 0.11 g cm−3, the relationship between the apparent density and compressive strength is approximated by the equation Y = −234 + 4539x. It is likely that the LOI could have been increased by increasing the foam density. The thermal conductivity of UFF appears to have no obvious change with varying hexane adding amount. In additional, the graphs obtained from SEM show that the 3D-structure of UF foam has polyhedron cell geometry. The possible UFF pyrolysis mechanism was proposed. The products released during the whole pyrolysis process are mainly HNCO, NH2CN, NH3, HCN, H2O and CO2, and volatile organic compounds mainly evolve in the second stage. UFF shows a relatively low health hazard even if it catches fire.Acknowledgements
This work was supported by the Fundamental Research Funds for the Central Universities (No. 2572016DB01; 2572017EB06). This work was also thanks for the National Natural Science Foundation of China (No. 31670569) and supported by youths Science Foundation of Heilongjiang Province of China (No. C201404 and QC2013C037).References
- C. G. Yang, L. Fischer, S. Maranda and J. Worlischek, Energ. Buildings, 2015, 87, 25 CrossRef.
- C. V. Vo, F. Bunge, J. Duffy and L. Hood, Cell. Polym., 2011, 30, 137 CAS.
- A. B. K. Putra, D. Anton, A. G. Safitra and E. Novianarenti, Adv. Mater. Res., 2015, 1123, 348 CrossRef.
- A. A. Stec and T. R. Hull, Energ. Buildings, 2011, 43, 498 CrossRef.
- L. L. Jiao and J. H. Sun, Procedia Eng., 2014, 71, 622 CrossRef CAS.
- W. An, Z. Wang, H. Xiao, J. Sun and K. M. Liew, Energy Convers. Manage., 2014, 88, 516 CrossRef CAS.
- B. P. Jelle, A. Gustavsen and R. Baetens, J. Build. Phys., 2010, 34, 99 CrossRef CAS.
- Y. L. Liu, X. W. Zhao and L. Ye, Ind. Eng. Chem. Res., 2016, 55, 8743 CrossRef CAS.
- Y. Ma, W. Zhang, C. Wang, Y. Xu, S. Li and F. Chu, Int. Polym. Process., 2013, 28, 188 CrossRef CAS.
- M. Thirumal, D. Khastgir, N. K. Singha, B. S. Manjunath and Y. P. Naik, J. Appl. Polym. Sci., 2008, 108, 1810 CrossRef CAS.
- J. H. Lin, T. T. Li, Y. C. Chuang, C. H. Huang and C. W. Lou, Adv. Mater. Res., 2014, 910, 270 CrossRef.
- E. Hernández-Nava, C. J. Smith, F. Derguti, S. Tammas-Williams, F. Léonard, P. J. Withers, I. Todd and R. Goodall, Acta Mater., 2015, 85, 387 CrossRef.
- Y. W. Shen, J. Y. Gu, H. Y. Tan, S. S. Lv and Y. H. Zhang, Constr. Build. Mater., 2016, 120, 104 CrossRef CAS.
- Y. Shen, F. Golnaraghi and A. Plumtree, Int. J. Fatigue, 2001, 23, 491 CrossRef CAS.
- E. Placido, M. C. Arduini-Schuster and J. Kuhn, Infrared Phys. Technol., 2005, 46, 219 CAS.
- J. W. Wu, W. F. Sung and H. S. Chu, Int. J. Heat Mass Transfer, 1999, 42, 2211 CrossRef CAS.
- A. Kaemmerlen, C. Vo, F. Asllanaj, G. Jeandel and D. Baillis, J. Quant. Spectrosc. Radiat. Transfer, 2010, 111, 865 CrossRef CAS.
- J. Y. Liu and D. Liang, ICICTA, 2014 7th International conference on, 2014, p. 327 Search PubMed.
- X. Chen, L. Huo, C. Jiao and S. Li, J. Anal. Appl. Pyrolysis, 2013, 100, 186 CrossRef CAS.
- L. Stradella and M. Argentero, Thermochim. Acta, 1993, 219, 315 CrossRef CAS.
- T. Ahamad and S. M. Alshehri, J. Therm. Anal. Calorim., 2011, 109, 1039 CrossRef.
Footnote |
| † These authors contributed to this work equally. |
| This journal is © The Royal Society of Chemistry 2017 |

