 Open Access Article
Facile synthesis of Cu/Ni alloy nanospheres with tunable size and elemental ratio†
Jinglei Liu,
Yiqun Zheng * and
Shifeng Hou
National Engineering Research Center for Colloidal Materials, Shandong University, Jinan, Shandong 272000, P. R. China. E-mail: yiqunzheng@sdu.edu.cn
First published on 1st August 2017
Abstract
We report a facile synthesis of copper/nickel (Cu/Ni) alloy nanospheres in high purity and with tunable, well-controlled sizes and elemental ratios. The success of this synthesis relies on the use of one-pot, direct thermal reduction of a Cu and Ni precursor mixture in the presence of trioctylphosphine (TOP) and oleylamine (OAm) at an elevated temperature to form Cu/Ni alloy nanoparticles with a spherical shape and uniform size. Their sizes could be readily tuned in the range of 6.9–27.3 nm by simply varying the volume of TOP added to the reaction solution. The elemental ratio of Cu to Ni in resultant products was found to remain the same as that in the precursor, which offers a simple way to manipulate the composition of Cu/Ni alloy nanospheres. We also tested the catalytic performance of as-prepared Cu/Ni alloy nanospheres and evaluate the effect of size and elemental ratio using the reduction of 4-nitrophenol as the model reaction. The current strategy enables the size and composition controlled synthesis of Cu/Ni alloy nanomaterials and could find important use in the fabrication of other types of bimetallic alloy nanomaterials with desired sizes and compositions for catalytic purposes.
Introduction
Bimetallic nanomaterials have attracted enormous research attention recently due to their unique properties and applications in the field of optics and catalysis.1–5 Compared to monometallic counterparts, the combination of two metals in one nanomaterial allows for potential coupling of physicochemical properties between the constituent metals and thus enhancement of their performance in an array of applications.6–10 In addition, in contrast to other bimetallic nanomaterials without an alloy phase, such as core–shell and hybrid structures, the elemental distribution of the two metals can be more homogeneous and the two metals can interact with each other in a more close way.11–13 To this end, it is of great importance to develop a synthetic strategy for fabrication of bimetallic alloy nanomaterials.Thanks to the research efforts from many groups, it is now possible to produce bimetallic alloy nanomaterials with various sizes, shapes, and compositions.14,15 The elemental combinations include gold/silver (Au/Ag), platinum/nickel (Pt/Ni), platinum/cobalt (Pt/Co), platinum/copper (Pt/Cu), gold/copper (Au/Cu), Cu/Ni, among others.16–27 Compared to those groups that include noble metals, the pure use of non-noble metals can be more beneficial due to their low cost and abundant content in the Earth's crust.28,29 Take Cu/Ni for example, such combination has been widely used in production of anti-corrosion coins and serving as catalyst in various typical hydrogenation reactions.30,31 Their prices were only 1/100 of those noble metals, such as Au, Ag, Pt and Pd. It would be of great value when they can work as substitute for noble metals in large-scale, industrial applications.
Similar to monometallic nanomaterials, the physiochemical properties of bimetallic alloy nanomaterials has been demonstrated to be highly dependent on their size and shapes.32–35 It would be of great help to develop synthetic strategies for fabrication of bimetallic alloy nanomaterials with controlled sizes/shapes and thus allow convenient manipulations over their physiochemical properties.36 However, we noted that the controlled synthesis of Cu/Ni alloy nanomaterials with tunable sizes and shapes has been paid insufficient research attention yet. To the best of our knowledge, there are very few successful reports in this field. For example, Peng and coworkers reported the synthesis of hexagonal and triangular Cu/Ni alloy nanoplates with a well-defined twin structure using a facile one-pot non-aqueous synthetic approach.37 Zeng and coworkers reported the synthesis of nanoscale Cu/Ni octahedra and cubes with controllable shapes and tunable compositions using borane morpholine as a reducing agent to induce the rapid formation of the nuclei and capping agents to promote the {100}-facet-enclosed shapes.38 However, no feasible size-controlled route has been provided yet. In addition, given Cu and Ni both have face-centered-cubic (fcc) crystal lattice, those shapes (e.g., sphere, plate, rod, right bipyramid, etc.), that has been obtained and reported in previous studies of fcc metal synthesis, should also be expected in the case of Cu/Ni alloy nanomaterials.39–41 In a sense, it still remains technique challenges to synthesize Cu/Ni alloy nanomaterials in a controlled way.
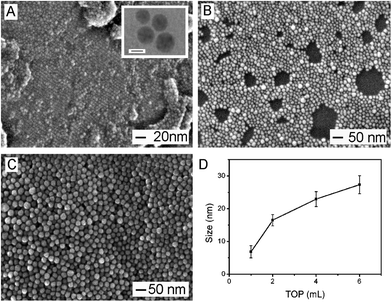
Herein, we report a facile synthesis of Cu/Ni alloy nanospheres in high purity and with tunable, well-controlled sizes and elemental ratios. The current work exhibited its value in the following aspects: (i) for the first time, Cu/Ni alloy nanomaterials could be obtained with spherical shapes in high purity; (ii) their sizes could be readily tuned in the range of 6.9–27.3 nm by simply varying the amount of TOP added to the reaction solution. In particular, the diameter of Cu/Ni alloy nanospheres was controlled to 6.9 ± 1.9, 16.5 ± 1.7, 22.9 ± 2.2 and 27.3 ± 2.7 nm, respectively, when the volume of TOP was 1, 2, 4, and 6 mL, respectively; (iii) the elemental ratio of Cu to Ni in resultant products were found to keep the same as that in precursor, which offers an simple way to manipulating the composition of Cu/Ni alloy nanospheres. Various characterizations, including SEM, TEM, high-resolution TEM, XRD, HAADF-STEM, EDS, and AAS, have been conducted to analyze and validate the size, shape, structure, and composition of resultant products. We also tested the catalytic performance of as-prepared Cu/Ni alloy nanospheres with different sizes and elemental ratios using the reduction of 4-nitrophenol as the model reaction. The apparent rate constants of various products were measured and the effect of size and elemental ratios towards the catalytic performance were systematically evaluated.
Experimental section
Materials
Copper(II) acetylacetonate (Cu(acac)2, 97%), nickel(II) acetylacetonate (Ni(acac)2, 95%), and oleylamine (OAm, 80–90%) were all obtained from Aladdin Industrial Inc. and used as received. Ethanol, hexane, chloroform, sodium borohydride (NaBH4, 98%) and 4-nitrophenol (4-NP, ≥99.0%) were obtained from Sinopharm Chemical Reagent Co., Ltd. and used as received. Trioctylphosphine (TOP, 90%) and carbon black (CB, Vulcan XC-72) were purchased from Alfa Aesar (China) Chemical Co., Ltd. and Cabot Co., respectively. Ultrapure water with a resistivity of 18.2 MΩ cm was prepared using a UPH-II-20 water purification system (Ulupure, Xi'an, China).Synthesis of Cu/Ni alloy nanospheres
In a standard procedure, the preparation of Cu50Ni50 alloy nanospheres is as follows: 2 mmol of Cu(acac)2 and 2 mmol of Ni(acac)2 were added in 40 mL of oleylamine under the magnetic stirring. After the mixture had been bubbled with N2, the mixture was kept heated at 80 °C for 20 min, and then 2 mL of TOP was one-shot injected using a pipette. The mixture was then heated to 180 °C, aged for 4 h, and then naturally cooled down to room temperature. The products were obtained and purified with hexane and chloroform by centrifugation to remove excess reactants for further characterization and use. To obtain Cu/Ni alloy nanospheres with different size/elemental ratio, the synthetic procedures were the same, except the amount of TOP and ratio of Cu(acac)2 to Ni(acac)2 was varied, respectively. See main text and Table 1 for detailed information.| Product number | Precursor (mmol) | TOP (mL) | OAm (mL) | Size (nm) | Products components (CuxNiy) | |
|---|---|---|---|---|---|---|
| Cu(acac)2 | Ni(acac)2 | |||||
| CuNi(1) | 2 | 2 | 1 | 40 | 6.90 ± 1.9 | Cu50Ni50 |
| CuNi(2) | 2 | 2 | 2 | 40 | 16.5 ± 1.7 | Cu50Ni50 |
| CuNi(3) | 2 | 2 | 4 | 40 | 22.9 ± 2.2 | Cu50Ni50 |
| CuNi(4) | 2 | 2 | 6 | 40 | 27.3 ± 2.7 | Cu50Ni50 |
| CuNi(5) | 0.5 | 2 | 2 | 40 | 18.0 ± 1.0 | Cu20Ni80 |
| CuNi(6) | 1 | 2 | 2 | 40 | 16.3 ± 0.6 | Cu33Ni67 |
| CuNi(7) | 2 | 1 | 2 | 40 | 19.7 ± 1.5 | Cu67Ni33 |
| CuNi(8) | 2 | 0.5 | 2 | 40 | 19.7 ± 1.2 | Cu80Ni20 |
Catalytic reduction of 4-NP
To avoid aggregation of nanoparticles in aqueous solution, we loaded Cu/Ni alloy nanospheres on CB at 50% wt to form catalyst. In particular, 5 mg of as-prepared Cu/Ni alloy nanospheres powder and 5 mg of CB were both dispersed in 2 mL of ethanol, respectively. These two ethanol suspension were ultrasonically mixed and precipitates were collected by filtration, washed three times with water, and re-dispersed in water to form catalyst aqueous suspension at the concentration of 5 mg mL−1. The products were analyzed by AAS to obtain the amount of Cu/Ni nanospheres. To conduct catalytic reaction, the as-prepared catalyst aqueous suspension containing 1 mg of Cu/Ni nanospheres were mixed with 392 mL of water and 4 mL of 4-NP (5 mM) sequentially. After 10 min, 4 mL of NaBH4 aqueous suspension (5 M) was added to the mixture to initiate the reaction. During the reaction, aliquots were taken and measured at room temperature using a UV-vis spectrophotometer. Evaluations of Cu/Ni alloy nanospheres with different sizes and compositions were carried out using the same procedure.Characterizations
Scanning electron microscopy (SEM) images and energy dispersive spectroscopy (EDS) patterns were captured using a SU 8010 microscope operated at 5.0 kV (Hitachi, Tokyo, Japan). The samples were prepared by dropping hexane suspensions of the Cu/Ni alloy nanospheres onto silicon wafer and dried at ambient condition. Transmission electron microscope (TEM) and high-resolution TEM images were obtained using a JEM-1400 microscope operated at 100 kV and a JEM-2100F microscope operated at 200 kV (JEOL, Tokyo, Japan), respectively. High angle annular dark field scanning transmission electron microscopy (HAADF-STEM) and STEM-EDS elemental mapping images were captured using a Tecnai G2 TF 20 microscope operated at 200 kV (FEI, Hillsboro, USA). The samples were prepared by dropping hexane suspensions of the nanoparticles onto carbon-coated Cu grids and dried under ambient conditions. X-ray diffraction (XRD) patterns were recorded using a SAXSess mc2 diffractometer with filtered Cu Kα radiation at 0.154 nm (Anton Paar, Graz, Austria). All extinction spectra were recorded using a U-4100 UV-vis-NIR spectrometer (Hitachi, Tokyo, Japan). The elemental ratio in resultant products were determined by dissolving alloy products in aquaregia, diluting it with nitric acid (1% wt.), and measuring the elemental concentration of the solution using a pinAAcle 900F atomic absorption spectrophotometer (AAS, Perkin-Elmer, Waltham, USA).Results and discussion
Cu(acac)2 and Ni(acac)2 were employed as precursors and reduced to zero-valent Cu and Ni to form nano-alloys of Cu/Ni in the presence of oleylamine and TOP at an elevated temperature. As shown in Fig. 1, the resultant products were characterized by SEM, TEM, high-resolution TEM, and XRD. Firstly, as shown in Fig. 1A and B, most products exhibited a spherical shape and uniform size (16.5 ± 1.7 nm in diameter) in high purity (>98%). The high-resolution TEM image (Fig. 1C) taken from an individual particle showed a continuous fringe pattern with a lattice spacing of 1.9 Å. The presence of twin defects suggested its polycrystalline structure. XRD pattern showed three peaks at 2θ of 43.95°, 51.35°, and 75°, respectively (Fig. 1D). These peaks were located in the middle of the corresponding diffraction peaks of {111}, {200}, and {220} crystal planes of Cu (red dotted line) and Ni (blue dotted line). In particular, the characteristic diffraction 2θ peaks of Cu is 43.297°, 50.433° and 74.130°, respectively, corresponding to {111}, {200}, and {220} crystal plane of Cu, respectively. The characteristic diffraction 2θ peaks of Ni is 44.507°, 51.860° and 76.370°, respectively, corresponding to {111}, {200}, and {220} crystal plane of Ni, respectively. By calculation based on the Vegas law (a linear relation between the lattice parameter of an alloy and its composition),42 the ratio of Cu to Ni in the nano-alloy is estimated to be about 1![[thin space (1/6-em)]](https://www.rsc.org/images/entities/char_2009.gif) :
:![[thin space (1/6-em)]](https://www.rsc.org/images/entities/char_2009.gif) 1. To confirm that, we also analyzed the composition by AAS, which demonstrated that the ratio of Cu/Ni in the products was 1
1. To confirm that, we also analyzed the composition by AAS, which demonstrated that the ratio of Cu/Ni in the products was 1![[thin space (1/6-em)]](https://www.rsc.org/images/entities/char_2009.gif) :
:![[thin space (1/6-em)]](https://www.rsc.org/images/entities/char_2009.gif) 1 (Table S1†). Fig. 2 shows the HAADF-STEM and STEM-EDS elemental mapping images of Cu and Ni towards as-prepared Cu/Ni alloy nanospheres. The observation of twin boundaries was in accordance with previous characterization, which confirmed its polycrystalline structure. The elemental mapping results illustrated in Fig. 2C and D, proved that Cu and Ni are homogeneously distributed in the whole particle, suggesting the formation of an alloyed structure. Taken together, we can conclude that the resultant products were dominated with polycrystalline Cu/Ni nano-alloy with a spherical shape and a uniform diameter of 16.5 ± 1.7 nm.
1 (Table S1†). Fig. 2 shows the HAADF-STEM and STEM-EDS elemental mapping images of Cu and Ni towards as-prepared Cu/Ni alloy nanospheres. The observation of twin boundaries was in accordance with previous characterization, which confirmed its polycrystalline structure. The elemental mapping results illustrated in Fig. 2C and D, proved that Cu and Ni are homogeneously distributed in the whole particle, suggesting the formation of an alloyed structure. Taken together, we can conclude that the resultant products were dominated with polycrystalline Cu/Ni nano-alloy with a spherical shape and a uniform diameter of 16.5 ± 1.7 nm.
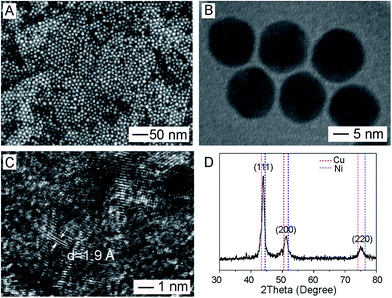 | ||
| Fig. 1 Characterization of Cu/Ni alloy nanospheres: (A) SEM image; (B) TEM image; (C) high-resolution TEM image; (D) XRD pattern. | ||
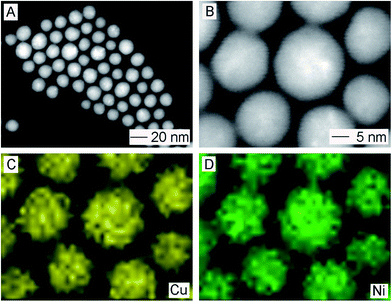 | ||
| Fig. 2 (A and B) HAADF-STEM and (C and D) STEM-EDS elemental mapping images of Cu/Ni alloy nanospheres. | ||
In the current work, TOP was added during the synthesis of Cu/Ni alloy nanospheres, which had been widely used in the synthesis of II–VI quantum dots.43 We observed that the resultant products would have irregular morphology and broad size distribution when no TOP was added in the standard procedure (Fig. S1†), which could be attributed to the uncontrolled aggregation/attachment of insufficiently protected nano-alloys during the synthesis. We noted that the difference in the amount of TOP could lead to the change of products in size. As shown in Fig. 3A–C all the resultant products kept the spherical shape and the diameter of resultant nanospheres were 6.9 ± 1.9, 16.5 ± 1.7, 22.9 ± 2.2 and 27.3 ± 2.7 nm, respectively, when the volume of TOP was 1, 2, 4 and 6 mL, respectively. To elucidate the effect of TOP on the composition of product, these resultant products were also analyzed by EDS and AAS. The ratios of Cu to Ni in all the products remained about 1![[thin space (1/6-em)]](https://www.rsc.org/images/entities/char_2009.gif) :
:![[thin space (1/6-em)]](https://www.rsc.org/images/entities/char_2009.gif) 1 (Fig. S2–S5 and Table S1†), indicating that varied amount of TOP led to unnoticeable change of product composition in addition to regulation of their sizes. We performed a statistical analysis by plotting product size versus amount of TOP (Fig. 3D), showing that the increase in amount of TOP could lead to the formation of Cu/Ni alloy nanospheres with a larger diameter in the size range of 6.9–27.3 nm.
1 (Fig. S2–S5 and Table S1†), indicating that varied amount of TOP led to unnoticeable change of product composition in addition to regulation of their sizes. We performed a statistical analysis by plotting product size versus amount of TOP (Fig. 3D), showing that the increase in amount of TOP could lead to the formation of Cu/Ni alloy nanospheres with a larger diameter in the size range of 6.9–27.3 nm.
TOP has been known as an effective capping agent in high-temperature synthesis of nanomaterials.44,45 When more capping agents were added in the reaction system, the surface of nanocrystal should be capped in a more dense way, which made it difficult for assembly/aggregation of Cu/Ni nuclei and thus seed formation during the initial stage. To this end, the seed quantity may become less when more TOP was present in the system. Given the total amount of metal precursor was kept constant, the decrease in seed amount led to an enlarged product size. Since size effect is an important factor affecting the physiochemical properties of bimetallic nanoparticles, the current size-tunable method by changing TOP amount offers a feasible way to tuning the size of Cu/Ni bimetallic nanomaterials.
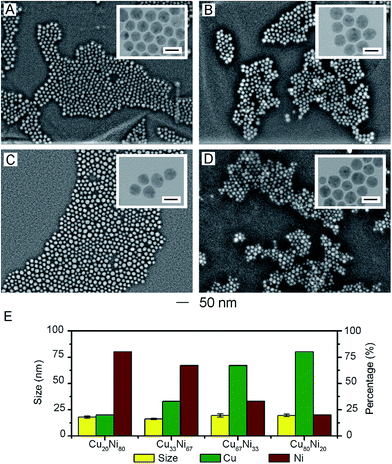
The elemental ratio of Cu to Ni in resultant products was controlled by varying the molar ratio of Cu(acac)2 and Ni(acac)2 in precursor while keeping other reaction parameters in the standard procedure unchanged. In particular, we replaced the combination of [Cu(acac)2 2 mmol + Ni(acac)2 2 mmol] in the standard procedure to [Cu(acac)2 0.5 mmol + Ni(acac)2 2 mmol], [Cu(acac)2 1 mmol + Ni(acac)2 2 mmol], [Cu(acac)2 2 mmol + Ni(acac)2 1 mmol], [Cu(acac)2 2 mmol + Ni(acac)2 0.5 mmol], respectively. The resultant products were analyzed by EDS and AAS to obtain the elemental composition (Fig. S6–S9 and Table S1†). CuxNiy (x + y = 100) was used to interpret the elemental composition of resultant products. It is found that for all these samples, the molar ratio of Cu to Ni in products kept approximately the same as that in precursors. Detailed information was summarized in Table 1. We also took SEM and TEM images of these samples to observe the effect of precursor change on the product size and morphology. As shown in Fig. 4A–D all the products still exhibited the spherical shape and uniform size. Corresponding elemental composition and size were statistically illustrated in Fig. 4E. The sizes of these products were 18.0 ± 1.0 nm for Cu20Ni80, 16.3 ± 0.6 nm for Cu33Ni67, 19.7 ± 1.5 nm for Cu67Ni33, and 19.7 ± 1.2 nm for Cu80Ni20. Compared to the size of Cu50Ni50 alloy nanospheres obtained via the standard procedure, the size of these samples were roughly close, which indicated the unnoticeable impact on product size when molar ratio of Cu to Ni in precursor was varied.
Thanks to the feasibility to tuning size and elemental composition of Cu/Ni alloy nanospheres that is enabled by the current work, we would be able to investigate the dependence of catalytic activity on their size and elemental composition.46–53 Herein, we chose the reduction of 4-NP as the model reaction and employ the as-prepared Cu/Ni products loaded on carbon as the catalysts. 4-NP as an organic matter with highly toxic is difficult to be biodegradable which will cause great pollution to the ecological environment. The reduction of 4-NP to 4-aminophenol (4-AP) at room temperature using NaBH4 as the reducing agent and metal nanoparticles as the catalyst is a commonly used treatment method. As a result, this reduction has been widely employed as a model reaction to quantitatively evaluate the catalytic activity of metal or alloy catalysts.
To avoid aggregation of as-prepared Cu/Ni alloy nanospheres in aqueous phase, the CB, which has no catalytic activity for the 4-NP reduction reaction, were used as substrate for the Cu/Ni alloy nanospheres. The products were analyzed by AAS to obtain the amount of Cu/Ni nanospheres (Table S1†). In a typical reaction, CB-loaded Cu/Ni alloy nanospheres (the mass ratio of CB to Cu/Ni was 1![[thin space (1/6-em)]](https://www.rsc.org/images/entities/char_2009.gif) :
:![[thin space (1/6-em)]](https://www.rsc.org/images/entities/char_2009.gif) 1) was mixed with 4-NP and NaBH4 sequentially and the mass ratio of Cu/Ni to 4-NP was set to 1
1) was mixed with 4-NP and NaBH4 sequentially and the mass ratio of Cu/Ni to 4-NP was set to 1![[thin space (1/6-em)]](https://www.rsc.org/images/entities/char_2009.gif) :
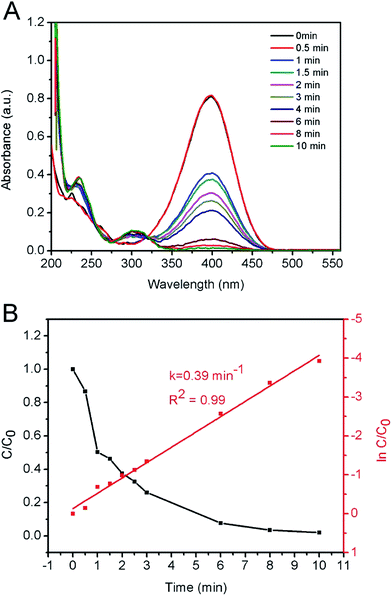
:![[thin space (1/6-em)]](https://www.rsc.org/images/entities/char_2009.gif) 2.8. Compared to literature results, under the same reaction conditions, the quantity of Cu/Ni catalysts used in the current study was much less than that in other literatures while the resultant kapp values were similar. We summarised and compared these results in Table S2.†54–56 In a sense, the Cu/Ni alloy nanospheres synthesized in our study has better mass-specific catalytic efficiency. As shown in Fig. 5A, as the reduction reaction proceeded, the intensity of the absorption peak of 4-NP located at 400 nm gradually decreased. Meanwhile, a new absorbance peak of 4-AP located at 300 nm appeared and its intensity increased as reaction proceeded. Fig. 5B shows the plot of C/C0 versus reaction time for the reduction of 4-NP over the CB-Cu50Ni50 catalyst, where the reaction took 8 min to finish, which shows a high catalytic activity. It is well known that the pseudo-first-order kinetics could be applied for the evaluation of rate constants in the reduction of 4-NP when excess NaBH4 was used. The apparent rate constants (kapp) were calculated from the slopes of the linearly fitted plots of ln(Ct/C0) − t. The kapp value of our CB-Cu50Ni50 catalyst is 0.39 min−1.
2.8. Compared to literature results, under the same reaction conditions, the quantity of Cu/Ni catalysts used in the current study was much less than that in other literatures while the resultant kapp values were similar. We summarised and compared these results in Table S2.†54–56 In a sense, the Cu/Ni alloy nanospheres synthesized in our study has better mass-specific catalytic efficiency. As shown in Fig. 5A, as the reduction reaction proceeded, the intensity of the absorption peak of 4-NP located at 400 nm gradually decreased. Meanwhile, a new absorbance peak of 4-AP located at 300 nm appeared and its intensity increased as reaction proceeded. Fig. 5B shows the plot of C/C0 versus reaction time for the reduction of 4-NP over the CB-Cu50Ni50 catalyst, where the reaction took 8 min to finish, which shows a high catalytic activity. It is well known that the pseudo-first-order kinetics could be applied for the evaluation of rate constants in the reduction of 4-NP when excess NaBH4 was used. The apparent rate constants (kapp) were calculated from the slopes of the linearly fitted plots of ln(Ct/C0) − t. The kapp value of our CB-Cu50Ni50 catalyst is 0.39 min−1.
Then, the catalytic performance of Cu/Ni alloy nanospheres with various sizes and elemental ratios were measured using the same protocol. To differentiate them clearly, we named these samples using Cu/Ni(x) as shown in Table 1. As shown in Fig. 6A, for Cu/Ni alloy nanospheres with different sizes, their apparent rate constant was 0.08 min−1 for CuNi(1), 0.39 min−1 for CuNi(2), 0.29 min−1 for CuNi(3), 0.13 min−1 for CuNi(4), respectively. For CuNi(1), the poor catalytic performance may be attributed to the fact of TOP layer and oxide layer on their surface. To verify our hypothesis, we analyzed CuNi(1) using XPS. As shown by the survey spectrum in Fig. S10A,† there were peaks for Cu 2p, Ni 2p, C 1s, O 1s, P 2p, and N 1s, indicating the existence of TOP on the surfaces of CuNi(1). In Fig. S10C,† the peaks located at ca. 853.2 eV and 856.3 eV corresponds to NiP and Ni2O3. The oxidation state of Ni was +3. The peak located at ca. 933.2 eV corresponds to CuO (Fig. S10D†). The oxidation state of Cu was −2. It was demonstrated that the surface of CuNi(1) was covered with TOP and oxide layer. For CuNi(3) and CuNi(4) that were larger than CuNi(2), less surface atoms could participate in the reaction as particle size increased, which resulted in decreased active catalytic efficiencies. For Cu/Ni alloy nanospheres composed of different elemental ratios of Cu to Ni, as shown in Fig. 6B, the apparent rate constant are 0.17 min−1 for CuNi(5), 0.37 min−1 for CuNi(6), 0.52 min−1 for CuNi(7), 0.80 min−1 for CuNi(8), respectively. The rate increased with the proportion of Cu, which indicated the Cu was more active than Ni in catalyzing the reduction of 4-NP. The kapp of CB-CuNi(8) catalyst is 0.8 min−1, which is highest one of all the as-prepared samples. For CuNi(8), the high catalytic performance may be attributed to the fact of more metallic Cu and Ni atoms were exposed on the surface of nanospheres. As shown by the survey spectrum in Fig. S11A,† there were peaks for Cu 2p, Ni 2p, C 1s, O 1s and N 1s, indicating the TOP was absent on the surface of CuNi(8). As shown in Fig. S11C and D,† the peaks located at ca. 851.6 eV and 854.3 eV corresponds to Ni and NiO, and the peak located at ca. 931.9 eV corresponds to Cu. Compared with CuNi(1), the peaks of NiO and metallic Ni and Cu appeared and the peaks of NiP and Ni2O3 disappeared. In other word, more metallic Cu and Ni atoms were exposed for CuNi(8) while most surface Cu and Ni atoms of CuNi(1) were covered by phosphide and oxide layer. It showed that the appropriate selection of size and elemental composition could be essential and beneficial to achieve high catalytic activity for Cu/Ni alloy nanomaterials. In addition, we added the catalytic experiments of pure copper and pure nickel nanoparticles. As shown in Fig. S12,† the apparent rates constant are 0.03 min−1 for pure Cu and 0.01 min−1 for pure Ni nanoparticles, respectively. The pure Cu and pure Ni nanoparticles have lower active catalytic efficiencies compared with Cu/Ni alloy nanospheres. Therefore, it is not unreasonable to assume that the combination of Cu and Ni in one catalyst contributed to the enhanced catalytic performance in the model reaction, which should be attributed to the presence of synergistic effect of Cu and Ni.
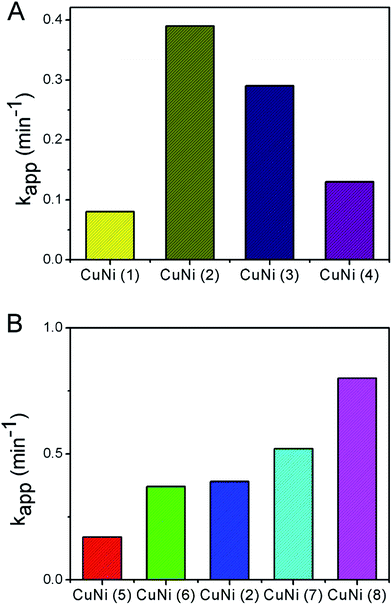 | ||
| Fig. 6 Comparison of apparent reaction rates for reduction of 4-NP when Cu/Ni nanospheres with different (A) sizes and (B) elemental compositions were used as catalysts. | ||
Also, to evaluate the catalytic stability and reusability of Cu/Ni nanospheres, CuNi(8) were tested for reusability in the reduction of 4-NP by NaBH4 for five cycles. The kapp values for each round of catalytic reaction were obtained from the slopes of ln(Ct/C0) − t. The kapp values of CuNi(8) for the successive five cycles were shown in Fig. S13.† It can be seen that the kapp value of CuNi(8) almost keeps a constant without obvious loss after five cycles. In order to evaluate the structure and particle sizes of Cu/Ni nanospheres after five cycles, the SEM images of CuNi(8) were illustrated in Fig. S14.† It can be seen that the structure and particle sizes of Cu/Ni nanospheres almost keeps a constant without obvious change after five cycles, indicating the excellent stability and reusability of the catalyst.
Conclusion
In summary, we have synthesized high-purity Cu/Ni alloy nanospheres with tunable, well-controlled size and element ratio in a facile way. Various characterizations have been conducted to confirm the size, shape, structure, and composition. The key of success in convenient manipulation over size and elemental composition was realized by simply varying the amount of TOP and the ratio of Cu/Ni precursors, respectively. In particular, their sizes can be easily tuned in the range of 6.9–27.3 nm and the elemental ratios in products kept approximately the same as that in corresponding precursors. When they worked as catalysts for the reduction of 4-NP to 4-AP by NaBH4, the catalytic activities of Cu/Ni alloy nanospheres were found to be highly related to their sizes and element ratios. The best catalytic performance could be achieved by choosing the optimized size and more Cu should be involved in the catalyst. The apparent rate constant could achieve as high as 0.8 min−1 when 19.7 ± 1.2 nm Cu80Ni20 served as the catalyst with the mass ratio of catalyst reactant as 1![[thin space (1/6-em)]](https://www.rsc.org/images/entities/char_2009.gif) :
:![[thin space (1/6-em)]](https://www.rsc.org/images/entities/char_2009.gif) 2.8. The current work not only paves the way for synthesis of Cu/Ni alloy nanospheres with controllable sizes and elemental ratios but also advances our understanding of the size- and composition-dependent catalytic properties of bimetallic alloy nanomaterials.
2.8. The current work not only paves the way for synthesis of Cu/Ni alloy nanospheres with controllable sizes and elemental ratios but also advances our understanding of the size- and composition-dependent catalytic properties of bimetallic alloy nanomaterials.
Acknowledgements
This work was supported by the National Natural Science Foundation of China Grants (No. 13450005131401) and the startup funding from Shandong University (No. 12320086963031 & No. 12320076614115).References
- K. D. Gilroy, A. Ruditskiy, H. C. Peng, D. Qin and Y. Xia, Chem. Rev., 2016, 116, 10414–10472 CrossRef CAS PubMed
.
- S. Guo and E. Wang, Nano Today, 2011, 6, 240–264 CrossRef CAS
.
- D. Wang and Y. Li, Adv. Mater., 2015, 23, 1036 CrossRef
.
- H. Zeng, X. W. Du, S. C. Singh, S. A. Kulinich, S. Yang, J. He and W. Cai, Adv. Funct. Mater., 2012, 22, 1333–1353 CrossRef CAS
.
- J. Lai, W. Niu, R. Luque and G. Xu, Nano Today, 2015, 10, 240–267 CrossRef CAS
.
- R. Ferrando, J. Jellinek and R. L. Johnston, Chem. Rev., 2008, 108, 845–910 CrossRef CAS PubMed
.
- J. Gu, Y. W. Zhang and F. F. Tao, Chem. Soc. Rev., 2012, 41, 8050–8065 RSC
.
- X. Liu, D. Wang and Y. Li, Nano Today, 2012, 7, 448–466 CrossRef CAS
.
- W. Zhu, Y. J. Zhang, H. Zhang, H. Lv, Q. Li, R. Michalsky, A. A. Peterson and S. Sun, J. Am. Chem. Soc., 2014, 136, 16132–16135 CrossRef CAS PubMed
.
- C. N. Brodsky, A. P. Young, K. C. Ng, C. H. Kuo and C. K. Tsung, ACS Nano, 2014, 8, 9368–9378 CrossRef CAS PubMed
.
- G. Prieto, H. Tuysuz, N. Duyckaerts, J. Knossalla, G. H. Wang and F. Schuth, Chem. Rev., 2016, 116, 14056–14119 CrossRef CAS PubMed
.
- M. B. Gawande, A. Goswami, F. X. Felpin, T. Asefa, X. Huang, R. Silva, X. Zou, R. Zboril and R. S. Varma, Chem. Rev., 2016, 116, 3722–3811 CrossRef CAS PubMed
.
- D. Kim, J. Resasco, Y. Yu, A. M. Asiri and P. Yang, Nat. Commun., 2014, 5, 4948 CrossRef CAS PubMed
.
- J. Zhang, H. Yang, J. Fang and S. Zou, Nano Lett., 2010, 10, 638–644 CrossRef CAS PubMed
.
- K. An and G. A. Somorjai, ChemCatChem, 2012, 4, 1512–1524 CrossRef CAS
.
- A. Bhukta, P. Guha, B. Satpati, P. Maiti and P. V. Satyam, Appl. Surf. Sci., 2017, 407, 337–344 CrossRef CAS
.
- M. K. Carpenter, T. E. Moylan, R. S. Kukreja, M. H. Atwan and M. M. Tessema, J. Am. Chem. Soc., 2012, 134, 8535–8542 CrossRef CAS PubMed
.
- E. I. Santiago, A. L. C. Varanda and H. M. Villullas, J. Phys. Chem. C, 2016, 111, 3146–3151 Search PubMed
.
- A. M. Fenelon and C. B. Breslin, Corros. Sci., 2003, 45, 2837–2850 CrossRef CAS
.
- S. K. Ghosh, M. Mandal, S. Kundu, S. Nath and T. Pal, Appl. Catal., A, 2004, 268, 61–66 CrossRef CAS
.
- G. Barcaro, A. Fortunelli, G. Rossi, F. Nita and R. Ferrando, J. Phys. Chem. B, 2015, 110, 23197–23203 CrossRef PubMed
.
- X. Hong, C. Tan, J. Liu, J. Yang, X. J. Wu, Z. Fan, Z. Luo, J. Chen, X. Zhang and B. Chen, J. Am. Chem. Soc., 2015, 137, 1444–1447 CrossRef CAS PubMed
.
- B. Lim, H. Kobayashi, T. Yu, J. Wang, M. J. Kim, Z. Y. Li, M. Rycenga and Y. Xia, J. Am. Chem. Soc., 2010, 132, 2506–2507 CrossRef CAS PubMed
.
- B. Lim, J. Wang, P. H. Camargo, C. M. Cobley, M. J. Kim and Y. Xia, Angew. Chem., Int. Ed., 2009, 48, 6304–6308 CrossRef CAS PubMed
.
- Y. Wang, Y. G. Chen, C. Y. Nan, L. L. Li, D. S. Wang, Q. Peng and Y. D. Li, Nano Res., 2015, 8, 140–155 CrossRef CAS
.
- B. Y. Xia, H. B. Wu, N. Li, Y. Yan, X. W. Lou and X. Wang, Angew. Chem., Int. Ed., 2015, 54, 3797–3801 CrossRef CAS PubMed
.
- B. Y. Xia, H. B. Wu, X. Wang and X. W. Lou, J. Am. Chem. Soc., 2012, 134, 13934–13937 CrossRef CAS PubMed
.
- X. Qiang and M. Chandra, J. Power Sources, 2006, 163, 364–370 CrossRef
.
- Y. Sun, B. Mayers and Y. Xia, Adv. Mater., 2010, 15, 641–646 CrossRef
.
- Y. Liu and Q. Zhao, Appl. Surf. Sci., 2004, 228, 57–62 CrossRef CAS
.
- K. Tang, J. Zhu, Y. Ye, Y. Tang and L. Chen, RSC Adv., 2016, 6, 111415–111420 RSC
.
- H. Guo, Y. Chen, H. Ping, J. Jin and D. L. Peng, Nanoscale, 2013, 5, 2394–2402 RSC
.
- V. Nandwana, K. E. Elkins, N. Poudyal, G. S. Chaubey, A. Kazuaki Yano and J. P. Liu, J. Phys. Chem. C, 2007, 111, 4185–4189 CAS
.
- B. N. Wanjala, R. Loukrakpam, J. Luo, P. N. Njoki, D. Mott, C. J. Zhong, M. Shao, L. Protsailo and T. Kawamura, J. Phys. Chem. C, 2011, 114, 17580–17590 Search PubMed
.
- Q. Zhang, J. Xie, Y. Yu and J. Y. Lee, Nanoscale, 2010, 2, 1962–1975 RSC
.
- D. Alloyeau, C. Ricolleau, C. Mottet, T. Oikawa, C. Langlois, Y. L. Bouar, N. Braidy and A. Loiseau, Nat. Mater., 2009, 8, 940–946 CrossRef CAS PubMed
.
- H. Guo, Y. Chen, H. Ping, L. Wang and D.-L. Peng, J. Mater. Chem., 2012, 22, 8336–8344 RSC
.
- M. Wang, L. Wang, H. Li, W. Du, M. U. Khan, S. Zhao, C. Ma, Z. Li and J. Zeng, J. Am. Chem. Soc., 2015, 137, 14027–14030 CrossRef CAS PubMed
.
- S. M. Foiles, M. I. Baskes and M. S. Daw, Phys. Rev. B: Condens. Matter Mater. Phys., 1986, 33, 7983–7991 CrossRef CAS
.
- R. J. V. Zee and W. Weltner Jr, J. Chem. Phys., 1990, 92, 6976–6977 CrossRef
.
- D. Li and S. Komarneni, J. Am. Ceram. Soc., 2006, 89, 1510–1517 CrossRef CAS
.
- A. R. Denton and N. W. Ashcroft, Phys. Rev. A, 1991, 43, 3161–3164 CrossRef CAS
.
- J. Kim, Y. Park, T. H. Yoon, C. S. Yoon and K. Choi, Aquat. Toxicol., 2010, 97, 116–124 CrossRef CAS PubMed
.
- A. Zane, C. Mccracken, D. A. Knight, W. J. Waldman and P. K. Dutta, J. Phys. Chem. C, 2015, 118, 22258–22267 Search PubMed
.
- S. Zhou, Z. Ma, H. Yin, Z. Wu, B. Eichhorn, S. H. Overbury and S. Dai, J. Phys. Chem. C, 2009, 113, 5758–5765 CAS
.
- A. Gangula, R. Podila, M. Ramakrishna, L. Karanam, C. Janardhana and A. M. Rao, Langmuir, 2015, 27, 15268–15274 CrossRef PubMed
.
- B. J. Borah and P. Bharali, J. Mol. Catal. A: Chem., 2014, 390, 29–36 CrossRef CAS
.
- P. Liu and M. Zhao, Appl. Surf. Sci., 2009, 255, 3989–3993 CrossRef CAS
.
- S. Wunder, F. Polzer, Y. Lu, Y. Mei and M. Ballauff, J. Phys. Chem. C, 2010, 114, 8814–8820 CAS
.
- Y. C. Chang and D. H. Chen, J. Hazard. Mater., 2009, 165, 664–669 CrossRef CAS PubMed
.
- S. Sarkar, A. K. Sinha, M. Pradhan, M. Basu, Y. Negishi and T. Pal, J. Phys. Chem. C, 2016, 115, 1659–1673 Search PubMed
.
- X. Ni, Q. Zhao, D. Zhang, A. Xiaojun Zhang and H. Zheng, J. Phys. Chem. C, 2006, 111, 601–605 CrossRef
.
- R. Krishna, D. M. Fernandes, J. Ventura, C. Freire and E. Titus, Int. J. Hydrogen Energy, 2016, 41, 11608–11615 CrossRef CAS
.
- F. Zhao, W. Kong, Z. Hu, J. Liu, Y. Zhao and B. Zhang, RSC Adv., 2016, 6(82), 79028–79036 RSC
.
- S. Xu, H. Li, L. Wang, Q. Yue, R. Li, Q. Xue, Y. Zhang and J. Liu, Eur. J. Inorg. Chem., 2015, 2015(28), 4731–4736 CrossRef CAS
.
- J. Yang, X. Shen, Z. Ji, H. Zhou, G. Zhu and K. Chen, Appl. Surf. Sci., 2014, 316(1), 575–581 CrossRef CAS
.
Footnote |
| † Electronic supplementary information (ESI) available. See DOI: 10.1039/c7ra06062a |
| This journal is © The Royal Society of Chemistry 2017 |

