 Open Access Article
Creative Commons Attribution 3.0 Unported Licence
Fabrication of hydrochar functionalized Fe–Mn binary oxide nanocomposites: characterization and 17β-estradiol removal†
Qimeng Ningabc,
Yunguo Liu ac,
Shaobo Liu*d,
Luhua Jiangac,
Guangming Zeng
 ac,
Zhiwei Zengabc,
Xiaohua Wangabc,
Jiang Li*ac and
Zulhumar Kareac
aCollege of Environmental Science and Engineering, Hunan University, Changsha 410082, P. R. China. E-mail: lijiang1304@163.com; liuyunguo_hnu@163.com; Fax: +86 731 88822829; Tel: +86 731 88649208
bCollege of Architecture and Urban Planning, Hunan City University, Yiyang 413000, P. R. China
cKey Laboratory of Environmental Biology and Pollution Control, Hunan University, Ministry of Education, Changsha 410082, P. R. China
dSchool of Metallurgy and Environment, Central South University, Changsha 410083, P. R. China. E-mail: liushaobo23@aliyun.com
First published on 26th July 2017
Abstract
In this work, Fe–Mn binary oxide modified hydrochar (hydrochar-FMBO) was successfully prepared by deposition of Fe–Mn binary oxide (FMBO) nanoparticles on pristine hydrochar. The as-prepared sample was characterized for its physicochemical properties and employed as an adsorbent for 17β-estradiol (E2) removal from water. The characterization results indicated that nano-sized FMBO particles deposited on the hydrochar matrix. For bath experiments, hydrochar-FMBO showed an excellent E2 adsorption capacity (49.77 mg g−1), which was much higher than the known reported-adsorbents. The adsorption kinetic studies demonstrated that the adsorption of E2 on hydrochar-FMBO was well fitted by the pseudo-second-order kinetic model. Besides, adsorption of E2 on hydrochar-FMBO was a rather complex process involving intraparticle diffusion. In addition, the exhausted hydrochar-FMBO could be regenerated and restored to 83% of its initial capacity in the fifth cycle. Relative mechanistic analyses for the adsorption processes were also provided in this article. These results demonstrated that the modified hydrochar could be efficiently utilized as a high-performance sustainable material for organic contaminants removal.
1. Introduction
The shortage of freshwater resources and increasing water consumption continue to place pressure on the world's water supply.1 Therefore, a large number of water recycling and desalination processes have been applied in the region of substantial water shortfall.2 The current usage patterns of recycled water for drinking water in some areas have already aroused attention on the risk of recycled water for direct human drinking.3 Such attention derives from the fact that domestic sewage, as one of the origins of recirculation water, is considered as the carrier of viruses, bacteria, and organic and inorganic chemicals causing health risks after ingestion of these water pollutants in recycled water.4Recently, a lot of published literature has revealed that municipal wastewater treatment plants (WWTPs) effluents often contain elevated levels of steroid estrogens contaminants. 17β-Estradiol (E2), as one of steroid estrogens contaminants, can block or mimic the activity of natural hormones even at such low concentrations as ng L−1 resulting in interfering with the reproductive systems of humans.5–7 It has been listed in the “Drinking Water Contaminant Candidate List 3” by the US Environmental Protection Agency (EPA).8 As reported, E2 can be eliminated through physical, chemical and biological techniques.9 Removal of E2 at high concentration is achieved by physical or chemical methods, including adsorption by graphene, carbon nanotubes, activated carbon or zeolites,10–15 membrane filtration,16 photocatalysis,17 advanced oxidation,18 solvent extraction.19 Although above methods exhibit excellent treatment performance, it appears that some disadvantages, such as high cost of explored adsorbents, photocatalysts and oxidation reagents, easily blockage of the membrane, disposal of toxic residues in solvent extraction, may limit their further applications. Biological processes (i.e. the conventional activated sludge treatment, membrane bioreactor, biofilm reactor, and sequencing batch reactor) are the most extensively used and economical alternatives in E2 containing wastewater treatment.9 Nevertheless, these processes cannot treat E2 contaminant at high concentration successfully due to the inhibitory growth effect on microorganisms leading to low bioavailability.20
Hydrochar, a carbon-rich product similar to biochar, is obtained by hydrothermal carbonization of biomass residual with high moisture content under relatively mild temperature (180–250 °C) and saturated pressure (autogenous or provided by a gas) for several hours.21 Recently, the conversion of biomass residue into hydrochar has attracted considerable interest because of its potential for carbon sequestration, adsorbent, container nursery, fuel, and even soil additive.22 In comparison with biochar, major advantages of hydrochar are converting wet waste biomass into solids without the need for energy-intensive drying before and during the carbonization process; besides, this simple carbonization process results in higher yield of solid containing a large amount of functional groups, and fewer noxious gases emission.23,24 Unfortunately, one shortcoming of hydrochar is its low surface area and poor porosity, hindering its environmental application.25 Even so, the adsorption performance of hydrochar can be considerably enhanced upon surface modification. For instance, Khataee et al. synthesized Fe3O4-loaded coffee waste hydrochars by liquid-phase; and this hydrochar exhibited high acid red 17 adsorption capability due to increased specific surface area (from 17.2 to 34.7 m2 g−1) after loading of Fe3O4 nanoparticle.26 Recently, Fe–Mn binary oxide (FMBO) nanoparticle has elicited great interests for adsorptive removal of emerging contaminants from water due to its relatively large surface area and high activities caused by size-qualification effect.27–29 FMBO has been successfully coated in clay minerals and graphenes for removal of heavy metals and organic compounds.30–32 To the best of our knowledge, however, no information has been paid to embedding FMBO in hydrochar.
In this work, we synthesized FMBO modified hydrochar through a facile in situ chemical deposition. Scanning electron microscopy (SEM), energy-dispersive X-ray spectroscopy (EDX), X-ray diffraction (XRD), Fourier transform-infrared (FT-IR) spectroscopy, nitrogen Brunauer–Emmett–Teller (BET) surface area was used to characterize the structural differences between the hydrochar and hydrochar-FMBO. Adsorption behaviors of E2 onto hydrochar-FMBO were then studied. The influences of the initial solution pH, ionic strength, and natural organic matter (NOM) on E2 adsorption were also investigated. Furthermore, the renewability of hydrochar-FMBO was also evaluated.
2. Materials and methods
2.1 Materials
KMnO4, FeCl2, NaOH, HCl, NaCl, and humic acid (HA) were supplied by Sinopharm Chemical Reagent Co., Ltd. (Shanghai, China) and all the chemicals were of analytical grade or higher. The water used in the experiment is ultrapure water (18.25 MΩ cm−1) generated by Millipore Milli-Q water purification system. E2 (98%) was purchased from Sigma-Aldrich Chemical Corporation (USA). E2 stock solution was prepared by using dissolving E2 in methanol and the desired concentrations were obtained by dissolution of stock solutions in ultrapure water and successive dilutions.2.2 Preparation of hydrochar-FMBO nanocomposites
Hydrochar was prepared from rice husk using hydrothermal treatment. The rice husk used in this work was supplied by the farms locally in Yiyang City, Hunan Province, China. Simply, about 15.00 g of wet rice husk (13.21 g of dry mass) was added into a stainless steel reactor (200 mL) followed by adding 90 mL ultrapure water. Then, the reactor heated at 200 °C for 6 h. Afterwards, the reactor was cooled down to room temperature under ambient conditions. After filtration, hydrochar was extensively washed with ultrapure water and dried in an oven at 90 °C for 24 h.Hydrochar-FMBO nanocomposites were prepared through the following procedure. Firstly, two working solutions, namely 0.85 mM KMnO4 and 1.785 mM FeCl2, were prepared. Then, above prepared hydrochar (150 mg) was transferred to 100 mL FeCl2 solution in a 250 mL glass beaker with 30 min vigorous magnetic stirring. After that, 70 mL KMnO4 solution was added slowly over 10 min under vigorous stirring, and then the pH of the suspension was adjusted to 7–8 through 1 M NaOH. After continuous stirring for another 30 min, the obtained hydrochar-FMBO nanocomposites were grown for 1 d at room temperature. Then the hydrochar-FMBO nanocomposites were washed with ultrapure water for several times, and vacuum dried finally.33
2.3 Characterization
The BET surface area of the samples was determined by nitrogen adsorption at −196 °C using a Micromeritics Tristar II 3020 apparatus (USA). The microscopy measurements of the samples were examined by using SEM (Zeiss EVO MA10, Germany) operated at 2 kV, and surface elemental analysis was also determined simultaneously at the same spot via EDX (Oxford Instruments Link ISIS) along with SEM. The XRD patterns of the samples were recorded on an X-ray diffractometer equipped with a Cu Kα radiation (λ = 0.154 nm) at a voltage of 40 kV and a current of 30 mA. FT-IR studies were performed by a spectrophotometer (Nicolet 5700 Spectrometer) in wavenumber ranges of 400–4000 cm−1 using the KBr pellet technique. The zeta potential analysis of the samples in water at pH 3.0–12.0 (adjusted by NaOH or HCl) was examined using a zeta potential meter (Zetasizer Nano-ZS90, Malvern).2.4 Batch adsorption studies
For bath experiments, 5 mg of hydrochar-FMBO was added into 100 mL E2 solution in 200 mL Erlenmeyer flasks and then mixed well for a fixed time at 28 °C using a temperature controlled water bath shaker with 160 rpm. To examine the adsorption kinetics, E2 solutions (0.8 mg L−1 and 6 mg L−1) were used in a determined contact time intervals (from 5 min to 48 h). To obtain adsorption isotherms, different E2 solution concentrations (from 0.2 to 8 mg L−1) were mixed with 5 mg sample and shaken for 24 h (sufficient to reach adsorption equilibrium). The effect of pH on E2 adsorption was studied by conducting experiments at different pH values (3–12) with the initial E2 concentration of 6 mg L−1 (100 mL). The pH of the solutions was adjusted by using negligible NaOH (1 mol L−1) or/and HCl (1 mol L−1) solution. The effect of ionic strength on E2 adsorption was also investigated by varying the NaCl concentration from 0.001 to 1 M in 6 mg L−1 initial E2 concentration (100 mL). The influence of HA on E2 adsorption was examined through varying the HA concentration from 0.1 to 1 mg L−1 in 100 mL E2 initial concentration (6 mg L−1).After that, the flasks were withdrawn and the suspensions were immediately filtered through 0.45 μm syringe filter (polytetrafluoroethylene, hydrophobic). The E2 concentrations in the liquid phase samples were examined by using an F-4500 fluorescence spectrophotometer (Hitachi, Japan) as described in our previously published literatures.13,15 E2 concentrations on the solid phase were calculated on the basis of initial and final aqueous concentrations. All the tests were performed in duplicate, and the average values were reported.
3. Results and discussion
3.1 Textural properties of hydrochar-FMBO nanocomposites
Fig. 1 illustrates the SEM images of the hydrochar and hydrochar-FMBO nanocomposites. It is clearly that the stonelike or flowerlike nano-sized FMBO particles were deposited across the surface of the hydrochar; the morphologies of the hydrochar-FMBO nanocomposites were rough and porous because of the intrinsic nature of hydrochar. The result of EDS analysis revealed that the hydrochar-FMBO nanocomposites consisted of carbon, oxygen, iron, and manganese. Impurities, including sodium and silicon, were also identified by the EDS, which are common for hydrochar.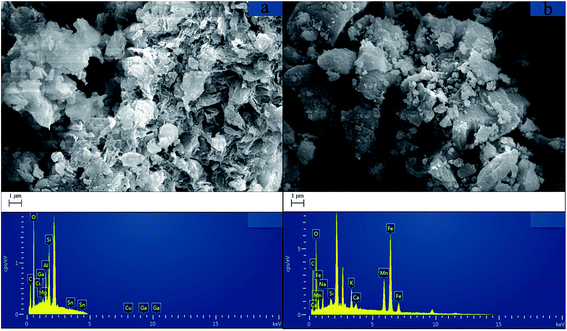 | ||
| Fig. 1 (a) SEM image and EDS analysis of hydrochar and (b) SEM image and EDS analysis of hydrochar-FMBO. | ||
The XRD patterns of the raw hydrochar and the hydrochar-FMBO nanocomposites are exhibited in Fig. S1,† respectively. For raw hydrochar, the major crystalline phases were quartz and calcium oxalate; the same shape was also observed in another hydrochar prepared by Salix psammophila.34 Comparatively, the hydrochar-FMBO nanocomposites showed poorly ordered two-line ferrihydrite pattern with two significant peaks at 30.5° and 63.4°, indicating the presence of FMBO particles in the hydrochar surfaces.33
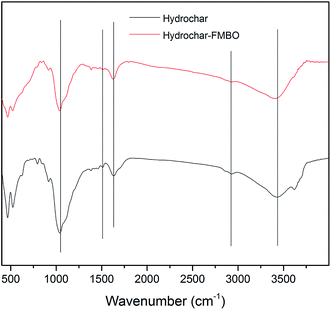
FT-IR spectrums of the raw hydrochar and the hydrochar-FMBO nanocomposites are shown in Fig. 2. Generally, raw hydrochar is rich in functional groups containing oxygen, and aromatic components. As seen, the absorption peak around 3437 cm−1 was attributed to O–H stretching vibrations; the peak around 2922 cm−1 corresponded to C–H stretching vibrations; the band around 1631 cm−1 was assigned to C![[double bond, length as m-dash]](https://www.rsc.org/images/entities/char_e001.gif) O functional groups; the adsorption band observed at 1508 cm−1 represented aromatic C
O functional groups; the adsorption band observed at 1508 cm−1 represented aromatic C![[double bond, length as m-dash]](https://www.rsc.org/images/entities/char_e001.gif) C, and the peak around 1042 cm−1 was ascribed to C–O bending vibrations. These results were consistent with the relevant peaks in hydrochar derived from other raw materials.35,36 After coating, it is noteworthy that the O–H stretching bond shifted from 3437 cm−1 to 3415 cm−1, indicating the formation of enhanced strength of intermolecular hydrogen bonds between hydrochar and FMBO nanoparticles surface.30
C, and the peak around 1042 cm−1 was ascribed to C–O bending vibrations. These results were consistent with the relevant peaks in hydrochar derived from other raw materials.35,36 After coating, it is noteworthy that the O–H stretching bond shifted from 3437 cm−1 to 3415 cm−1, indicating the formation of enhanced strength of intermolecular hydrogen bonds between hydrochar and FMBO nanoparticles surface.30
The surface area and the porosity of the raw hydrochar and the hydrochar-FMBO nanocomposites are listed in Table 1. Noticeably, the BET surface area (SSABET) of the hydrochar-FMBO nanocomposites was higher compared to that of the hydrochar (3.7-fold), indicating that additional surface area for adsorption might be produced after the immobilization of the FMBO nanoparticles on the hydrochar surfaces. Furthermore, the total pore volume (PVT) of the hydrochar-FMBO was slightly higher than that of hydrochar, which might be ascribed to the entry of the FMBO nanoparticles in some of the macro-/mesopores. Nevertheless, its micropore volume (PVmic) was found to increase from 0.019 cm3 g−1 to 0.065 cm3 g−1 indicating that the hydrochar-FMBO was significantly enhanced its adsorption ability.
| Sample | SSABET (cm2 g−1) | PVT (cm3 g−1) | PVmic (cm3 g−1) |
|---|---|---|---|
| Hydrochar | 44.47 | 0.118 | 0.019 |
| Hydrochar-FMBO | 167.17 | 0.141 | 0.065 |
3.2 Effect of initial pH on E2 adsorption
The pH of the solution has an important role in the adsorption since it affects both the electrostatic charges of the adsorbent and the dissociation state of the adsorbate related to its dissociation constants (pKa).37 Fig. 3a exhibits the influence of initial solution pH on the adsorption of E2 onto hydrochar-FMBO at a given experimental condition. It is clearly observed that the adsorption of E2 illustrated slight change and then remained fairly constant under the pH ranging from 3 to 9. While the pH increased beyond around 10, the adsorption of E2 gradually decreased. These results could be explained by the surface charge of the hydrochar-FMBO and the degree of dissociation of the E2 solution at various pH values. At pH > 10, the oxygen-containing functional groups were fully or partially deprotonated resulting in increasing the negative charges on the surface of the modified hydrochar. At high pH value, hydrochar-FMBO had high negative charge density as reflected by the zeta potential from Fig. 3b. Nevertheless, E2 existed as a neutral molecule when the pH < pKa and prevailed as negatively charged anion when the pH went beyond its pKa. In this work, E2 had its molecular structure when pH < 10 and tended to deprotonation form at around pH 10. Therefore, the reduced adsorption of E2 at pH > 10 might be attributed to the electrostatic repulsion occurring between the negatively charged surface of the hydrochar-FMBO and the protonated-E2. A similar result was observed in the E2 adsorption by powdered activated carbon and biochar.38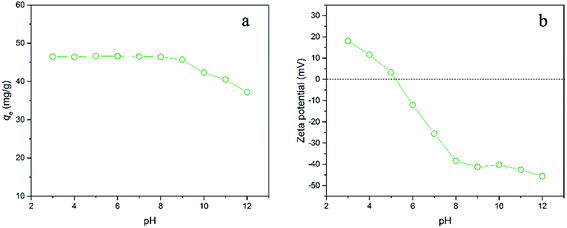 | ||
| Fig. 3 (a) Influence of initial solution pH on the adsorption of E2 onto hydrochar-FMBO (Co = 6 mg L−1, T = 28 °C, pH = 7.0); (b) zeta potentials of hydrochar-FMBO. | ||
3.3 Effect of ionic strength and humic acid on E2 adsorption
Various ionic strength levels (0.001–1 M) were adjusted by NaCl to examine the influence of ionic strength on E2 adsorption performance (Fig. 4a). It is clearly seen that increasing ionic strength resulted in a slight enhance in E2 adsorption on hydrochar-FMBO. This observation suggested that the E2 adsorption was promoted in the presence of NaCl, but it is limited. The slight increase in E2 adsorption could be ascribed to screening effect and salting-out effect. Specifically, adding salt could decrease the electrostatic repulsion between E2 and the negatively charged surface of hydrochar-FMBO because Na+ reacted with the negatively charged group of the hydrochar surface.39 Besides, Na+ also could decrease the water solubility of E2 leading to an enhance in E2 removal.40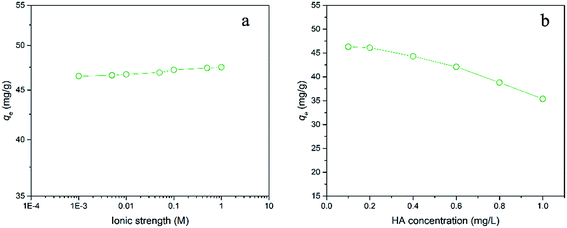 | ||
| Fig. 4 (a) Influence of ionic strength on the adsorption of E2 onto hydrochar-FMBO; (b) influence of HA concentration on the adsorption of E2 onto hydrochar-FMBO (Co = 6 mg L−1, T = 28 °C, pH = 7.0). | ||
HA was chosen as the NOM to investigate the influence of NOM on E2 adsorption because 70% of NOM is composed of HA.41 The adsorption data of E2 on the hydrochar-FMBO in the presence of HA are plotted in Fig. 4b. Results indicated that the adsorption capacity of E2 was decreased with increasing HA concentration, which might be attributed to the following several possibilities: (i) the HA molecules might directly compete with E2 for adsorption sites on the surfaces of hydrochar-FMBO because the HA had many functional groups which were feasible to simultaneously bind with the hydrochar-FMBO surfaces;38 (ii) polar functionalities on HA were favorable to form water clusters via hydrogen bond after adsorption HA, which resulted in influencing the hydrophobicity of the hydrochar-FMBO surfaces;42 (iii) it is reported that pore blockage was generally regarded as the possible mechanism influencing adsorption in the presence of NOM,43 and then HA might block some of the micropores contributing to adsorption in this study.
3.4 Adsorption kinetics
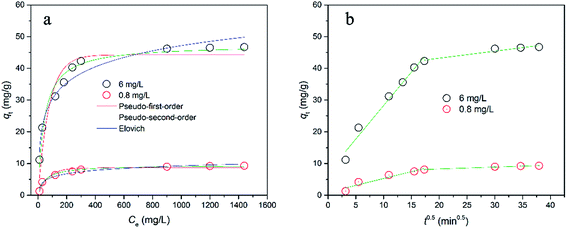
To examine the adsorption kinetics of the hydrochar-FMBO nanocomposites on E2, the effect of contact time was studied for initial concentrations of 0.8 mg L−1 and 6 mg L−1 as reflected by Fig. 5a. It is noteworthy that the adsorption exhibited a rapid initial rate, and the equilibrium time increased with the increasing initial E2 concentration. To understand the mechanism of the kinetics of E2 onto the hydrochar-FMBO, the experimental data on the E2 adsorption kinetics were modeled by the pseudo-first-order model, pseudo-second-order model, Elovich equation and Weber–Morris model models as expressed by eqn (1), (2), (3) and (4), respectively.44| qt = qe − qee−k1t | (1) |
 | (2) |
 | (3) |
| qt = kdt0.5 + L | (4) |
The pseudo-first-order and pseudo-second-order models reflect the mononuclear and binuclear adsorption associated with the adsorbent capacity, respectively; the Elovich equation is an empirical model in consideration of the contribution of desorption; Morris model models, as a general intra-particle diffusion model, is applied to investigate the rate-limiting step during the adsorption process.34 The fitting results obtained from above models are summarized in Table 2. Evidently, the pseudo-second-order model described the adsorption kinetics data better than others. It indicated that the adsorption rate depended on chemisorption, such as π–π interaction and H-bond.
| Co (mg L−1) | Pseudo-first-order model | Pseudo-second-order model | Elovich | ||||||||||||
|---|---|---|---|---|---|---|---|---|---|---|---|---|---|---|---|
| qe (mg g−1) | k1 (min−1) | R2 | RMSE | χ2 | qe (mg g−1) | k2 (g mg−1 min−1) | R2 | RMSE | χ2 | α (mg g−1 min−1) | β (g mg−1) | R2 | RMSE | χ2 | |
| 6 | 42.26 | 0.013 | 0.877 | 4.41 | 19.44 | 47.43 | 4.790 | 0.971 | 2.13 | 4.52 | 4.68 | 0.14 | 0.955 | 2.63 | 6.94 |
| 0.8 | 8.68 | 0.014 | 0.891 | 0.78 | 0.62 | 9.44 | 0.002 | 0.985 | 0.34 | 0.12 | 0.61 | 0.64 | 0.956 | 0.59 | 0.34 |
As illustrated in Fig. 5b, the plots were multi-linear related to two-step adsorption process. It is clearly seen that the intraparticle diffusion was slow and the rate limiting step. However, none of the L constants approached zero (Table S1†), suggesting that the E2 adsorption on hydrochar-FMBO was rather a complex process, where intraparticle diffusion might not exclusively govern E2 adsorption.45
3.5 Adsorption isotherm
The adsorption isotherm of E2 on hydrochar-FMBO nanocomposites was also conducted (Fig. 6). In order to clarify the adsorption characterization, two common isotherms models, namely Langmuir (eqn (5)) and Freundlich (eqn (6)) models, were used analyze the adsorption data.
 | (5) |
| qe = KFCen | (6) |
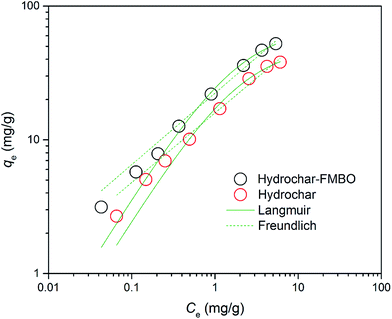 | ||
| Fig. 6 E2 adsorption isotherm data and fitted models for raw hydrochar and hydrochar modified with FMBO (T = 28 °C, pH = 7.0). | ||
The resulting regression parameters were provided in Table 3. The determination coefficient (R2) indicated that both models well fitted the experimental data, which could be attributed to the distribution of both homogeneous and heterogeneous adsorption sites on the hydrochar-FMBO surfaces. The value of qm for the adsorption of E2 onto hydrochar-FMBO was 49.77 mg g−1 and that of raw hydrochar was 38.85 mg g−1. This indicated that after modified by FMBO the adsorption ability of hydrochar was enhanced. When compared with other adsorbents (i.e. char and carbon nanotubes) reported in literature,45,47 the hydrochar-FMBO exhibited great potential for adsorptive removal of E2. The desirable adsorption capacity of hydrochar-FMBO could be ascribed to the FMBO loading which increased the BET surface area and the mount of macro-/mesopores resulting in increasing the adsorption site.
| Sample | Freundlich | Langmuir | ||||||||
|---|---|---|---|---|---|---|---|---|---|---|
| n | KF (mg1−n Ln g−1) | R2 | RMSE | χ2 | qm (mg g−1) | KL (L mg−1) | R2 | RMSE | χ2 | |
| Hydrochar | 0.52 | 15.87 | 0.982 | 2.68 | 4.87 | 38.85 | 0.50 | 0.983 | 2.33 | 4.56 |
| Hydrochar-FMBO | 0.53 | 22.31 | 0.981 | 2.85 | 5.06 | 49.77 | 0.53 | 0.985 | 1.93 | 4.12 |
To examine the favorability of the adsorption process, the isotherm was classified by the value of separation factor RL calculated based on RL = 1/(1 + KLCo). The adsorption process is favorable as the RL values between 0 and 1.48 In this study, the RL values were determined between the ranges of 0.19–0.90, demonstrating that the E2 adsorption onto hydrochar-FMBO was thermodynamically favorable processes.
3.6 Renewability evaluation
To investigate the renewability of the sorbed hydrochar-FMBO nanocomposites, experiments were performed by immersing the exhausted hydrochar-FMBO with acetone/water (1/1; v/v) solvent, due to the high octanol–water partitioning coefficient of E2 (log![[thin space (1/6-em)]](https://www.rsc.org/images/entities/char_2009.gif) Kow = 4.01) resulting in high dissolution in the organic solvent. The mixture was then agitated for 12 h (160 rpm) on a shaker. The reusability of the spent hydrochar-FMBO was evaluated by conducting five cycles of E2 adsorption/desorption (Fig. 7). The value of cycle 0 assigns to the adsorption capacity of the freshly prepared hydrochar-FMBO. It is clear that the adsorption capacity of E2 onto hydrochar-FMBO decreased as increasing the number of regeneration cycle. Nevertheless, the reduce was not huge and even after the fifth regeneration, exceeding 83% of the original adsorption capacity was maintained. This indicated that the prepared hydrochars could be an economical and efficient adsorbent for E2 elimination because of the excellent recycle performance.
Kow = 4.01) resulting in high dissolution in the organic solvent. The mixture was then agitated for 12 h (160 rpm) on a shaker. The reusability of the spent hydrochar-FMBO was evaluated by conducting five cycles of E2 adsorption/desorption (Fig. 7). The value of cycle 0 assigns to the adsorption capacity of the freshly prepared hydrochar-FMBO. It is clear that the adsorption capacity of E2 onto hydrochar-FMBO decreased as increasing the number of regeneration cycle. Nevertheless, the reduce was not huge and even after the fifth regeneration, exceeding 83% of the original adsorption capacity was maintained. This indicated that the prepared hydrochars could be an economical and efficient adsorbent for E2 elimination because of the excellent recycle performance.
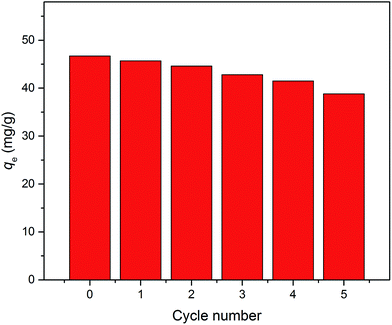 | ||
| Fig. 7 Fifth consecutive recycle of hydrochar-FMBO for E2 adsorption (Co = 6 mg L−1, T = 28 °C, pH = 7.0). | ||
3.7 Adsorption mechanism
Examining the adsorption mechanisms of pollutants on adsorbents is rather difficult due to the adsorbent–adsorbate interactions usually simultaneously influenced by various factors. It is known that the interactions can rely on the surface chemistry, textural properties, functional groups on the adsorbent, and molecular structure of pollutants.49 As reported, carbonaceous adsorbents and molecules of organic contaminant could be bound by π–π interaction, H-bond, Lewis acid-based interaction and hydrophobic interaction.50–53 Considering the molecular structure of E2 as exhibited in Fig. S3† and the functional groups of hydrochar-FMBO reflected by FT-IR spectra (Fig. 2), it could be proposed that the adsorption mechanism of E2 onto hydrochar-FMBO involved π–π interaction and H-bond. As illustrated above, various kinetic and isotherm models have been used to fit the experimental data, and the models have been interpreted to explain the obtained results. The phenomenon that the pseudo-second-order model was the best fit revealed that the chemisorption acted an important role in the E2 adsorption onto hydrochar-FMBO; besides, the initial solution pH used in work was 7.0, where the surface of hydrochar-FMBO was negatively charged (as reflected in Fig. 3b). Because the E2 molecules were neutral under this condition (as reflected in our previous literature13), the major adsorption mechanism between E2 and used adsorbent could be π–π interaction and H-bond, where the principal interaction would be between the benzene rings of E2 and the hexagonal skeleton of the hydrochar on the composites. This summary was obtained based on the adsorption mechanisms suggested by other relative adsorbents from other research groups.47,49,50 Furthermore, the micro-/mesopores of hydrochar-FMBO would be expected to promote the adsorption, since these pores provided higher capillary effect and enhanced the migration of the E2 molecule throughout the porous structure of hydrochar-FMBO.544. Conclusions
Novel hydrochar-FMBO nanocomposites were prepared by introducing FMBO nanoparticles to hydrochar surfaces. The prepared samples were analyzed by using SEM/EDX, XRD, FT-IR, and BET surface area techniques. The hydrochar-FMBO exhibited high adsorption capacity for the removal of E2 (49.77 mg g−1). In addition, the effect of solution conditions on E2 adsorption was dependent on the pH, ionic strength, and HA concentration. The facile synthesis, low cost, environmentally friendly nature, ease of regeneration, and good adsorption ability of hydrochar-FMBO nanocomposites suggested its huge potential in environmental remediation to removal organic pollutants.Acknowledgements
This research was supported by the National Natural Science Foundation of China (Grants No. 51521006 and 51609268), the Key Project of Technological Innovation in the Field of Social Development of Hunan Province, China (Grant No. 2016SK2010 and 2016SK2001), and the Hunan Provincial Innovation Foundation for Postgraduate (Grant No. CX2016B135).References
- R. B. Jackson, S. R. Carpenter, C. N. Dahm, D. M. McKnight, R. J. Naiman, S. L. Postel and S. W. Running, Ecol. Appl., 2001, 11, 1027–1045 CrossRef.
- M. S. Mohsen, Desalination, 2007, 203, 27–46 CrossRef CAS.
- J. A. Soller, M. H. Nellor, C. J. Cruz and E. McDonald, Environ. Sci.: Water Res. Technol., 2015, 1, 679–688 CAS.
- J. Han, W. Qiu, S. Meng and W. Gao, Water Res., 2012, 46, 5715–5724 CrossRef CAS PubMed.
- J. Vymazal, T. Březinová and M. Koželuh, Sci. Total Environ., 2015, 536, 625–631 CrossRef CAS PubMed.
- G. P. Pessoa, N. C. De Souza, C. B. Vidal, J. A. C. Alves, P. I. M. Firmino, R. F. Nascimento and A. B. Dos Santos, Sci. Total Environ., 2014, 490, 288–295 CrossRef CAS PubMed.
- Z. Liu, G. Lu, H. Yin, Z. Dang and B. Rittmann, Environ. Sci. Technol., 2015, 49, 5288–5300 CrossRef CAS PubMed.
- D. S. Bermudez, L. E. Gray and V. S. Wilson, Int. J. Androl., 2012, 35, 397–406 CrossRef CAS PubMed.
- C. P. Silva, M. Otero and V. Esteves, Environ. Pollut., 2012, 165, 38–58 CrossRef CAS PubMed.
- Q. Zaib, I. a. Khan, N. B. Saleh, J. R. V. Flora, Y.-G. Park and Y. Yoon, Water, Air, Soil Pollut., 2012, 223, 3281–3293 CrossRef CAS.
- H. J. Wen, J. A. Bergendahl and R. W. Thompson, Environ. Eng. Sci., 2009, 26, 319–326 CrossRef CAS.
- S. Rovani, A. G. Rodrigues, L. F. Medeiros, R. Cataluña, É. C. Lima and A. N. Fernandes, J. Environ. Chem. Eng., 2016, 4, 2128–2137 CrossRef CAS.
- L. Jiang, Y. Liu, S. Liu, X. Hu, G. Zeng, X. Hu, S. Liu, S. Liu, B. Huang and M. Li, Chem. Eng. J., 2017, 308, 597–605 CrossRef CAS.
- L. Jiang, Y. Liu, S. Liu, G. Zeng, X. Hu, X. Hu, Z. Guo, X. Tan, L. Wang and Z. Wu, Environ. Sci. Technol., 2017, 51, 6352–6359 CrossRef CAS PubMed.
- L. Jiang, Y. Liu, G. Zeng, F. Xiao, X. Hu, X. Hu, H. Wang, T. Li, L. Zhou and X. Tan, Chem. Eng. J., 2016, 284, 93–102 CrossRef CAS.
- T. Urase, C. Kagawa and T. Kikuta, Desalination, 2005, 178, 107–113 CrossRef CAS.
- G. L. Puma, V. Puddu, H. K. Tsang, A. Gora and B. Toepfer, Appl. Catal., B, 2010, 99, 388–397 CrossRef.
- M. Brienza, M. M. Ahmed, A. Escande, G. Plantard, L. Scrano, S. Chiron, S. A. Bufo and V. Goetz, Chem. Eng. J., 2014, 257, 191–199 CrossRef CAS.
- S. M. Havens, C. J. Hedman, J. D. C. Hemming, M. G. Mieritz, M. M. Shafer and J. J. Schauer, J. Agric. Chem. Environ., 2014, 03, 103–120 Search PubMed.
- K. S. Kornman and W. J. Loesche, Infect. Immun., 1982, 35, 256–263 CAS.
- A. K. Catalkopru, I. C. Kantarli and J. Yanik, Bioresour. Technol., 2017, 226, 89–93 CrossRef PubMed.
- Y. Liu, S. Yao, Y. Wang, H. Lu, S. K. Brar and S. Yang, Bioresour. Technol., 2017, 235, 332–337 CrossRef CAS PubMed.
- M. M. Titirici, R. J. White, C. Falco and M. Sevilla, Energy Environ. Sci., 2012, 5, 6796–6822 Search PubMed.
- S. M. Alatalo, E. Repo, E. Mäkilä, J. Salonen, E. Vakkilainen and M. Sillanpää, Bioresour. Technol., 2013, 147, 71–76 CrossRef CAS PubMed.
- L. Yu, C. Falco, J. Weber, R. J. White, J. Y. Howe and M. M. Titirici, Langmuir, 2012, 28, 12373–12383 CrossRef CAS PubMed.
- A. Khataee, B. Kayan, D. Kalderis, A. Karimi, S. Akay and M. Konsolakis, Ultrason. Sonochem., 2017, 35, 72–80 CrossRef CAS PubMed.
- G. Zhang, F. Liu, H. Liu, J. Qu and R. Liu, Environ. Sci. Technol., 2014, 48, 10316–10322 CrossRef CAS PubMed.
- W. Xie, Q. Liang, T. Qian and D. Zhao, Water Res., 2015, 70, 485–494 CrossRef CAS PubMed.
- M. Szlachta and N. Chubar, Chem. Eng. J., 2013, 217, 159–168 CrossRef CAS.
- T. A. Khan and E. A. Khan, Appl. Clay Sci., 2015, 107, 70–77 CrossRef CAS.
- J. Zhu, Z. Lou, Y. Liu, R. Fu, S. A. Baig and X. Xu, RSC Adv., 2015, 5, 67951–67961 RSC.
- S. Kong, Y. Wang, Q. Hu and A. K. Olusegun, Colloids Surf., A, 2014, 457, 220–227 CrossRef CAS.
- Z. Yan, Y. Liu, X. Tan, S. Liu, G. Zeng, L. Jiang, M. Li, Z. Zhou, S. Liu and X. Cai, Chem. Eng. J., 2017, 314, 612–621 CrossRef CAS.
- X. Zhu, Y. Liu, F. Qian, C. Zhou, S. Zhang and J. Chen, Bioresour. Technol., 2014, 154, 209–214 CrossRef CAS PubMed.
- K. Tekin, S. Karagöz and S. Bektaş, Renewable Sustainable Energy Rev., 2014, 40, 673–687 CrossRef CAS.
- Y. Li, A. Meas, S. Shan, R. Yang and X. Gai, Bioresour. Technol., 2016, 207, 379–386 CrossRef CAS PubMed.
- S. Bele, V. Samanidou and E. Deliyanni, Chem. Eng. Res. Des., 2016, 109, 573–585 CrossRef CAS.
- E. Kim, C. Jung, J. Han, N. Her, C. M. Park, M. Jang, A. Son and Y. Yoon, J. Ind. Eng. Chem., 2016, 36, 364–371 CrossRef CAS.
- M. A. Fontecha-Cámara, M. V. López-Ramón, M. A. Alvarez-Merino and C. Moreno-Castilla, Langmuir, 2007, 23, 1242–1247 CrossRef PubMed.
- Y. Zhou, P. Lu and J. Lu, Carbohydr. Polym., 2012, 88, 502–508 CrossRef CAS.
- X. Zhu, Y. Liu, C. Zhou, S. Zhang and J. Chen, ACS Sustainable Chem. Eng., 2016, 2, 969–977 CrossRef.
- L. Lou, F. Liu, Q. Yue, F. Chen, Q. Yang, B. Hu and Y. Chen, Appl. Geochem., 2013, 33, 76–83 CrossRef CAS.
- G. Newcombe, J. Morrison, C. Hepplewhite and D. R. U. Knappe, Carbon, 2002, 40, 2147–2156 CrossRef CAS.
- A. A. Idowu, O. Sunday and K. S. Olateju, J. Environ. Biotechnol. Res., 2016, 3, 1–11 Search PubMed.
- S. Patel, J. Han and W. Gao, J. Environ. Chem. Eng., 2015, 3, 1562–1569 CrossRef CAS.
- E. Wibowo, M. Rokhmat and M. Abdullah, Desalination, 2017, 409, 146–156 CrossRef CAS.
- F. Wang, W. Sun, W. Pan and N. Xu, Chem. Eng. J., 2015, 274, 17–29 CrossRef CAS.
- N. Zhou, H. Chen, J. Xi, D. Yao, Z. Zhou, Y. Tian and X. Lu, Bioresour. Technol., 2017, 232, 204–210 CrossRef CAS PubMed.
- A. L. Cazetta, O. Pezoti, K. C. Bedin, T. L. Silva, A. Paesano Junior, T. Asefa and V. C. Almeida, ACS Sustainable Chem. Eng., 2016, 4, 1058–1068 CrossRef CAS.
- R. A. Reza and M. Ahmaruzzaman, RSC Adv., 2015, 5, 10575–10586 RSC.
- X. Tan, Y. Liu, G. Zeng, X. Wang, X. Hu, Y. Gu and Z. Yang, Chemosphere, 2015, 125, 70–85 CrossRef CAS PubMed.
- P. W. Seo, N. A. Khan, Z. Hasan and S. H. Jhung, ACS Appl. Mater. Interfaces, 2016, 8, 29799–29807 CAS.
- M. Li, Y. Liu, G. Zeng, S. Liu, X. Hu, D. Shu, L. Jiang, X. Tan, X. Cai and Z. Yan, J. Colloid Interface Sci., 2017, 485, 269–279 CrossRef CAS PubMed.
- Y. Dong, H. Lin and F. Qu, Chem. Eng. J., 2012, 193, 169–177 CrossRef.
Footnote |
| † Electronic supplementary information (ESI) available. See DOI: 10.1039/c7ra06065c |
| This journal is © The Royal Society of Chemistry 2017 |

