 Open Access Article
Creative Commons Attribution 3.0 Unported Licence
The peak shift and evolution of upconversion luminescence from CsPbBr3 nanocrystals under femtosecond laser excitation
Qiuju Han ab,
Wenzhi Wu
 c,
Weilong Liu
 a and
Yanqiang Yang
 *a
*a
aDepartment of Physics, Harbin Institute of Technology, Harbin, Heilongjiang 150001, China. E-mail: yqyang@hit.edu.cn
bSchool of Science, Northeast Agricultural University, Harbin, Heilongjiang 150030, China
cSchool of Electronic Engineering, Heilongjiang University, Harbin, Heilongjiang 150080, China
First published on 19th July 2017
Abstract
The luminescent characteristics of CsPbBr3 nanocrystals in n-hexane are investigated by the use of steady-state/time-resolved photoluminescence and transient absorption spectroscopy. Compared with normal luminescence, a redshift of the upconversion luminescence (UCL) spectrum under 800 nm femtosecond laser excitation is observed. Time-resolved PL and TA spectroscopy under near-infrared femtosecond laser excitation demonstrate that the full width at half maximum and peak position are changed at various delay times, suggesting the existence of more than a single excited state. It is found that UCL is composed of a photoinduced surface-trapping and a band-edge excitonic state, causing the observed biexponential dynamics. We conclude that the redshift of the emission peak is caused by the relative change in luminescent intensity between excitonic and trapping states.
1. Introduction
Halide perovskite nanocrystals (NCs) have attracted intensive attention due to their strikingly high light-harvesting efficiency in solar energy applications and their function as light-absorbing direct-bandgap semiconductor materials in the last several years.1–3 Furthermore, these new NCs are also found to be excellent light-emitting materials, manifesting unique performance in electrically driven light-emitting diodes (LEDs), optically pumped lasers and quantum dot displays.4–7 Halide perovskite semiconductor NCs have recently been synthesized to further promote their optoelectronic performance with the aid of the quantum confinement effect, which ensures superior photoluminescence quantum yield (PLQY) stabilized by ligands.8 Stable excitons or hole–electron pairs are created in cesium-based perovskite NCs at room temperature even under low-intensity light excitation, and they present high PLQY of up to 90% without any further surface treatments.6 Upconversion luminescence (UCL) is a well-known phenomenon that refers to nonlinear optical processes based on the sequential absorption of two or more photons through virtual or real intermediate energy states, leading to emission of higher energy photons than the excitation photons. This is in contrast to normal photoluminescence (PL), where the emission wavelength has lower energy than the excitation wavelength.9 The peak shift of PL spectra between normal luminescence and UCL is observed in most of II–VI NCs10 and is explained by a two-state intensity-dependent model.11 The UCL of NCs is mostly attributed to sub-band gap surface, metastable, or intermediate states;12 furthermore, in order to achieve high PLQY, the concentration of the trap/defect states should be low to minimize nonradiative recombination. Two-photon excitation technique, a promising optical method, can be used to investigate the luminescent property of halide perovskite NCs, which are responsible for UCL under strong laser excitation. Amplified spontaneous emission from cesium-based perovskite NC films on substrate is observed under two-photon laser excitation.3,5,13 Due to the highly ionic nature and good stoichiometry of halide perovskite NCs, point defects are not likely to reside within the volume of perovskite NCs.14 However, the capping agent (e.g. octadecylamine, ODA) is likely to replace the organic or inorganic cation in the perovskite NCs, causing lattice disorder and surface-related trapping states at the surface region.15,16 In the electronic structure calculation of cesium lead halide perovskite NCs, shallow surface trapping state would arise from a lead-rich surface.17,18 Compared with normal luminescence, a redshift of UCL peak position in CsPbBr3 NC solution or film can be easily observed.5,13,19 There are scarce reports on the origin of emission peak shift between normal luminescence and UCL of CsPbBr3 NCs. The nature of the trapping state needs to be systematically explored and further understood.In this study, UCL of CsPbBr3 NCs in n-hexane is investigated comparatively by the use of steady-state/time-resolved PL and transient absorption (TA) spectroscopy under femtosecond laser excitation. The change in spectra and lifetimes of transition components are observed and discussed. Time- and spectral-resolved data can give more information to illuminate the mechanism of peak shift between normal luminescence and UCL in CsPbBr3 NCs. Based on these experimental results, we intend to use an intensity-dependent energy level model to interpret the shift of the UCL emission peak in CsPbBr3 NCs.
2. Experimental
2.1. Synthesis and preparation
CsPbBr3 NCs are synthesized with a hot-injection approach. Oleylamine and oleic acid are injected at 120 °C under N2 condition. PbBr2 and octadecene are loaded into a 50 mL 3-necked flask and degassed at 120 °C for 30 min. After complete solubilisation of PbBr2 salt, the temperature is raised to 160 °C. Cs-oleate solution is obtained by dissolving CsCO3 in octadecene and oleic acid at 150 °C, which is then quickly injected into the mixture. After 5 seconds, the reaction mixture is cooled using an ice-water bath, and CsPbBr3 NCs in n-hexane are readily obtained. The PLQY of the CsPbBr3 NCs is higher than 80%. High-resolution transmission electron microscope (TEM) measurement is performed on a Tecnai G220 S-Twin microscope operating at a high voltage of 200 kV. We collected the ground-state absorption spectrum of CsPbBr3 NCs on a Persee TU-190 vis/NIR spectrometer.2.2. Experimental sections
A femtosecond Ti: sapphire regenerative amplifier (Coherent, Legend) produces ∼120 fs pulses at 1.55 eV (800 nm) and 1 kHz. A second harmonic β-barium borate (BBO) crystal is used to double the photon energy of the laser pulse to 3.10 eV (400 nm), after which a band-pass filter is used to block the residual laser beam at 1.55 eV.3. Results and discussion
3.1. Optical and structural characterization
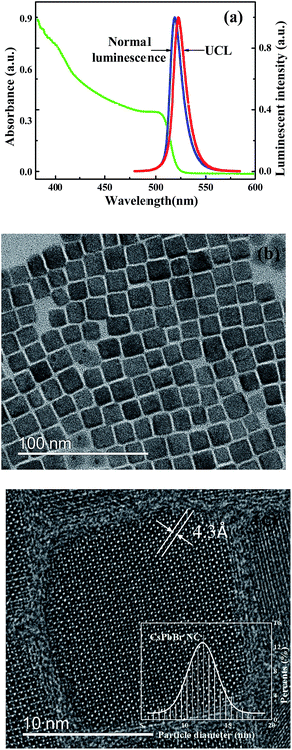
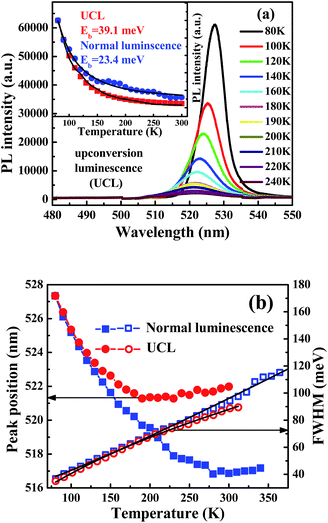
The CsPbBr3 NCs in n-hexane have their first absorption peaks at 506 nm, which corresponds to the band-edge excitonic absorption, as shown in Fig. 1(a). The peaks are blue shifted from the energy gap of bulk CsPbBr3 material at 551 nm.20 Electronic transitions in the centers of CsPbBr3 NCs couple to vibrations, which result in a broadening of absorption and emission bands as well as a Stokes shift (15 nm).21 A bathochromic effect is shown in the luminescence spectra. The redshift of the emission peaks is about 13 meV (3 nm) between the 800 nm and 400 nm femtosecond laser excitation. The location of the emission peak does not change with various laser intensities, but a redshift is observed at various excitation wavelengths for CsPbBr3 NCs in close-packed films5 and toluene.19 A shift of the emission peak is observed. Some researchers think the slight redshift of two-photon excitation can be ascribed to the reabsorption effect and the size distribution for traditional II–VI NCs22 and carbon quantum dots. The following mechanism of reabsorption is demonstrated: an incoming photon with energy of hν0 is absorbed by a smaller NC in the solution, and after a delay, this excited NC emits a second photon with a smaller energy of hν1 due to the Stokes shift. This photon is then absorbed by a larger NC in the solution; after a similar delay, this NC emits a third photon with an even smaller energy of hν2, and this photon will escape from the solution and contribute to the measured PL. The frequent occurrence of photon reabsorption results in a decrease in the emission of the smaller NCs and an increase in the emission of the larger ones.23 In other words, the emission peak wavelength in time-resolved PL spectroscopy should have a redshift with a longer delay time. Transmission electronic microscopy (TEM) images of the perovskite QDs are presented in Fig. 1(b). Fig. 1(c) shows the TEM image of an individual perovskite CsPbBr3 NC with the lattice fringe of 4.3 Å. Because of their deviation from cubic shape, the sizes of CsPbBr3 NCs measured along their edges are 12.0 nm, which is consistent with the curve calculated using effective mass approximation.6 The band gap of the sample is 2.45 eV at room temperature. Meanwhile, full widths at half maximum (FWHMs) of the PL spectra are ∼20 nm.24,25The variation in the UCL spectra of CsPbBr3 NC films is examined the under excitation wavelength of 800 nm at various temperatures in the range 80–240 K, as shown in Fig. 2(a). The NC films exhibit a decrease in the PL intensity with increasing temperature. Besides, the peak energies of these NC films shift to the higher energy side, and the PL emission linewidths significantly increase with increasing temperature. The UCL intensity gradually decreases with increasing the temperature to 300 K, indicating thermal quenching of UCL emission. The intensities of UCL and normal luminescence as a function of temperature are fitted as shown in Fig. 2(b) by using the Arrhenius equation,26,27 I(T) = I0/(1 + A![[thin space (1/6-em)]](https://www.rsc.org/images/entities/char_2009.gif) exp(Eb/kBT)), in which I0 is the intensity at 80 K, A is a constant related to the ratio between the radiative and nonradiative lifetimes, Eb is the thermal quenching energy, and kB is the Boltzmann constant. The obtained thermal quenching energy of UCL is 39.1 meV, which is bigger than that of normal luminescence at 23.4 meV. The thermal quenching energy can be considered to be the exciton binding energy if no other nonradiative decay channel is in the exciton recombination process in the all-inorganic perovskite NCs.28 The temperature-dependent PL linewidth is fitted using the independent Boson model as29
exp(Eb/kBT)), in which I0 is the intensity at 80 K, A is a constant related to the ratio between the radiative and nonradiative lifetimes, Eb is the thermal quenching energy, and kB is the Boltzmann constant. The obtained thermal quenching energy of UCL is 39.1 meV, which is bigger than that of normal luminescence at 23.4 meV. The thermal quenching energy can be considered to be the exciton binding energy if no other nonradiative decay channel is in the exciton recombination process in the all-inorganic perovskite NCs.28 The temperature-dependent PL linewidth is fitted using the independent Boson model as29
| Γ(T) = Γ0 + Γop/(eℏωop/kBT − 1) | (1) |
3.2. Power dependence of steady-state PL under femtosecond laser excitation
Strong UCL of CsPbBr3 NCs in n-hexane is observed when 800 nm femtosecond laser pulses pass through the NC solution, as shown in the inset of Fig. 3. At the same experimental conditions, we can see strong absorption and scattering luminescence under 400 nm femtosecond laser excitation. The UCL intensity has a slope of 1.80 at 800 nm excitation, while the normal luminescence intensity has a slope of 0.89, as shown in Fig. 3. The results indicate that normal luminescence intensity is linearly dependent on excitation power, whereas UCL intensity varies quadratically with pump power. It is therefore concluded that UCL is attributed to two-photon excitation.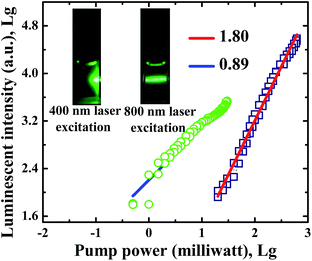 | ||
| Fig. 3 Dependence of the luminescent intensity in CsPbBr3 NCs on the pump power. The inset shows the photographs of CsPbBr3 NCs in n-hexane under 400 and 800 nm femtosecond laser excitation. | ||
3.3. Nanosecond luminescence dynamics
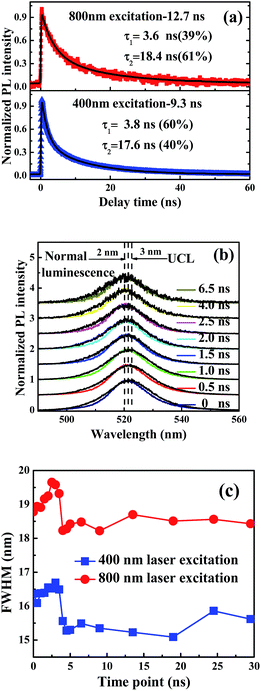
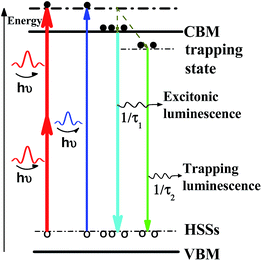
Time-resolved nanosecond luminescence dynamics has been widely applied to the investigation of the nanocrystalline structure and excited-state photophysics. In order to study the luminescent mechanism of CsPbBr3 NCs and determine the cause for the peak of PL spectra, we examined the luminescence dynamics of CsPbBr3 NCs in solution under 400 nm and 800 nm laser excitation. The luminescence dynamics was measured using TCSPC at the wavelength of 520 nm with a band-pass filter. The average lifetimes of normal luminescence and UCL are 9.3 and 12.7 ns, respectively. Decay data show that the dynamic process consists of a fast component and a slow component attributed to the excitonic state and the charge trapping state, respectively.32,33 The fast component, with lifetimes much shorter than those of conventional CH3NH3PbBr3 NCs, indicates that there is one band-edge exciton recombination process.10 The slow component can be attributed to the intrinsic trap-free charge recombination, which is sensitive to temperature and detection wavelength. Time-resolved UCL decays of the CsPbBr3 NCs show longer average lifetime of 12.7 ns than that of normal PL, which was measured at 9.3 ns. Two different timescales are assigned to the excitonic state emission together with trapping state emission, fitted with a fast lifetime of 3.6 ns at ratio of 39% and a slow lifetime of 18.4 ns at the ratio of 61%. It is interesting to note that the trapping components of UCL have a bit longer lifetimes than those of normal luminescence, as shown in Fig. 4(a). Time-resolved normal luminescence and UCL spectra are also measured with ICCD under 400 nm and 800 nm laser excitation, respectively. If the redshift of emission spectra from normal luminescence to UCL is dominated by reabsorption, the emission peak wavelength of time-resolved PL spectroscopy should have a redshift with the longer delay time. However, an opposite tendency on spectral shift exists for CsPbBr3 NCs. A peak shift of ∼2 nm between 0 and 6.5 ns can be observed for normal luminescence, as shown in Fig. 4(b); time-resolved UCL spectra indicate that the obvious blue shift of emission peaks of about 3 nm is observed at 0 and 6.5 ns, as shown in Fig. 4(b). With delay time increasing, FHWMs of UCL spectra are changed from 19.5 to 18.5 nm; however, FWHMs of normal luminescence are changed from 16.5 to 15.5 nm, as shown in Fig. 4(c). The change in peak positions at various delay times indicates the involvement of more than a single excited state. The peak shifts are attributed to the changes in emission intensity ratio of the surface trapping and excitonic state on the conduction band edge at various temporal evolutions. Furthermore, the trapping and excitonic emission peaks are close to each other, so we cannot distinguish one from the other by their profiles and line shapes.11,34 The faster component is easily observed, even though much lower laser fluence (0.06 μJ cm−2) was used. This confirms our assignment of this component as arising from excitonic emission rather than through an Auger-assisted recombination process.34The percentage of trapping luminescence changes when the wavelength of laser excitation is changed from 400 to 800 nm. According to our assumption, the redshift of UCL is produced by the change in the relative intensity of excitonic and trapping states at one- or two-photon excitation. We describe this behaviour with the aid of the schematics in Scheme 1. There, the thickness of the solid lines represents the luminescence intensity. When the sample is photoexcited with the photon energy of hν, two recombination pathways emerge for photoinduced electrons due to the existence of trapping and excitonic states. The two excited states have various dependences on the wavelength of laser excitation, so the change in the relative intensity can cause a redshift of the emission peak of UCL.
3.4. Carrier dynamics by TA
TA and optical Kerr shutter measurement can provide further information on excitation dynamics at the subpicosecond timescale.35 In order to understand trapping states and the UCL mechanism of CsPbBr3 NCs, TA measurement in CsPbBr3 NCs is performed under 400 nm and 800 nm femtosecond laser excitation, respectively. Qualitatively different TA dynamics can be found when the excitation density is much more than one exciton per NC, which is calculated in terms of absorption cross section and Poisson distribution.36 Pump photon fluxes are controlled to generate the same number of excitons per particle at a low excitation level, which corresponds to mean excitation numbers per NCs 〈N〉, as estimated based on the absorption cross-section (σ) recorded at special wavelength and pulse fluence (j, photons per cm2): 〈N〉 = σj. Here, the excitation energy of the laser pulse is adjusted to ensure the mean excitation numbers per NC solution 〈N〉 remains from 0.2 to 3.0, which is comparable with the excitation laser power for time-resolved PL measurement. An approximately symmetric spectral shape of UCL can be obtained under 800 nm femtosecond laser excitation. Here, pump power under 800 nm laser excitation is ten times that of 400 nm laser excitation to get the same luminescent intensity, which is used in time-resolved PL measurement. However, the spatial evolution of TA for CsPbBr3 NCs is asymmetrical and complicated. Fig. 5(a) and (b) show time-resolved ΔA/A spectra of CsPbBr3 NCs under 400 nm and 800 nm laser excitation, respectively.37 The delay time ranges from −3.0 ps to 602.0 ps, and the arrows indicate the evolution of the delay time. We can see that the spectral response of CsPbBr3 NCs shows three components with various time scales, including a long photoinduced transient bleach at ∼510 nm, a quick excited state absorption (EAS) in the range of 470–490 nm and an additional TA signal at ∼525 nm. The negative transient bleach signal at ∼510 nm is assigned to ground-state depopulation, as its peak matches with the first excitonic absorption peak, which is due to the filling of band-edge states. Photoinduced luminescence, which is difficult to completely rule out, has a weak influence on this negative bleach signal.38 The positive TA signal at 470–490 nm and 520 nm is assigned to photoinduced absorption of excited states, which show a similar monotonic decay behaviour and relaxation time.39 Consistent with the proposed theory, the charge carrier recombination process is inevitably influenced by trapping states due to the trap-filling effect.40 The early time TA spectra exhibit the typical signature of redshift for band-edge transition and observed spectral feature with photoinduced absorption at lower energies, and bleaching at higher. At longer times, as charges accumulate in the lowest energy states, the photoinduced absorption signal decays are replaced quickly by strong band-edge bleaching due to state filling.41Through controlling the pump power intensity, the same ΔA/A intensity of CsPbBr3 NCs can be collected under 400 nm and 800 nm laser excitation, respectively. Under 400 nm and 800 nm femtosecond laser excitation, the broad bleaching signal at 510 nm shows a redshift with delay time, suggesting that there are multiple relaxation pathways from the band-edge excited state after pump-laser excitation.42 The TA spectra captured at various delay times show ∼5 nm change in peak position, suggesting the involvement of more than a single excited state.43 The “hot” exciton is injected into a NC, and the energy required to introduce the second exciton into the NC is reduced compared to the single-exciton state by exciton–exciton interaction.41 This is a biexciton effect manifested by a redshift of band-edge transition. With increasing 〈N〉, the data show the faster component emerging due to the hot exciton relaxation,39 as shown in Fig. 5(c) and (d). An increase in fluence leads to the appearance of fast component assigned to hot exciton relaxation (∼tens of picosecond). It is found that the rate of hot exciton relaxation under 800 nm femtosecond laser excitation is faster than that of the 400 nm. Comparative investigation on ultrafast charge dynamics of organic–inorganic hybrid perovskite material under 400 nm and 800 nm laser excitation are discussed;37 the presence of trapping states in the recombination process is confirmed due to the fluence-dependent charge decays. TA spectra contour of CsPbBr3 NCs with the spectral range of 480–540 nm under 400 and 800 nm laser excitation at 〈N〉 = 3.0 are shown in Fig. 5(e) and (f).
Another exciton state with lower energy is proposed to explain the redshift of band-edge transition with increasing delay time.41,44 The time- and spectral-resolved TA data indicate that the trapping states in these CsPbBr3 NCs are shallow near the excitonic states. These results provide deeper insights into the UCL and trapping states in CsPbBr3 NCs. It indeed requires further study to clarify the influence of trapping states near the band-edge energy level for all-inorganic perovskite NCs.
4. Conclusions
In conclusion, upconversion luminescence in all-inorganic halide perovskite CsPbBr3 NCs is studied by the use of time-resolved PL and TA spectroscopy. The redshift of peak position of upconversion luminescence is 3 nm with longer delay time. Time-resolved PL and TA spectroscopy under near-infrared femtosecond laser excitation demonstrate that FWHM and peak position are changed at various delay times, suggesting the existence of more than a single excited state. It can be found that UCL is composed of a photoinduced surface-trapping and a band-edge excitonic state and causes the observed biexponential dynamics. We conclude that the redshift of the emission peak is caused by the relative change in luminescent intensity between excitonic and trapping states. These results provide more understanding of the underlying photophysics in CsPbBr3 NC materials and are necessary for the optimization of LEDs in the future.Acknowledgements
This work is supported by the National Natural Science Foundation of China (grant numbers 11304058, 61204007, and 11404307) and NSAF (grant number U1330106). This work is partially supported by Fundamental Research Funds for the central Universities and Program for Innovation Research of Science in Harbin Institute of Technology (PIRS OF HIT 201621); New-Century Training Programme Foundation for the Talents by Heilongjiang Province (1254-NCET-018); Foundation for University Key Teacher by Heilongjiang Province (1252G047); Heilongjiang Province Postdoctoral Science Foundation (LBH-Q14139); Science Foundation of Heilongjiang University for Young Scholars (JCL201205).References
- W. S. Yang, J. H. Noh, N. J. Jeon, Y. C. Kim, S. Ryu, J. Seo and S. I. Seok, Science, 2015, 348, 1234–1237 CrossRef CAS PubMed.
- P. Ramasamy, D.-H. Lim, B. Kim, S.-H. Lee, M.-S. Lee and J.-S. Lee, Chem. Commun., 2016, 52, 2067–2070 RSC.
- S. Yakunin, L. Protesescu, F. Krieg, M. I. Bodnarchuk, G. Nedelcu, M. Humer, G. De Luca, M. Fiebig, W. Heiss and M. V. Kovalenko, Nat. Commun., 2015, 6, 8056 CrossRef CAS PubMed.
- Z.-K. Tan, R. S. Moghaddam, M. L. Lai, P. Docampo, R. Higler, F. Deschler, M. Price, A. Sadhanala, L. M. Pazos, D. Credgington, F. Hanusch, T. Bein, H. J. Snaith and R. H. Friend, Nat. Nanotechnol., 2014, 9, 687–692 CrossRef CAS PubMed.
- Y. Xu, Q. Chen, C. Zhang, R. Wang, H. Wu, X. Zhang, G. Xing, W. W. Yu, X. Wang, Y. Zhang and M. Xiao, J. Am. Chem. Soc., 2016, 138, 3761–3768 CrossRef CAS PubMed.
- L. Protesescu, S. Yakunin, M. I. Bodnarchuk, F. Krieg, R. Caputo, C. H. Hendon, R. X. Yang, A. Walsh and M. V. Kovalenko, Nano Lett., 2015, 15, 3692–3696 CrossRef CAS PubMed.
- F. Zhang, H. Zhong, C. Chen, X.-G. Wu, X. Hu, H. Huang, J. Han, B. Zou and Y. Dong, ACS Nano, 2015, 9, 4533–4542 CrossRef CAS PubMed.
- D. N. Dirin, L. Protesescu, D. Trummer, I. V. Kochetygov, S. Yakunin, F. Krumeich, N. P. Stadie and M. V. Kovalenko, Nano Lett., 2016, 16, 5866–5874 CrossRef CAS PubMed.
- M. Haase and H. Schaefer, Angew. Chem., Int. Ed., 2011, 50, 5808–5829 CrossRef CAS PubMed.
- W. Wu, Y. Gao, Q. Chang, H. Ye, Z. Zheng, W. Liu, A. Li and Y. Yang, J. Nanopart. Res., 2011, 13, 1049–1061 CrossRef CAS.
- A. Javier, D. Magana, T. L. Jennings and G. F. Strouse, Appl. Phys. Lett., 2003, 83, 1423–1425 CrossRef CAS.
- X. Li, Y. Wu, S. Zhang, B. Cai, Y. Gu, J. Song and H. Zeng, Adv. Funct. Mater., 2016, 26, 2435–2445 CrossRef CAS.
- J. Pan, S. P. Sarmah, B. Murali, I. Dursun, W. Peng, M. R. Parida, J. Liu, L. Sinatra, N. Alyami, C. Zhao, E. Alarousu, T. K. Ng, B. S. Ooi, O. M. Bakr and O. F. Mohammed, J. Phys. Chem. Lett., 2015, 6, 5027–5033 CrossRef CAS PubMed.
- L. Protesescu, S. Yakunin, M. I. Bodnarchuk, F. Bertolotti, N. Masciocchi, A. Guagliardi and M. V. Kovalenko, J. Am. Chem. Soc., 2016, 138, 14202–14205 CrossRef CAS PubMed.
- L. C. Schmidt, A. Pertegas, S. Gonzalez-Carrero, O. Malinkiewicz, S. Agouram, G. Minguez Espallargas, H. J. Bolink, R. E. Galian and J. Perez-Prieto, J. Am. Chem. Soc., 2014, 136, 850–853 CrossRef CAS PubMed.
- K. Zheng, K. Zidek, M. Abdellah, M. E. Messing, M. J. Al-Marri and T. Pullerits, J. Phys. Chem. C, 2016, 120, 3077–3084 CAS.
- B. A. Koscher, J. K. Swabeck, N. D. Bronstein and A. P. Alivisatos, J. Am. Chem. Soc., 2017, 139, 6566–6569 CrossRef CAS PubMed.
- Y. Wang, Y. Wang, S. Dev Verma, M. Tan, Q. Liu, Q. Yuan, N. Sui, K. Zhihui, Z. Qiang and Z. Han-Zhuang, Appl. Phys. Lett., 2017, 110, 5 Search PubMed.
- Y. Wang, X. Li, X. Zhao, L. Xiao, H. Zeng and H. Sun, Nano Lett., 2016, 16, 448–453 CrossRef CAS PubMed.
- C. C. Stoumpos, C. D. Malliakas, J. A. Peters, Z. Liu, M. Sebastian, J. Im, T. C. Chasapis, A. C. Wibowo, D. Y. Chung, A. J. Freeman, B. W. Wessels and M. G. Kanatzidis, Cryst. Growth Des., 2013, 13, 2722–2727 CAS.
- P. Cottingham and R. L. Brutchey, Chem. Mater., 2016, 28, 7574–7577 CrossRef CAS.
- Y. Wang, T. Van Duong, Y. Gao, T. C. He, R. Chen, E. Mutlugun, H. V. Demir and H. D. Sun, Adv. Mater., 2014, 26, 2954–2961 CrossRef CAS PubMed.
- W. Zhang, D. Dai, X. Chen, X. Guo and J. Fan, Appl. Phys. Lett., 2014, 104, 91902 CrossRef.
- V. D'Innocenzo, G. Grancini, M. J. P. Alcocer, A. R. S. Kandada, S. D. Stranks, M. M. Lee, G. Lanzani, H. J. Snaith and A. Petrozza, Nat. Commun., 2014, 5, 3586 Search PubMed.
- J. Xing, X. F. Liu, Q. Zhang, S. T. Ha, Y. W. Yuan, C. Shen, T. C. Sum and Q. Xiong, Nano Lett., 2015, 15, 4571–4577 CrossRef CAS PubMed.
- T. J. Savenije, C. S. Ponseca Jr, L. Kunneman, M. Abdellah, K. Zheng, Y. Tian, Q. Zhu, S. E. Canton, I. G. Scheblykin, T. Pullerits, A. Yartsev and V. Sundstrom, J. Phys. Chem. Lett., 2014, 5, 2189–2194 CrossRef CAS PubMed.
- K. Wu, A. Bera, C. Ma, Y. Du, Y. Yang, L. Li and T. Wu, Phys. Chem. Chem. Phys., 2014, 16, 22476–22481 RSC.
- J. Li, X. Yuan, P. Jing, J. Li, M. Wei, J. Hua, J. Zhao and L. Tian, RSC Adv., 2016, 6, 78311–78316 RSC.
- A. Al Salman, A. Tortschanoff, M. B. Mohamed, D. Tonti, F. van Mourik and M. Chergui, Appl. Phys. Lett., 2007, 90, 093104 CrossRef.
- D. Priante, I. Dursun, M. S. Alias, D. Shi, V. A. Melnikov, T. K. Ng, O. F. Mohammed, O. M. Bakr and B. S. Ooi, Appl. Phys. Lett., 2015, 106, 81902 CrossRef.
- S. Seth, N. Mondal, S. Patra and A. Samanta, J. Phys. Chem. Lett., 2016, 7, 266–271 CrossRef CAS PubMed.
- A. R. S. Kandada, S. Neutzner, V. D'Innocenzo, F. Tassone, M. Gandini, Q. A. Akkerman, M. Prato, L. Manna, A. Petrozza and G. Lanzani, J. Am. Chem. Soc., 2016, 138, 13604–13611 CrossRef PubMed.
- S. Gonzalez-Carrero, L. Frances-Soriano, M. Gonzalez-Bejar, S. Agouram, R. E. Galian and J. Perez-Prieto, Small, 2016, 12, 5245–5250 CrossRef CAS PubMed.
- N. Mondal and A. Samanta, Nanoscale, 2017, 9, 1878–1885 RSC.
- L. Yan, J. Yue, J. Si and X. Hou, Opt. Express, 2008, 16, 12069–12074 CrossRef CAS PubMed.
- K. Zheng, K. Zidek, M. Abdellah, J. Chen, P. Chabera, W. Zhang, M. J. Al-Marri and T. Pullerits, ACS Energy Lett., 2016, 1, 1154–1161 CrossRef CAS.
- P. Piatkowski, B. Cohen, S. Kazim, S. Ahmad and A. Douhal, Phys. Chem. Chem. Phys., 2016, 18, 27090–27101 RSC.
- J. S. Manser, J. A. Christians and P. V. Kamat, Chem. Rev., 2016, 116, 12956–13008 CrossRef CAS PubMed.
- Q. Liu, Y. Wang, N. Sui, Y. Wang, X. Chi, Q. Wang, Y. Chen, W. Ji, L. Zou and H. Zhang, Sci. Rep., 2016, 6, 29442 CrossRef CAS PubMed.
- S. D. Stranks, V. M. Burlakov, T. Leijtens, J. M. Ball, A. Goriely and H. J. Snaith, Phys. Rev. Appl., 2014, 2, 034007 CrossRef.
- N. S. Makarov, S. Guo, O. Isaienko, W. Liu, I. Robel and V. I. Klimov, Nano Lett., 2016, 16, 2349–2362 CrossRef CAS PubMed.
- M. J. Simpson, B. Doughty, B. Yang, K. Xiao and Y.-Z. Ma, J. Phys. Chem. Lett., 2015, 6, 3041–3047 CrossRef CAS PubMed.
- A. Swarnkar, R. Chulliyil, V. K. Ravi, M. Irfanullah, A. Chowdhury and A. Nag, Angew. Chem., Int. Ed., 2015, 54, 15424–15428 CrossRef CAS PubMed.
- J. Chen, D. Liu, M. J. Al-Marri, L. Nuuttila, H. Lehtivuori and K. Zheng, Sci. China Mater., 2016, 59, 719–727 CrossRef.
| This journal is © The Royal Society of Chemistry 2017 |

