 Open Access Article
Fabrication of flower-like MoS2/TiO2 hybrid as an anode material for lithium ion batteries†
Xiaoquan Zhua,
Xiaoyu Liangb,
Xiaobin Fan *a and
Xintai Su
 *b
*b
aState Key Laboratory of Chemical Engineering, School of Chemical Engineering and Technology, Collaborative Innovation Center of Chemical Science and Engineering, Tianjin University, No. 135, Yaguan Road, Jinnan District, Tianjin 300354, China. E-mail: xiaobinfan@tju.edu.cn
bDepartment of Chemistry, Zhejiang Sci-Tech University, Xiasha Campus, Hangzhou 310018, China. E-mail: suxintai827@163.com
First published on 3rd August 2017
Abstract
A three-dimensional (3D) flower-like MoS2/TiO2 nanohybrid was synthesized via a two-step hydrothermal method. It is found that the MoS2/TiO2 nanohybrid is assembled with MoS2 nanosheets and TiO2 nanoparticles. The TiO2 nanoparticles are homogeneously dispersed on the MoS2 nanosheets. Moreover, the MoS2/TiO2 nanohybrid displays excellent electrochemical performance with a high reversible capacity of 801 mA h g−1 at a current density of 100 mA g−1 after 50 cycles. It also demonstrates outstanding rate behavior with a reversible discharge capacity of 660 mA h g−1 at a current density of 1000 mA g−1 and retains a capacity of about 760 mA h g−1 as the current density is returned back to 100 mA g−1. Compared with MoS2, the MoS2/TiO2 nanohybrid displays enhanced cycling stability and superior rate capability. The excellent electrochemical performance may be attributed to the favorable synergistic effect between MoS2 and TiO2. The TiO2 particles may enhance the structure stability and shorten the transport distance of ions across the surface.
1. Introduction
Lithium-ion batteries (LIBs) are now one of the most important power sources for many electronic devices in our daily life. Development of rechargeable LIBs with longer cycle life and higher power density is of great interest to accommodate the growing demands for higher energy density electronic devices.1 Currently, graphite has been widely used as the negative electrode in commercial LIBs due to its natural abundance and stable cycling performance. However, it has a relatively low theoretical capacity (372 mA h g−1).2 Therefore, alternative anode materials with higher specific capacity and good cycling behavior are desirable for LIBs.In recent years, two-dimensional layered transition-metal dichalcogenides (TMDs) have attracted great interest in the field of electrochemical energy storage and conversion because of their unique physical and chemical properties. Due to their short path length and more channels for lithium ion diffusion and insertion, these 2D materials exhibit enhanced electrochemical performances as electrode materials for LIBs, such as WS2, MoS2.3–5 In particular, molybdenum disulfide (MoS2) has gradually drawn attention as a potential candidate, owing to its high theoretical specific capacity (∼670 mA h g−1).6 Meanwhile, the weak van der Waals forces allow a fast diffusion path for lithium-ion and easy lithium ion insertion/extraction.7 This is due to the layered structure of MoS2. MoS2 is consisting of molybdenum atoms sandwiched between two layers of closely packed sulfur atoms, two molecular layers are weakly linked by van der Waals interactions.8 Various MoS2 nanostructures such as nanoplates,6 nanowall,9 nanotube10 and nanoflowers11,12 have been reported for lithium storage as LIBs anodes. However, the inferior cycling stability due to large volume changes significantly limits its practical applications. To overcome the defects of the MoS2-based electrode materials, one doable strategy is to design hybridization. A strategy is to immobilize MoS2 nanostructures on carbon-based substrate to construct nanocomposites.13–16 Most of the previous studies focused on MoS2–carbon nanocomposites. Carbon tubes, carbon nanofibers, graphene and organic conducting polymers are used as carbonaceous materials.1,10,17 However, the excessive interface between porous carbonaceous materials and electrolytes cause considerable side reactions, forming a thick solid electrolyte interface (SEI) on the carbon and leading to a low initial coulombic efficiency of <70%.13
Recently, some transition metal oxides were used to improve the cycling performance of MoS2, such as Fe3O4 and TiO2.18,19 Titanium dioxide (TiO2) has been widely used as anode material for LIBs. It possesses a low volume variation (<4%) and displays good cycling stability during the charge–discharge process.20 Furthermore, it is a safer material compared to graphite because of its higher operation voltage (1.7 V vs. Li+/Li). Accordingly, by combining the individual constituents, the hybrid MoS2/TiO2 system shows some merits that not exist in a single system. The advantages of both high reversible capacity and superior cycling stability are expected. The strain of volume variation of MoS2 can be alleviated. To the best of our knowledge, a number of MoS2/TiO2 hybrid systems have been widely investigated as photocatalysts.21 However, this hybrid system has also been studied as electrode materials for LIBs in recent years.19,22 There has some literatures reported about the applications of TiO2@MoS2 composite in lithium ion batteries. Li et al. synthesized the hierarchical TiO2 nanowire@MoS2 nanosheet nanocomposite by a glucose-assisted hydrothermal approach, and it displays a specific capacity of around 600 mA h g−1 at a current density of 100 mA g−1 after 100 cycles.7 Xu et al. synthesized MoS2 nanosheet@TiO2 nanotube hybrid by a two-step method, and it exhibits a capacity of 472 mA h g−1 at a current density of 100 mA g−1 after 100 cycles.20 The TiO2 decorated few-layers MoS2 nanosheets through one-pot method have been reported by our team.23 However, we found that the MoS2/TiO2 nanohybrid derived from the MoO2/TiO2 precursor was very different from one-pot method. We consider that the morphology of the MoO2 precursor plays an important role in the formation of product. Meanwhile, TiO2-decorated three dimensional (3D) MoS2 nanoflowers have rarely been studied as electrode materials for LIBs.
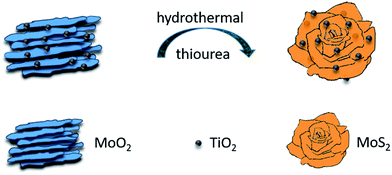
Herein, we report a two-step hydrothermal route to prepare 3D Hierarchical MoS2/TiO2 nanoflowers. The synthetic process is illustrated in Fig. 1. Firstly, the hydrothermal method was adopted to prepare the MoO2/TiO2 precursor. Secondly, the as-prepared the MoO2/TiO2 nanobundles were vulcanized by thiourea under a subsequent hydrothermal process. We supposed that the formation of 3D flower-like architecture may undergo a self-assembling process from the precursor. The as-prepared flower-like MoS2/TiO2 nanohybrid was further treated at 500 °C in an Ar atmosphere to increase its crystallinity. Finally, the MoS2/TiO2 nanohybrid exhibited enhanced electrochemical performances as an anode material. It delivered a high reversible capacity of 801 mA h g−1 at a current density of 100 mA g−1 after 50 cycles, and an outstanding rate behavior of a reversible discharge capacity of 660 mA h g−1 at a current density of 1000 mA g−1 and retains a capacity of about 760 mA h g−1 as the current density is back to 100 mA g−1.
2. Experimental section
2.1 Synthesis and characterization of samples
All reagents were analytical grades. The synthesis process of MoS2/TiO2 nanoflowers involves two steps: formation of the precursor MoO2/TiO2 and sequent vulcanization to MoS2/TiO2 by hydrothermal method.The composition and phase of the precursor and the final product were characterized by a Rigaku D/max-ga X-ray diffractometer (XRD) at a scanning rate of 6° min−1 in 2θ ranging from 10° to 80° with Cu Kα radiation (λ = 1.54178 Å). The transmission electron microscopy (TEM) were carried out on a Hitachi H-600 transmission electron microscope with accelerating voltage of 100 kV, and field-emission scanning electron microscope (FESEM, Hitachi S-4800) were obtained with an acceleration voltage of 5 kV. Thermogravimetric analysis (TGA) was carried out using a SDTQ600 at a heating rate of 10 °C min−1 from 25 °C to 650 °C under air atmosphere. The X-ray photoelectron spectroscopy (XPS) was analyzed by Perkin-Elmer PHI1600 spectrometer.
2.2 Electrochemical measurement
The electrochemical tests were carried out in coin cells. The working electrodes were fabricated by coating a slurry containing 80 wt% of active materials (MoS2/TiO2 nanohybrid, MoS2), 10 wt% of acetylene black, and 10 wt% of polyvinylidene fluoride (PVDF) dissolved in N-methyl-2-pyrrolidinone onto a copper foil and dried at 110 °C in vacuum for 12 h before pressing. The standard CR-2032 type coin cells were assembled in an Ar-filled glove box using the as-prepared anode, lithium foil as counter electrode, and Celgard-2400 as a separator. The electrolyte was 1 M LiPF6 dissolved in a mixture of ethylene carbonate and diethyl carbonate (EC–DEC, 1![[thin space (1/6-em)]](https://www.rsc.org/images/entities/char_2009.gif) :
:![[thin space (1/6-em)]](https://www.rsc.org/images/entities/char_2009.gif) 1 in volume). The cells were aged for 12 h before the measurements. Cyclic voltammetry measurements (CV) and electrochemical impedance spectroscopy (EIS) were performed on an electrochemical work-station (CHI 660D). The voltage scan rate for the CV measurement was at a scan rate of 0.1 mV s−1 over the potential range of 0.01–3.0 V (vs. Li+/Li). The EIS data were obtained by applying excitation amplitude of 10 mV in the frequency range from 10 mHz to 1 MHz. The galvanostatic charge–discharge tests were conducted on the battery measurement system (LAND CT2001A, China) at current densities of 50–1000 mA g−1 with a cut off voltage range of 0.01–3.0 V vs. Li/Li+ at room temperature.
1 in volume). The cells were aged for 12 h before the measurements. Cyclic voltammetry measurements (CV) and electrochemical impedance spectroscopy (EIS) were performed on an electrochemical work-station (CHI 660D). The voltage scan rate for the CV measurement was at a scan rate of 0.1 mV s−1 over the potential range of 0.01–3.0 V (vs. Li+/Li). The EIS data were obtained by applying excitation amplitude of 10 mV in the frequency range from 10 mHz to 1 MHz. The galvanostatic charge–discharge tests were conducted on the battery measurement system (LAND CT2001A, China) at current densities of 50–1000 mA g−1 with a cut off voltage range of 0.01–3.0 V vs. Li/Li+ at room temperature.
3. Results and discussions
3.1 Structural characteristics of samples
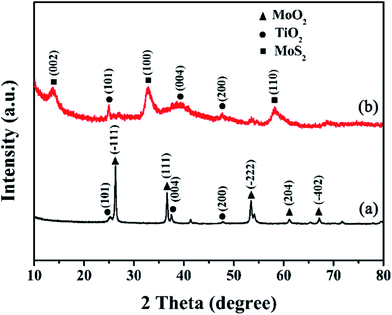
Fig. 2a shows that all the diffraction peaks of precursor can be assigned to the anatase TiO2 (JCPDS 21-1272) and monoclinic MoO2 phase (JCPDS 32-0671). Peaks in Fig. 2b can be indexed to a mixture of the hexagonal MoS2 phase (JCPDS 74-0932) and a phase of anatase TiO2 (JCPDS 21-1272). It indicated that the MoO2 has been successfully transformed to MoS2. The (002) diffraction peak at 13.8° is lower than standard card (2θ = 14°), which indicates enlarged layer distances of MoS2.Fig. 3a and b show low and high magnification FESEM images of the annealed MoS2/TiO2 nanohybrid, respectively. It exhibits 3D flower-like structure assembled from several thin nanosheets. Some TiO2 nanoparticles were decorated on the MoS2 nanosheets. The TEM images of annealed MoS2/TiO2 are shown in Fig. 3c and d. And we found that the hierarchical MoS2/TiO2 nanohybrid was assembled from curly MoS2 nanosheets and an amount of TiO2. The TiO2 nanoparticles with diameter of ∼20 nm are uniformly distributed on the MoS2 nanosheets. The morphology of bare MoS2 were shown in Fig. S1.† It exhibits the cluster-like morphology. The TEM images of precursor MoO2/TiO2 are shown in Fig. S2.† It exhibits a small amount of TiO2 nanoparticles are attached to the surface of MoO2 bundles. The HRTEM image of the MoS2/TiO2 nanohybrid illustrates the crystal lattice structure of MoS2 and TiO2 (Fig. S3†). The interplanar spacing of 0.64 nm and 0.35 nm are corresponding to the lattice plane (002) of MoS2 and (101) of TiO2, respectively. The spacing is slightly larger than the layer-to-layer spacing of 6.2 Å in bulk MoS2. This is consistent with the results of XRD. It also indicates that the MoO2 nanobundles turn into MoS2 nanosheets successfully. Moreover, the XPS of bare MoS2 and MoS2/TiO2 nanohybrid were shown in the ESI (Fig. S4†). The binding energies of S 2p1/2, S 2p3/2, Mo 3d3/2 and Mo 3d5/2 peaks in the bare MoS2 locate at 163.4, 162.3, 232.7 and 229.5 eV, respectively. However, the S 2p1/2, S 2p3/2, Mo 3d3/2 and Mo 3d5/2 peaks of MoS2/TiO2 nanohybrid shift to 163.2, 162.1, 232.4 and 229.2 eV, respectively. The binding energy shifts to lower binding energy mean electronic interaction between MoS2 and TiO2.24
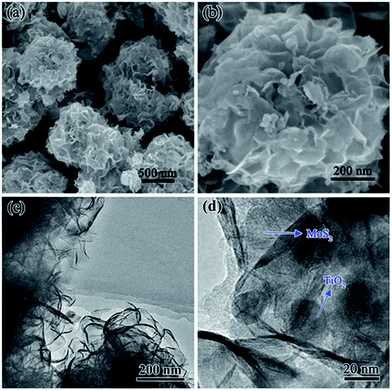 | ||
| Fig. 3 (a) Low- and (b) high-magnification FESEM images of 3D MoS2/TiO2 nanohybrid. (c) Low- and (d) high magnification TEM images of MoS2/TiO2 nanohybrid. | ||
TGA was carried out from 25 °C to 700 °C in air flow to determine the amount of MoS2 in the MoS2/TiO2 nanohybrid (Fig. 4). The weight loss stage below 300 °C is a result of the evaporation of physically adsorbed water and the loss of chemisorbed water, and a large continuous weight loss in the range of approximately 300–500 °C which was caused by the oxidation of MoS2. The second weight loss was measured to be 10.56% and 12.32% for the MoS2/TiO2 nanohybrid and bare MoS2 nanoclusters, respectively. The result is attributed to the oxidation of MoS2 to MoO3. The mass fraction of MoS2 in the MoS2/TiO2 nanohybrid can thus be estimated to be about 85.7 wt%. Let the weight percentage of MoS2 in the MoS2/TiO2 nanohybrid to be x, one has 10.56 = 12.32x. Therefore x = 85.71%.25
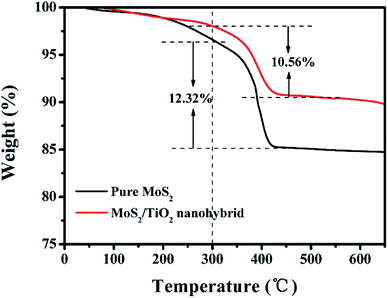 | ||
| Fig. 4 TGA curves of the MoS2/TiO2 nanohybrid and pure MoS2 nanoclusters at a temperature ramp of 10 °C min−1 in air. | ||
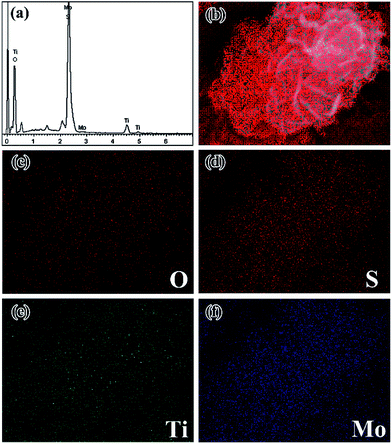
In order to investigate the detailed local elemental composition and distribution of the flower-like MoS2/TiO2 nanohybrid, energy dispersive X-ray (EDX) mapping analysis was carried out (Fig. 5). The EDS analysis shows that the composite mainly contains O, S, Ti and Mo. Fig. 5b–f shows the full elements map and corresponding elemental mapping images. The O, S, Ti and Mo are homogeneously distributed throughout the samples on the whole. From the elemental mapping, it can be observed that the Mo and S elemental distribution shows strong signals (Fig. 5d and f). For the Ti and O signals, the distinct distributions are sparse compared to Mo and S. It agrees well with the EDS spectrum.
3.2 Electrochemical properties
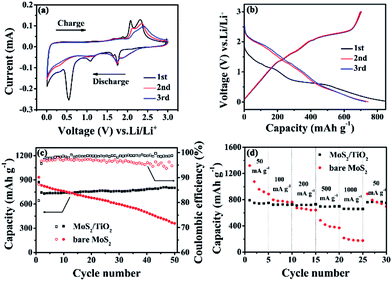
The annealed MoS2/TiO2 nanohybrid was assembled into Li half-cells to investigate the electrochemical performance. Fig. 6a shows the cyclic voltammetry curves (CVs) of the annealed MoS2/TiO2 nanohybrid, which we collected at a scan rate of 0.01 mV s−1 in a potential window of 0.01–3.0 V vs. Li+/Li. In the first cathodic process (discharge process), four reduction peaks appear at approximately at 1.8 V, 1.7 V, 1.1 V and 0.6 V. The remarkable cathodic peak appears at 1.8 V, indicating the lithiation process leading from S to Li2S.25 The weak reduction peak at 1.7 V is due to the lithiation of TiO2 nanoparticles. The reduction peak at 1.1 V is attributed to the Li intercalation into the MoS2 nanosheets, resulting in the phase transformation from trigonal prismatic to octahedral.26 The reduction peak at 0.6 V can be assigned to the decomposition of LixMoS2 into Li2S and Mo particles, which is based on the conversion reaction: MoS2 + 4Li+ + 4e− → Mo + 2Li2S.27 These peaks disappear in the successive cathodic process resulting from few amorphous MoS2 reformed after the first charge process. In the follow cycles, a new reduction peak appears at 1.8 V corresponding to lithiation process of S to form sulfur-containing materials.25 In the first charge process, three anodic peaks appear at 1.75 V, 2.0 V and 2.3 V. The small oxidation peak at 1.75 V is likely due to the transformation of Mo to MoS2. The two peaks at 2.0 V and 2.3 V are attributed to the reversible conversion reactions of LixTiO2 to TiO2 and the conversion of Li2S into S, respectively. A broad envelope feature at lower potential could be found, which due to the formation of amorphous phase.28 The CV curves of bare MoS2 is shown in Fig. S5a.† Compared with MoS2/TiO2 nanohybrid, the reduction peak at 1.7 V and oxidation peak at 2.0 V are disappeared. It is attributed to the absence of TiO2. Fig. 6b presents the galvanostatic discharge–charge (GDC) voltage profiles of the annealed MoS2/TiO2 nanohybrid at 100 mA g−1. In agreement with the above CV results, two apparent voltage plateaus at 1.1 V and 0.6 V in the first discharge process are attributed to the phase transformation from 2H-MoS2 to 1T-LixMoS2 and further conversion into Mo and Li2S. During the charge process, a weak potential plateau at 1.75 V is attributed to the oxidation of Mo to MoS2. The other conspicuous potential plateau at about 2.3 V appeared is corresponding to the conversion of Li2S into S. There is no obvious difference compared with bare MoS2 (Fig. S5b†). It may be due to relatively low content of TiO2. In the first cycle, the MoS2/TiO2 nanohybrid reveals discharge and charge specific capacities of 871.4 mA h g−1 and 696.7 mA h g−1, respectively, leading to a relatively high coulombic efficiency (CE) of 80%. It should be mainly due to the gel-like polymeric layer formation on the MoS2/TiO2 nanohybrid.29 The charge and discharge capacities in the second cycle are 743.3 mA h g−1 and 702.8 mA h g−1, giving a relatively high coulombic efficiency of 94.5%. The cycling performances and coulombic efficiency of MoS2/TiO2 nanohybrid and bare MoS2 are shown in Fig. 6c. The initial discharge capacity of MoS2/TiO2 nanohybrid is 871.4 mA h g−1, it exhibits lower discharge capacity than the MoS2. This is mainly on account of the influence of the TiO2. Nevertheless, after 50 cycles, the specific capacity of the bare MoS2 decreases quickly from 932.7 mA h g−1 to 360.9 mA h g−1, while the MoS2/TiO2 nanohybrid delivers a discharge specific capacity of 802 mA h g−1 with a capacity retention of 92%. The MoS2/TiO2 hybrid nanostructures possess more stable cycle stability and higher discharge capacities than the bare MoS2. The coulombic efficiency of MoS2/TiO2 hybrid is also higher than bare MoS2. The cycling performance of bare acetylene black and TiO2 were shown in Fig. S6.† We assess that 10 wt% of acetylene black and 14.29 wt% of TiO2 contribute ∼40 mA h g−1 to the discharge capacity in total. The rate behavior was shown in Fig. 6d. The 3D nanoflower-like MoS2/TiO2 hybrid displays a reversible discharge capacity of 660 mA h g−1 at a current density of 1000 mA g−1 and retains a capacity of about 760 mA h g−1 as the current density is back to 100 mA g−1, indicating the good capacity recovery. Comparably, the bare MoS2 exhibits the inferior cyclic capacity retention and rate capability. The excellent electrochemical performance may be attributed to the favorable synergistic effect between MoS2 and TiO2. The TiO2 nanoparticles can enhance the structure stability and shorten the transport of ions across the surface.Electrochemical impedance spectroscopy (EIS) was carried out to study the electrode kinetics of the materials (Fig. 7). The Nyquist plots were simulated by the equivalent circuit as depicted in Fig. 7b. Re represents the resistance contribution from the electrolyte, electrode and the passive film between them. The symbol Rsf represented by the semicircle at high frequency are due to the Li+ migration through the solid electrolyte interphase (SEI) film. The symbol Rct are assigned to the charge-transfer resistance at the electrode/electrolyte interface, which is shown by a semicircle in mid-frequency region. The slope line in the low frequency region relates to Li+ diffusion processes in the active material. The EIS experiments of MoS2/TiO2 hybrid and bare MoS2 were conducted at OCV (open circuit potential) firstly (Fig. 7a). As can be seen, the MoS2/TiO2 hybrid shows a smaller semicircle diameter than the MoS2, indicating that the MoS2/TiO2 hybrid has lower charge transfer resistance. The charge-transfer resistance (Rct) of the MoS2/TiO2 hybrid and MoS2 are 120.9 Ω and 148.8 Ω, respectively. Fig. S7† shows the Nyquist plot for the MoS2/TiO2 hybrid and bare MoS2 after the first discharge and charge process. The impedance data values are summarized in Table S1.† At the end of the 1st discharge, the semicircle at high frequency appears because of the resistance of surface-passivation layer.30 The Rsf of MoS2/TiO2 hybrid and MoS2 are 37.6 Ω and 108.2 Ω, respectively. Such phenomenon indicates the formation of a thick SEI layer on the surface.31 Therefore, the decreasing tendency of Rct could be observed. However, the Rct of MoS2/TiO2 hybrid (114.9 Ω) is also much lower than MoS2 (138.5 Ω). After the 1st charge, the diameter of semicircle at mid-frequency is significantly enlarged. The increasing charge transfer resistance may due to the volume expansion of MoS2 after the first cycle. Nevertheless, the MoS2/TiO2 (195.4 Ω) shows a smaller semicircle diameter than the MoS2 electrode (259.7 Ω), indicating that the MoS2/TiO2 hybrid has lower charge transfer resistance (Rct). The effect of the modification with TiO2 may be verified. The modification of TiO2 may stabilize the structure of MoS2 and alleviate volume change. The MoS2/TiO2 hybrid shows lower slope than bare MoS2, indicating the better lithium ion kinetics in the electrode materials. It may due to attachment of TiO2 particles onto the surface of MoS2 can greatly enhance electron transport. Consequently, a favorable synergistic effect between the TiO2 nanoparticles and MoS2 nanosheets is supposed.
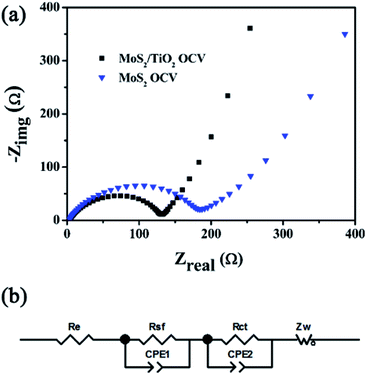 | ||
| Fig. 7 (a) Nyquist plots of the MoS2/TiO2 hybrid and bare MoS2 electrodes, (b) equivalent circuits for fitting Nyquist plots. | ||
4. Conclusions
In summary, TiO2 nanoparticles decorated MoS2 nanoflowers have been successfully developed by a two-step hydrothermal process. As the anode materials for LIBs, the electrochemical performance of MoS2/TiO2 hybrid is better than bare MoS2. This may be due to the hybridization with TiO2 be able to stabilize the structure of MoS2 and effectively accommodates the volume changes. Meanwhile, the TiO2 nanoparticles can shorten the transport of ions across the surface. This work opens up an avenue for the rational design of other anode composite materials in high performance LIBs.Acknowledgements
We appreciate the financial support of the NSFC (U1503391).Notes and references
- X. Cao, Y. Shi, W. Shi, X. Rui, Q. Yan, J. Kong and H. Zhang, Small, 2013, 9, 3433–3438 CrossRef CAS PubMed.
- Y. Xu, G. Yin, Y. Ma, P. Zuo and X. Cheng, J. Mater. Chem., 2010, 20, 3216–3220 RSC.
- T. Stephenson, Z. Li, B. Olsen and D. Mitlin, Energy Environ. Sci., 2014, 7, 209–231 CAS.
- X. Xu, W. Liu, Y. Kim and J. Cho, Nano Today, 2014, 9, 604–630 CrossRef CAS.
- J. Ye, L. Ma, W. Chen, Y. Ma, F. Huang, C. Gao and J. Y. Lee, J. Mater. Chem. A, 2015, 3, 6884–6893 CAS.
- H. Hwang, H. Kim and J. Cho, Nano Lett., 2011, 11, 4826–4830 CrossRef CAS PubMed.
- X. Li, W. Li, M. Li, P. Cui, D. Chen, T. Gengenbach, L. Chu, H. Liu and G. Song, J. Mater. Chem. A, 2015, 3, 2762–2769 CAS.
- S.-K. Park, S.-H. Yu, S. Woo, J. Ha, J. Shin, Y.-E. Sung and Y. Piao, CrystEngComm, 2012, 14, 8323–8325 RSC.
- U. K. Sen and S. Mitra, ACS Appl. Mater. Interfaces, 2013, 5, 1240–1247 CAS.
- S. Wang, X. Jiang, H. Zheng, H. Wu, S.-J. Kim and C. Feng, Nanosci. Nanotechnol. Lett., 2012, 4, 378–383 CrossRef CAS.
- Z. Hu, L. Wang, K. Zhang, J. Wang, F. Cheng, Z. Tao and J. Chen, Angew. Chem., 2014, 126, 13008–13012 CrossRef.
- G. Tang, J. Sun, C. Wei, K. Wu, X. Ji, S. Liu, H. Tang and C. Li, Mater. Lett., 2012, 86, 9–12 CrossRef CAS.
- S. Ding, J. S. Chen and X. W. D. Lou, Chem.–Eur. J., 2011, 17, 13142–13145 CrossRef CAS PubMed.
- L. Zhang, W. Fan, W. W. Tjiu and T. Liu, RSC Adv., 2015, 5, 34777–34787 RSC.
- G.-H. Lee, S.-J. Kim, M.-C. Kim, H.-S. Choe, D.-M. Kim, S.-B. Han, D.-H. Kwak, J. H. Jeong and K.-W. Park, RSC Adv., 2016, 6, 92259–92266 RSC.
- L. Hu, Y. Ren, H. Yang and Q. Xu, ACS Appl. Mater. Interfaces, 2014, 6, 14644–14652 CAS.
- L. Yang, S. Wang, J. Mao, J. Deng, Q. Gao, Y. Tang and O. G. Schmidt, Adv. Mater., 2013, 25, 1180–1184 CrossRef CAS PubMed.
- Y. Chen, B. Song, X. Tang, L. Lu and J. Xue, Small, 2014, 10, 1536–1543 CrossRef CAS PubMed.
- B. Chen, N. Zhao, L. Guo, F. He, C. Shi, C. He, J. Li and E. Liu, Nanoscale, 2015, 7, 12895–12905 RSC.
- X. Xu, Z. Fan, S. Ding, D. Yu and Y. Du, Nanoscale, 2014, 6, 5245–5250 RSC.
- Q. Xiang, J. Yu and M. Jaroniec, J. Am. Chem. Soc., 2012, 134, 6575–6578 CrossRef CAS PubMed.
- Q. Pang, Y. Zhao, X. Bian, Y. Ju, X. Wang, Y. Wei, B. Liu, F. Du, C. Wang and G. Chen, J. Mater. Chem. A, 2017, 5, 3667–3674 CAS.
- X. Zhu, C. Yang, F. Xiao, J. Wang and X. Su, New J. Chem., 2015, 39, 683–688 RSC.
- C. Liu, L. Wang, Y. Tang, S. Luo, Y. Liu, S. Zhang, Y. Zeng and Y. Xu, Appl. Catal., B, 2015, 164, 1–9 CrossRef CAS.
- W. Zhuang, L. Li, J. Zhu, R. An, L. Lu, X. Lu, X. Wu and H. Ying, ChemElectroChem, 2015, 2, 374–381 CrossRef CAS.
- G. Du, Z. Guo, S. Wang, R. Zeng, Z. Chen and H. Liu, Chem. Commun., 2010, 46, 1106–1108 RSC.
- M. Mao, L. Mei, D. Guo, L. Wu, D. Zhang, Q. Li and T. Wang, Nanoscale, 2014, 6, 12350–12353 RSC.
- T.-F. Yi, J.-Z. Wu, M. Li, Y.-R. Zhu, Y. Xie and R.-S. Zhu, RSC Adv., 2015, 5, 37367–37376 RSC.
- K. Chang and W. Chen, ACS Nano, 2011, 5, 4720–4728 CrossRef CAS PubMed.
- B. Chen, N. Zhao, L. Guo, F. He, C. Shi, C. He, J. Li and E. Liu, Nanoscale, 2015, 7, 12895–12905 RSC.
- T. S. Sahu and S. Mitra, Sci. Rep., 2015, 5, 12571 CrossRef CAS PubMed.
Footnote |
| † Electronic supplementary information (ESI) available. See DOI: 10.1039/c7ra06294j |
| This journal is © The Royal Society of Chemistry 2017 |

