 Open Access Article
Creative Commons Attribution 3.0 Unported Licence
Novel highly stable β-cyclodextrin fullerene mixed valent Fe-metal framework for quick Fenton degradation of alizarin†
Aniruddha Gogoia,
Madhukar Navgireb,
Kanak Chandra Sarmaa and
Parikshit Gogoi *cd
*cd
aDepartment of Instrumentation & USIC, Gauhati University, Guwahati 781014, Assam, India
bDepartment of Chemistry, Jijamata College of Science & Arts, Bhende, Ahmadnagar, Maharastra, India
cDepartment of Chemistry, Nowgong College, Nagaon 782001, Assam, India. E-mail: parikk100@gmail.com
dSchool of Chemical and Biomolecular Engineering, Renewable Bioproducts Institute, Georgia Institute of Technology, Atlanta, Georgia 30318, USA
First published on 18th August 2017
Abstract
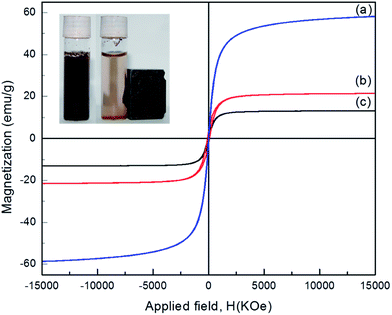
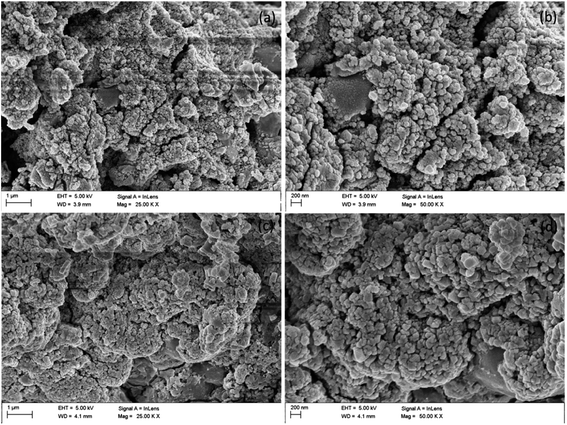
β-Cyclodextrin (β-CD) supported magnetic nanoscaled fullerene/Fe3O4 (CDFMNPs) and fullerene/Fe3O4 (FMNPs) composites were prepared and characterized. These composites can be utilized as heterogeneous catalysts for the Fenton oxidation reaction to degrade alizarin in aqueous solutions. The saturation magnetization (Ms) value of quasi-spherical CDFMNPs was found to be 13.16 emu g−1 and their diameter was in the range of 25–30 nm. The catalytic activities of the prepared materials were tested with varying conditions of pH, amount used and the concentration of H2O2 for degradation of alizarin at room temperature. The exceptionally high degradation efficiency of CDFMNPs was observed for alizarin at pH 3 with 2.0 g L−1 catalyst and 25 mM of H2O2. The increased oxidative degradation efficiency is attributed mainly to the formation of active hydroxyl radicals (˙OH) on the surface of the catalyst, which are generated by the active decomposition of H2O2 by the solid heterogeneous catalyst and the promoting effect of β-CD. CDFMNPs can be magnetically separated and the catalyst was found to be reusable and stable for five successive runs with no significant loss of catalytic activity. In the magnetic environment of Fe3O4 nanoparticles, fullerene has a crucial role to enhance the activity by increasing the stability with nominal iron leaching. Based on mass analysis of alizarin degradation, the formation of aliphatic acids and monocyclic compounds through phthalic anhydride and di-methyl phthalate established the proposed degradation path.
1. Introduction
The ever increasing pollution of water and soil by different industries, agricultural and domestic activities has been a major concern with respect public health due to recalcitrant toxic organic pollutants including dyes. Effluents from these activities have a high toxic organic content, color strength and resistant to degradation by light, chemicals and biological treatment.1,2 Most of these compounds are responsible for numerous diseases, including cancer, due to their toxicity as mentioned by the European community and US Environmental protection agency.3 Therefore, wastewater treatment is essential before discharge into the environment. Numerous methods based on adsorption, photocatalytic degradation, ion exchange and advanced oxidation process (AOP) viz. Fenton oxidation, etc. have been adopted to eliminate these dyes and stable organic pollutants.2,4–8 In spite of these methods, there is an urgent environmental need to develop more effective catalytic systems for degradation of pollutants. Fenton oxidation processes consisting of iron (Fe2+/Fe3+) in heterogeneous phase and H2O2 would be the better choice. Unlike other oxidation processes, the generation of hydroxyl radicals in the Fenton process is from ferrous ions and hydrogen peroxide in aqueous solution. Besides this fact, the catalytic activities of heterogeneous Fenton systems depend on numbers of other parameters; mainly solution pH, catalyst dosage, substrate concentration, H2O2 concentration and reaction time.9–11In the recent years, magnetic nanoparticles with low iron dissolution have gained attention as a catalyst for the degradation of organic dyes due to their remarkable features such as a large specific surface area and easy recovery of catalyst.12 The application of magnetic Fe3O4 particles are limited in different media as it has less number of surface active functional groups, tend to aggregate, formation of clusters and iron leaching which reduce their activity and stability.13 Thus, surface modification of Fe3O4 is essential and choosing the right candidate to enhanced stability of the Fe3O4 is a challenge, depending on the type of application. To overcome these limitations, some studies have reported the use of support materials such as clays, Nafion, activated carbon, zeolite, fullerene, carbon nanotubes, silica, polymers, metal oxides etc.11,13–20 To keep iron in heterogeneous phase, use of carbon based materials are the advantageous due to its unique catalytic properties including the stability in acidic medium and higher temperature.21 Jaafarzadeh et al. reported the Fenton oxidation of tetracycline, catalyzed by powder activated carbon/Fe3O4 hybrid composite with good stability of the catalyst within 4 h.22 Nidheesh et al. found that iron loaded on activated carbon can effectively degrade rhodamin B in aqueous medium by Fenton process.23 Degradation of phenol by carbon supported Fe catalyst24 and orange II removal by Fe supported on carbon nanotubes25 showed good catalytic activities, but with less stability of the catalyst in terms of the high amount of Fe leaching in the former case after the reaction. Despite some progresses have been made so far, the industrial application of heterogeneous Fenton catalyst is still limited. Our strategy is to develop a magnetically recoverable, decently stable catalytic system with high catalytic activity towards dye degradation in the absence of light irradiation.
Fullerene (C60) is a hollow sphere of carbon, which has a stable cage structure with high electron affinity (can accept up to six electrons) and resistant to oxidation. It has unique properties to form composites with various materials, ability to trap substances inside the cage and to act as a photo catalyst etc.26–28 Encapsulation of fullerene to metal oxide provides ability to oxide surface by resisting air oxidation and maintains good magnetic properties. Synthetic strategies to produce nanocomposites of fullerene and magnetic iron oxide nanoparticles have been reported recently. Iron oxide forms strong colloidal assembly with fullerene at various pH on air–water interface. Zerovalent iron–fullerene nanocomposite system was reported to produce reactive oxygen species and O2, both in the presence and absence of UV light at near neutral pH for bacterial inactivation.8,29,30 It is expected that binding of fullerene with iron oxide likely to minimize iron precipitation through co-ordination. In this context, we hypothesized that doping of fullerene to magnetic nanoparticles will enhance the stability and generate reactive oxygen species (ROS) in the presence of H2O2 to act as a heterogeneous catalyst without UV light. Further, for surface modification and to increase the activity of the catalyst, cyclodextrin was found to be one of the suitable material.31 β-Cyclodexrtin (β-CD) is a cyclic oligosaccharide with 7 membered cyclic D-glucose units connected through α-(1 → 4) glucosidic linkages to form a cone shaped cylindrical cavity. Cyclodextrin can form self-assembled organic–inorganic framework with metal oxide surface by forming hydrogen bond through hydroxyl groups of the cyclodextrin. It also forms host–guest inclusion complexes selectively with different organic molecules through their hydrophobic cavity. The host–guest interactions are mainly hydrogen bonding and van der Waals forces between β-CD and organic molecules.32–36 Therefore, the β-CD and fullerene/Fe3O4 expected to simplify the stability and activity issues related to degradation of dyes in Fenton system.
In the present study, highly stable β-CD coated fullerene/Fe3O4 nanostructures were prepared via a facile co-precipitation method and used as a Fenton catalyst for the degradation of alizarin dye from aqueous solution. Alizarin, also called 1,2-dihydroxyanthraquinone belong to madder plant with formula C14H8O4 is a major pigment in textile industries.37–39 To the knowledge of the authors, no studies have been reported till now on the heterogeneous Fenton degradation of alizarin from aqueous solutions using β-CD coated fullerene/Fe3O4 nanocomposite at optimum mild operating conditions.
2. Experimental section
2.1 Preparation of fullerene/Fe3O4
Fullerene/Fe3O4 nanoparticles (MFNPs) were prepared by conventional co-precipitation method. The reaction mixture was obtained by dissolving 0.86 g of FeCl2·4H2O (Merck), 2.63 g of FeCl3·6H2O (Merck) and fine powdered fullerene (1 wt%) (C60, Sigma-Aldrich, 99.5%) in mL of de-ionized water with constant stirring. NH4OH solution was added dropwise to maintain the pH = 8. The mixture was stirred for 12 h for complete precipitation and then kept 12 h for aging. The resultant precipitate was magnetically separated, washed several times with deionized water and dried in oven at 90 °C for 12 h.2.2 Preparation of β-cyclodextrin-fullerene/Fe3O4
The β-CD fullerene/Fe3O4 nanoparticles (CDMFNPs) were also prepared by simple method. The synthesized MFNPs (1.8 g) were mixed with (0.5 g) of β-cyclodextrin (Himedia) in 75 mL of deionized water with constant stirring. The mixture was kept under constant stirring for 24 h and then kept another 24 h for aging. The resultant particles were separated magnetically from residual solution and washed several times with deionized water and dried in oven at 90 °C for 12 h.2.3 Characterization of β-cyclodextrin-fullerene/Fe3O4
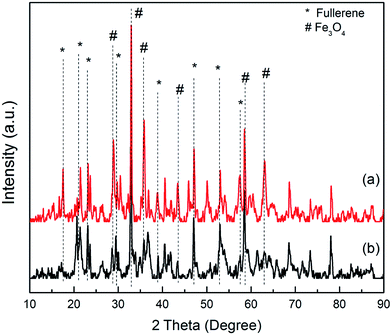
The formation of fullerene/Fe3O4 (FMNPs) and β-cyclodextrin coated fullerene/Fe3O (CDFMNPs) were investigated systematically by different sophisticated analytical techniques.Powder X-ray diffraction (XRD) measurements were observed by using a Bruker/D2 phaser, Germany; diffractometer (Cu Kα radiation source, λ = 1.542 Å, operates at 30 kV and 10 mA). The sample scan was done over a diffraction angle of 2θ in the range of 20–80° in 0.02° step scan with exposure time of 2 s.
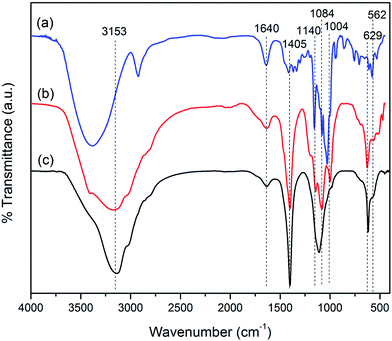
Fourier transform infrared spectroscopy (FTIR) measurements were performed with a Perkin Elmer, USA/Spectrum Two; spectrometer using KBr pellet over a range of 4000–400 cm−1. Same setup is used to perform pyridine-FTIR study of the synthesized samples.
Magnetic measurements were carried out using a vibrating sample magnetometer (VSM; Lakeshore 7410).
Field Emission Scanning Electron Microscopy (FESEM) study was performed on Carl Zeiss-Sigma instrument. Transmission Electron Microscopy (TEM) and High Resolution TEM (HRTEM) characterization was done on JEM-2010 (JEOL), instrument.
Thermogravimetric analysis (TGA) was performed by using a Mettler Toledo (TGA/SDTA 581e) thermogravimetric analyzer from 30–700 °C with a heating rate of 10 °C min−1 under nitrogen atmosphere.
Electron Paramagnetic Resonance (EPR) studies were performed by using a JEOL (JES-FA200) EPR spectrometer.
UV-vis DRS (Diffuse Reflectance Spectra) measurements were performed by Perkin Elmer (Lambda 750 UV/Vis/NIR) spectrophotometer using a diffuse reflectance attachment. BaSO4 matrix was used as a reference to record the spectra in the range of 200–800 nm.
The absorption spectra were measured using a Shimadzu/UV-1800 UV-vis spectrophotometer to determine band gap energy and degradation study.
2.4 Catalytic test study
The performances of the prepared catalyst were tested by carrying out batched degradation reaction of alizarin (Sigma-Aldrich, 97%) at room temperature. Typically, samples for alizarin degradation system were prepared by adding required amount of catalyst to a solution containing known amount of dyes (10 mM) in a conical flask (100 mL), ultra-sonicated to make a homogeneous suspension followed by constant stirring. To initiate the reactions a known dosage of H2O2 was added to each reaction mixture. The catalyst amount, H2O2 and pH concentrations were varied systematically from 0.25 g L−1, 5–25 mM and pH 3–10 respectively at an alizarin concentration of 10 mM. The various pH conditions were maintained by using 1 M NaOH or H2SO4. The progress of the reaction was monitored and determined by measuring absorbance at a regular interval by taking aliquots of the reaction mixture to evaluate the catalytic activity in the range of 300–800 nm. The change in absorbance with respect to time of alizarin degradation (λmax at 497–526 nm) was measured for all sets of catalyst. The experiments were performed in triplicate to check the reproducibility of results and the values are presented as means and standard deviation. The leaching of iron from the catalyst surface at the optimum reaction conditions during the process of degradation of alizarin was studied.The Fe2+ ion concentration in solution was measured using 1,10-phenanthroline method by spectrophotometrically at 510 nm. The total dissolved iron was also measured by same method using hydroxylamine hydrochloride as a reducing agent for the experiment.18,40,41
The degraded sample was filtered with 0.02 μm filter paper after the reaction and Liquid Chromatography Mass Spectrometry (LC-MS) analysis was carried out to determine the intermediate and final products of alizarin degradation. Control and degraded sample of alizarin was analyzed by the Agilent 6520 series Accurate-Mass Q-TOF LC/MS spectrometer. In this LC/MS system, Liquid Chromatography (LC) part is coupled with High Resolution Mass Spectrometer (HRMS). Following were the operating conditions for the system: first the instrument was calibrated with a standard calibrated solution for ESI-(+) mode in the mass range of 50–500 m/z to record mass spectra within this range. The system was operated on electrospray ionization (ESI), positive (+) mode. The column used for separation of the products was C18 (Agilent Eclipse plus, 3.5 μm, 4.6 × 100 mm). The solvent used as mobile phase was a mixture of acetonitrile water with a flow rate of 3 mL min−1. A volume of 20 μL samples was loaded with a syringe to inject through capillary column. Nitrogen gas used as nebulizer gas and collision cell gas (nitrogen) was 99.999% pure. The other parameters were set as standard for the system. The degradation products identified by LC-MS studies were verified by standard mass spectra database, literature and comparing with MS spectra of those of known chemicals.
3. Results and discussions
3.1 Characterization of magnetic nanoparticles
![[double bond, length as m-dash]](https://www.rsc.org/images/entities/char_e001.gif) C– and –C–R stretching vibrations, respectively. For CDFMNPs, the absorption bands in the range of 1200–900 cm−1 with new peaks are characteristic for β-CD. The peaks at 1140 cm−1 and 1084 cm−1 can be assigned to coupled ν (C–C/C–O) vibration and antisymmetric glycosidic ν (C–O–C) vibration, respectively.33,36 Some absorption bands of FMNPs also present in CDFMNPs with a little shift in position, suggested the successful incorporation of β-CD on the surface of the FMNPs.
C– and –C–R stretching vibrations, respectively. For CDFMNPs, the absorption bands in the range of 1200–900 cm−1 with new peaks are characteristic for β-CD. The peaks at 1140 cm−1 and 1084 cm−1 can be assigned to coupled ν (C–C/C–O) vibration and antisymmetric glycosidic ν (C–O–C) vibration, respectively.33,36 Some absorption bands of FMNPs also present in CDFMNPs with a little shift in position, suggested the successful incorporation of β-CD on the surface of the FMNPs.
For FMNPs, the 5% weight loss up to 120 °C is due to the surface bonded water molecules, second 35% weight loss between 200–450 °C is due to the decomposition of remaining organic residue, while after 450 °C due to the decomposition of oxygen containing functional groups. The final weight loss of 16% in the range of 580–650 °C is due to the degradation of fullerene. Thereafter, the composite is stable; it confirms strong binding between the fullerene and Fe3O4 present in FMNPs.
UV-vis DRS analysis. To understand the optical properties of synthesized FMNPs and CDFMNPs, UV-visible DRS spectra were taken and the observed results are displayed in Fig. S3 (ESI†). The absorption intensities of FMNPs were higher than CDFMNPs. For FMNPs two absorption bands were observed at 482 nm and 542 nm whereas for CDFMNPs only maximum absorption band appeared around 542 nm, clearly indicates the change. The lower intensity of CDFMNPs band could be due to the change of crystalline size caused by the incorporation of β-CD.
UV-vis spectroscopy. The optical absorption spectral study is used to understand the electronic structure associated with the band gap of a material as electronic transition within the molecule is responsible for absorption to occur. Fig. S4(a & c) (ESI†) shows the observed optical absorption spectra in the range of 200–800 nm for FMNPs and CDFMNPs. For FMNPs, observed spectra have two distinct absorption bands, one at 301 nm of the UV region and another at 414 nm of the visible region. CDFMNPs spectra shows only one well defined absorption peak at 303 nm, which clearly indicates that the change occurred, is due to the addition of β-CD. Using Tauc equation band gap energy (Ebg) can be calculated for both the catalyst. The equation is:
| (αhν)2 = A(hν − Ebg) |
3.2 Catalytic activity of β-cyclodextrin coated fullerene/Fe3O4 nanocomposite
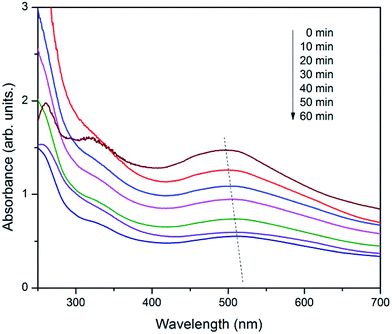
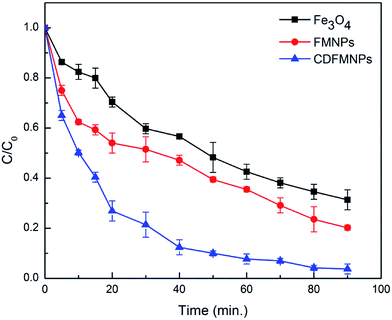
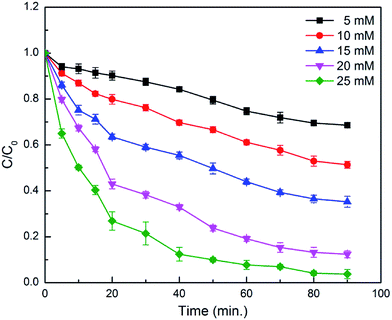
The catalytic activity of the CDFMNPs was investigated for the degradation of alizarin at a planned reaction conditions. Fig. 6 shows the typical UV-vis degradation spectra of alizarin in the presence of H2O2 (λmax at 497–526 nm) for 1 h. Addition of CDFMNPs results in a progressive decrease of the typical alizarin absorption band with slight change in adsorption position, suggested the degradation of alizarin. Reaction with control experimental conditions showed that CDFMNPs without H2O2 or H2O2 without catalyst do not give alizarin degradation. Fig. 7 shows the alizarin degradation by Fe3O4, FMNPs and CDFMNPs with 2 g L−1 catalyst, H2O2 (25 mM) at pH 3 where, alizarin concentration was 10 mM at room temperature. It was found that CDFMNPs degrades alizarin almost completely (about 93%) within 1 h and at same reaction condition FMNPs and Fe3O4 nanoparticles degrades only about 64% and 57% of the alizarin concentration, respectively. The higher degradation efficiency of the composite was due to the higher number of surface active groups and more effective surface area provided by the addition of β-CD.Reaction was carried out with varying amount of H2O2 concentration viz. 5 mM, 10 mM, 15 mM, 20 mM and 25 mM to know the effect of H2O2 on Fenton reaction. Fig. 8 & S7 (ESI†) shows that the 25 mM H2O2 has the height degradation efficiency for 10 mM of alizarin indicating that it directly depends on the concentration of hydroxyl radical produced from the reaction of H2O2 and Fe2+. In Fenton or Fenton like reactions the active species for degradation is hydroxyl radical and is formed during the electron transfer process of Fe2+ and Fe3+.47 Fe2+ initiates the reaction faster as compared to Fe3+ and series of reactions takes place quickly. Moreover, Fe3+ reacts with H2O2 to regenerate Fe2+ to reuse it in the Fenton reaction again.5,48 We have performed the reactions at pH 3, as in acidic conditions H2O2 is more stable. In basic conditions, the oxidative ability of H2O2 decreases because of its decomposition to produce water and oxygen.11 The use of low H2O2 concentration for the alizarin degradation makes it promising for the system.
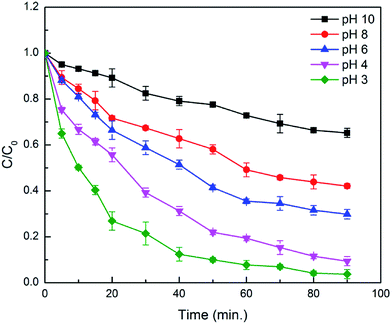
As the pH of the reaction plays an important role, varying pH of 3, 4, 6, 8 and 10 were used to study the effect of pH on degradation of alizarin. Hydrogen peroxide and Fe2+ show better stability at pH lower than 3.5, consequently, give more efficiency at lower pH.21,47 Moreover, stability of Fe2+ ions decreases above pH 4 and converted to Fe3+ and can form intermediate hydroxo complexes.11 It was found from Fig. 9 & S8 (ESI†) that at pH value of 3 degradation efficiency was maximum, decrease from pH 4 to 8 and considerably decreases after pH 8. The order of decreasing efficiency was: pH 3 < pH 4 < pH 6 < pH 8 < pH 10. The higher degradation efficiency at pH 3 is due to the production of more number of reactive ˙OH radical in acidic conditions than other pH range, confirms the effectiveness of Fenton reaction at lower pH range.
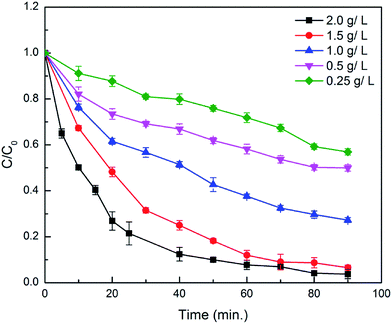
Similarly, the Fig. 10 shows the effect of varied amount of catalyst from 0.25–2.0 g L−1 on the degradation of alizarin and it was found that the 2.0 g L−1 catalyst shows the maximum degradation under above mentioned reaction conditions at room temperature. The trend of increasing the degradation with catalyst loading is due to the increase in active sites which acted as peroxidase like catalyst to generate hydroxyl radicals from H2O2. The excess of catalyst loading decreases the production of hydroxyl radicals by adsorbing H2O2 on the surface of the catalyst thereby decreasing the degradation rate of 4-chlorophenol at optimum H2O2 concentrations by Fe3O4@β-CD.48 Moreover, increasing catalyst loading decreases the density of surface adsorbed H2O2 for hydroxyl radical production since the degradation reaction believed to be occurring on the surface of the catalyst. Again, agglomeration of nanoparticles due to excessive catalyst loading is another reason of decreasing hydroxy radical production in most of heterogeneous Fenton reactions.48–50
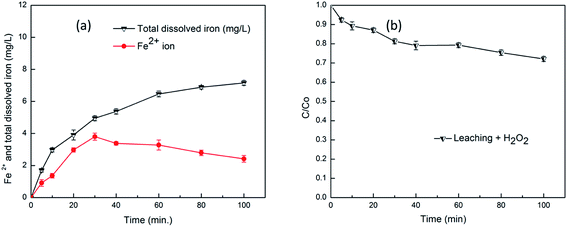
The metal components in the catalyst framework are considered to play the vital role in catalytic reactions.5 Similarly, in our work also the degradation reaction depends on the metal sites in the catalyst framework, so it is necessary to analyze the stability of the catalysts in liquid-phase oxidation. The leaching of Fe2+ and total dissolved iron in solution was determined for the CMFMNPs and results were shown in the Fig. 11(a). It is important to determine the iron dissolution, as it is directly related to the catalytic activity of the catalyst, in acidic condition as it favours the process in comparison to neutral or basic conditions.51 The leaching experiments were carried out in optimum Fenton oxidation reaction conditions of the alizarin degradation for 2.0 g L−1 catalyst. Other reaction parameters were: alizarin concentration 10 mM, H2O2 25 mM, pH 3 at room temperature. From the Fig. 11(a), it can be seen that leaching of ferrous ion steadily increased up to 3.8 mg L−1 at 30 min, suggested the faster Fenton process and then decreased to 2.4 mg L−1 at 100 min. At this stage the oxidative process is further enhanced by the hydroxylated form of fullerene called fullerol by producing more ROS.52 Simultaneously, the total dissolved iron in the solution increases continuously and attained the value of 7.1 mg L−1 at 100 min. The continuously increased dissolved iron value was due to the combined dissolution of ferrous and ferric irons from the CDFMNPs catalyst. The observed values were less than the previously reported values of our iron leaching for Fe3O4–CeO2 composite,18 where Fe2+ ions were oxidized to Fe3+ ions and form intermediate Fe(III) complexes. It could be expected that the initial release of ferrous ion from CDFMNPs was due to the oxidation by H2O2 and decreasing trend was due to the conversion of ferrous to ferric ion, which results the increases of Fe2+ and Fe3+ (total dissolved iron).
The homogeneous phase reaction was also performed after the heterogeneous process optimization was done. For a homogeneous reaction to occur, the CDFMNPs catalyst was stirred in a reaction mixture and removed by an external magnet after 100 min. Then the alizarin was added into the reaction mixture, containing leached iron, with 200 μL of H2O2 to initiate the reaction. From Fig. 11(b), it can be seen that only 21% of alizarin was degraded within 1 h because of the iron leaching in a homogenous manner, value increased a bit to 28% after 100 min of reaction time. So, the degradation of alizarin is predominantly due to the heterogeneous Fenton process with a minor contribution from homogeneous process. The feasibility of heterogeneous process was supported by stabilizing effect of fullerene and enhanced activity of β-CD. The aggregation or incorporation of fullerene onto iron oxide in solution greatly effects the morphology of the composite thereby implications on reactivity and enhance the stability of the system. The interaction of fullerene with iron oxide nanoparticles produces ordered assemblies along with amorphous aggregates with short range periodic structures during immobilization.8 In magnetite Fe cations occupy the tetrahedral and octahedral sites within the cubic inverse spinal structure of it. The Fe2+ and Fe3+ both occupy the octahedral sites and retaining the crystal structure during the reversible oxidation and reduction of Fe species. These structural features make it efficient for degrading dyes from aqueous solutions by using the electrogeneration of Fenton catalysts.44
3.3 ESI mass analysis of alizarin
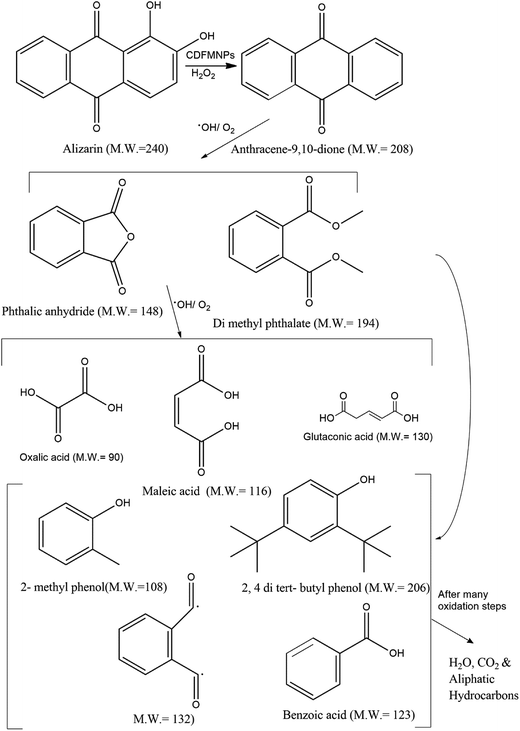
Liquid chromatography mass spectroscopic (LCMS) study in positive ion mode was performed to know the product formed in degradation reaction by analyzing the alizarin solution after the reaction. The molecular ion peak of alizarin at m/z 240 was not observed after degradation by CDFMNPs, instead we observed a number of different peaks in different interval of time as shown in the Fig. 12(a and b) and S9 (ESI†). The oxidation of alizarin followed a complex path and started with the reactive ˙OH radical attack. Upon oxidation with H2O2 and catalyst it loses its two hydroxyl groups one by one to produce anthracene-9,10-dione (208 amu) and produced [M + 1]+ peak at m/z 209, intake its parent ring structure. In the next step ring cleavage took place to produce monocyclic aromatic product viz. dimethyl phthalate (194 amu) and phthalic anhydride (148 amu) corresponds to [M + 1]+ peak with m/z at 195 and [M]+ peak with m/z at 148 respectively. Further oxidation of the products give [M]+ peak at m/z 116 and at m/z 130, [M+ + Na] peaks at m/z 113 corresponds to maleic acid (116 amu), glutaconic acid (130 amu) and oxalic acid (90 amu) respectively. Additionally, other degraded products of alizarin with monocyclic ring are, m/z at 207 for 2,4-di-tert-butyl phenol (206 amu), m/z at 123 for benzoic acid (123 amu). Benzoic acid appeared as [M]+ peak and other two products appeared in mass spectra as [M + 1]+ peak. Another [M + 1]+ peak with m/z at 109 can be identified as 2-methyl phenol (108 amu). The peak at m/z 113 for oxalic acid after combination with Na+ to appear as [M+]+ ion peak, as in ESI-(+)ve mode formation of sodium adduct is very common. At 18.6 s we observed only three prominent peaks in the mass spectra (Fig. S9 of ESI†) for benzoic acid (m/z = 123), dimethyl phthalate (m/z = 195) and compound with m/z 133, which could be a radical intermediate with M.W. 132. Since the degradation of alizarin in the presence of H2O2 by CDFMNPs is an oxidative process, it produces a few degraded products which could not be identified and may be appeared because of the produced from solvent or contamination. However, it is proved from the observed data that aromatic ring structure of the alizarin was destroyed or reduced by CDFMNPs and it is expected that after a number of oxidative steps all aromatic rings opened up to form small molecules like H2O and CO2 and aliphatic hydrocarbons, which could not be identified by LC-MS study.53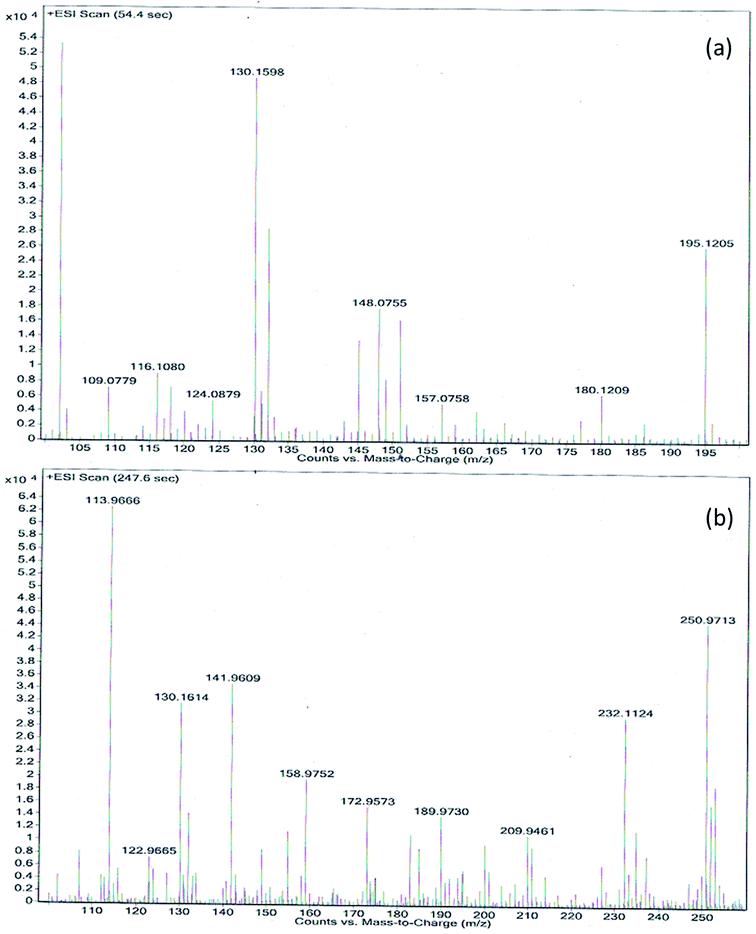 | ||
| Fig. 12 (a and b) LC-MS [ESI (+) ve mode] spectra of degraded alizarin by β-CD-fullerene/Fe3O4 (CDFMNPs). | ||
Probable degradation pathway of alizarin by Fenton system of CDFMNPs/H2O2 is depicted in Fig. 13, though the mechanism of heterogeneous Fenton process is not certain.54 During the multistep oxidative destruction process, ˙OH radical first produced dimethyl phthalate and phthalic anhydride after removal of two hydroxyl groups from alizarin. Further, oxidation executes the complete decolourization of alizarin and believed that after many oxidative steps cleavage of the aromatic ring take place to produce acids and different small molecules.
3.4 Reusability and recovery of the catalyst
It is important for a solid catalyst to be recovered after reaction and reused for a fresh set of experiment. The CDFMNPs can be easily recovered after every reaction with an external magnet (Fig. 3, inset) which was confirmed from its magnetization value as shown in VSM study. After every set of experiment catalyst was magnetically recovered, washed several times with ethanol and deionized water to remove any organic products and unreacted precursors. Then it was used for five consecutive runs. Table 1 shows the degradation efficiency and retained activity of the catalyst for alizarin. It was found that catalyst shown remarkable stability after a fifth run from about 93.2% to 80.2% degradation. The insignificant decrease of alizarin degradation and minor loss of catalytic activity is due to the deactivation of the catalyst by Fe(III) complex formation, nominal iron leaching from the catalyst surface and the catalyst lost during recovery process. Overall, catalyst has shown a significant activity under the studied experimental reaction conditions.| Number of cycle | First | Second | Third | Forth | Fifth |
|---|---|---|---|---|---|
| a Reaction conditions: [H2O2] = 25 mM, [alizarin] = 10 mM, catalyst = 2.0 g L−1, pH = 3 at room temperature. The experiments were performed in triplicate and the values are presented as means and standard deviation. | |||||
| Degradation (%) of alizarin | 93.2 ± 1.5 | 91.4 ± 2.1 | 88.1 ± 1.8 | 85.3 ± 2.1 | 80.2 ± 3.2 |
| Retained activity (%) | 100 | 98 ± 1.2 | 94 ± 2.0 | 91 ± 1.9 | 86 ± 2.2 |
4. Conclusions
We have presented here the synthesis of FMNPs and CDFMNPs with a simple method. The CDFMNPs show excellent activity towards alizarin degradation at optimum reaction conditions. The addition of fullerene has enhanced the activity of the magnetic composite with nominal iron leaching whereas coating of β-CD alters the crystalline nature, magnetic property and most importantly the surface activity of the catalyst. The oxidative degradation process predominantly occurs in heterogeneous manner as confirmed by quantification of insignificant amount of leached iron in solution. Because of these combined effects of fullerene and β-CD with magnetic nature of Fe3O4, this catalyst can effectively serve as a heterogeneous Fenton catalyst for the alizarin degradation reaction. Moreover, the catalyst can be separated magnetically and reused without any significant loss of catalytic activity up to five successive uses. These properties make the catalyst more attractive and provide the knowledge-base for future applications in the field of catalysis to understand the degradation mechanism of a wide range of structurally similar textile dyes to alizarin.Conflicts of interest
There are no conflicts to declare.Acknowledgements
Authors are highly thankful to NEHU, Shillong and Gauhati University, Guwahati for providing instrumental support.References
- A. Kohler, S. Hellweg, B. I. Escher and K. Hungerbühler, Environ. Sci. Technol., 2006, 40, 3395–3401 CrossRef PubMed.
- J. M. Chacon, M. T. Leal, M. Sánchez and E. R. Bandala, Dyes Pigm., 2006, 69, 144–150 CrossRef CAS.
- A. C. Pradhan, B. Nanda, K. Parida and M. Das, Dalton Trans., 2013, 42, 558–566 RSC.
- W. Li, R. Wu, J. Duan, C. P. Saint and D. Mulcahy, Chem. Eng. J., 2017, 313, 801–806 CrossRef CAS.
- Q. Sun, M. Liu, K. Li, Y. Han, Y. Zuo, J. Wang, C. Song, G. Zhang and X. Guo, Dalton Trans., 2016, 45, 7952–7959 RSC.
- E. R. Bandala, M. A. Pelaez, D. D. Dionysiou, S. Gelover, J. Garcia and D. Macías, J. Photochem. Photobiol., A, 2007, 186, 357–363 CrossRef CAS.
- S. Papic, D. Vujevic, N. Koprivanac and D. Sinko, J. Hazard. Mater., 2009, 164, 1137–1145 CrossRef CAS PubMed.
- S. Ghosh, N. R. Pradhan, H. Mashayekhi, S. Dickert, R. Thantirige, M. T. Tuominen, S. Tao and B. Xing, Environ. Sci. Technol., 2014, 48, 12285–12291 CrossRef CAS PubMed.
- B. Chen, Y. Liu, S. Chen, X. Zhao, W. Yue and X. Pan, Environ. Sci.: Nano, 2016, 3, 670–681 RSC.
- Y. Mu, F. Jia, Z. Ai and L. Zhang, Environ. Sci.: Nano, 2017, 4, 27–45 RSC.
- M. Blanco, A. Martinez, A. Marcaide, E. Aranzabe and A. Aranzabe, Am. J. Anal. Chem., 2014, 5, 490 CrossRef CAS.
- C. C. Kuan, S.-Y. Chang and S. L. Schroeder, Ind. Eng. Chem. Res., 2015, 54, 8122–8129 CrossRef CAS.
- B. Kakavandi and A. A. Babaei, RSC Adv., 2016, 6, 84999–85011 RSC.
- P. Tan, Y. Jiang, X.-Q. Liu, D.-Y. Zhang and L.-B. Sun, ACS Sustainable Chem. Eng., 2016, 4, 2223–2231 CrossRef CAS.
- B. Kalska-Szostko and M. Rogowska, J. Nanosci. Nanotechnol., 2012, 12, 6907–6912 CrossRef CAS PubMed.
- F. Velichkova, C. Julcour-Lebigue, B. Koumanova and H. Delmas, J. Environ. Chem. Eng., 2013, 1, 1214–1222 CrossRef CAS.
- S. Navalon, M. Alvaro and H. Garcia, Appl. Catal., B, 2010, 99, 1–26 CrossRef CAS.
- A. Gogoi, M. Navgire, K. C. Sarma and P. Gogoi, Chem. Eng. J., 2017, 311, 153–162 CrossRef CAS.
- D. Channei, B. Inceesungvorn, N. Wetchakun, S. Ukritnukun, A. Nattestad, J. Chen and S. Phanichphant, Sci. Rep., 2014, 4, 5757 CrossRef CAS PubMed.
- L. Xu and J. Wang, Environ. Sci. Technol., 2012, 46, 10145–10153 CrossRef CAS PubMed.
- R. S. Ribeiro, A. M. Silva, J. L. Figueiredo, J. L. Faria and H. T. Gomes, Appl. Catal., B, 2016, 187, 428–460 CrossRef CAS.
- N. Jaafarzadeh, B. Kakavandi, A. Takdastan, R. R. Kalantary, M. Azizi and S. Jorfi, RSC Adv., 2015, 5, 84718–84728 RSC.
- P. Nidheesh and R. Rajan, RSC Adv., 2016, 6, 5330–5340 RSC.
- J. Zazo, J. Casas, A. Mohedano and J. Rodríguez, Appl. Catal., B, 2006, 65, 261–268 CrossRef CAS.
- A. Rodriguez, G. Ovejero, J. Sotelo, M. Mestanza and J. Garcia, Ind. Eng. Chem. Res., 2009, 49, 498–505 CrossRef.
- Z. D. Meng, L. Zhu, J. G. Choi, M. L. Chen and W. C. Oh, J. Mater. Chem., 2011, 21, 7596–7603 RSC.
- J. A. Rodriguez, I. S. Ibarra, J. M. Miranda, E. Barrado and E. M. Santos, Anal. Methods, 2016, 8, 8466–8473 RSC.
- H. Keypour, M. Noroozi and A. Rashidi, J. Nanostruct. Chem., 2013, 3, 45 CrossRef.
- G. H. Lee, S. H. Huh, J. W. Jeong and H. C. Ri, J. Magn. Magn. Mater., 2002, 246, 404–411 CrossRef CAS.
- E. Erdim, A. R. Badireddy and M. R. Wiesner, J. Hazard. Mater., 2015, 283, 80–88 CrossRef CAS PubMed.
- X. Sun, C. Zheng, F. Zhang, L. Li, Y. Yang, G. Wu and N. Guan, J. Phys. Chem. C, 2008, 112, 17148–17155 CAS.
- J. Zhu, P. C. Wang and M. Lu, J. Braz. Chem. Soc., 2013, 24, 171–176 CrossRef CAS.
- J. Hu, D. Shao, C. Chen, G. Sheng, J. Li, X. Wang and M. Nagatsu, J. Phys. Chem. B, 2010, 114, 6779–6785 CrossRef CAS PubMed.
- S. Lv, Y. Song, Y. Song, Z. Zhao and C. Cheng, Appl. Surf. Sci., 2014, 305, 747–752 CrossRef CAS.
- R. Chalasani and S. Vasudevan, ACS Nano, 2013, 7, 4093–4104 CrossRef CAS PubMed.
- Y. Kang, L. Zhou, X. Li and J. Yuan, J. Mater. Chem., 2011, 21, 3704–3710 RSC.
- C. Ahn, X. Zeng, L. Li and S. K. Obendorf, Fashion and Textiles, 2014, 1, 22 CrossRef.
- C. Ahn, X. Zeng and S. K. Obendorf, Journal of the Korean Society of Clothing and Textiles, 2013, 37, 827–836 CrossRef.
- S. Pirillo, F. S. G. Einschlag, E. H. Rueda and M. L. Ferreira, Ind. Eng. Chem. Res., 2010, 49, 6745–6752 CrossRef CAS.
- H. Tamura, K. Goto, T. Yotsuyanagi and M. Nagayama, Talanta, 1974, 21, 314–318 CrossRef CAS PubMed.
- P. Feng, X. Guan, Y. Sun, W. Choi, H. Qin, J. Wang, J. Qiao and L. Li, J. Environ. Sci., 2015, 31, 175–183 CrossRef PubMed.
- C. Hui, C. Shen, T. Yang, L. Bao, J. Tian, H. Ding, C. Li and H. J. Gao, J. Phys. Chem. C, 2008, 112, 11336–11339 CAS.
- M. E. Navgire, P. Gogoi, B. Mallesham, A. Rangaswamy, B. M. Reddy and M. K. Lande, RSC Adv., 2016, 6, 28679–28687 RSC.
- G. S. Martinez, G. R. Morales, E. M. Campo, R. Romero, B. A. F. Uribe and R. Natividad, Electrochim. Acta, 2016, 195, 246–256 CrossRef.
- H. E. Ghandoor, H. Zidan, M. M. Khalil and M. Ismail, Int. J. Electrochem. Sci., 2012, 7, 5734–5745 Search PubMed.
- J. Lee, Y.-H. Choa, J. Kim and K. H. Kim, IEEE Trans. Magn., 2011, 47, 2874–2877 CrossRef CAS.
- P. Nidheesh, RSC Adv., 2015, 5, 40552–40577 RSC.
- M. Wang, G. Fang, P. Liu, D. Zhou, C. Ma, D. Zhang and J. Zhan, Appl. Catal., B, 2016, 188, 113–122 CrossRef CAS.
- X. Hu, B. Liu, Y. Deng, H. Chen, S. Luo, C. Sun, P. Yang and S. Yang, Appl. Catal., B, 2011, 107, 274–283 CrossRef CAS.
- R. Huang, Z. Fang, X. Yan and W. Cheng, Chem. Eng. J., 2012, 197, 242–249 CrossRef CAS.
- E. Matei, C. Predescu, A. Berbecaru, A. Predescu and R. Trusca, Digest Journal of Nanomaterials and Biostructures, 2011, 6, 1701–1708 Search PubMed.
- E. M. Hotze, T. Phenrat and G. V. Lowry, J. Environ. Qual., 2010, 39, 1909–1924 CrossRef CAS PubMed.
- B. Lai, Y. Zhou, J. Wang, Z. Yang and Z. Chen, Chemosphere, 2013, 93, 2805–2813 CrossRef CAS PubMed.
- A. Gogoi and K. C. Sarma, Mater. Chem. Phys., 2017, 194, 327–336 CrossRef CAS.
Footnote |
| † Electronic supplementary information (ESI) available. See DOI: 10.1039/c7ra06447k |
| This journal is © The Royal Society of Chemistry 2017 |

