 Open Access Article
Creative Commons Attribution 3.0 Unported Licence
Two-step ball-milling synthesis of a Si/SiOx/C composite electrode for lithium ion batteries with excellent long-term cycling stability†
Lingzhi Qiana,
Jin-Le Lan *ab,
Mengyao Xuea,
Yunhua Yu*a and
Xiaoping Yanga
aState Key Laboratory of Organic-Inorganic Composites, Beijing University of Chemical Technology, Beijing 100029, China. E-mail: yuyh@mail.buct.edu.cn; lanjl@mail.buct.edu.cn; Fax: +86-10-6442-2084; Tel: +86-10-6442-7698
bChangzhou Institute of Advanced Materials, Beijing University of Chemical Technology, Beijing 100029, China
First published on 25th July 2017
Abstract
SiOx-based anodes have attracted tremendous attention owing to their low cost, higher theoretical capacity than graphite and lower volume expansion than pure silicon. In this work, a simple and cost-effective two-step ball-milling method was proposed to fabricate Si/SiOx/C composites by using commercial SiO and graphite carbon as raw materials. The two-step ball-milling synthesis of the Si/SiOx/C composites can avoid the generation of an inert SiC phase and realize the uniform dispersion of Si/SiOx in graphite carbon, which offers good electrical conductivity and relieves the volume expansion of the Si/SiOx phase. Owing to the synergistic effect of the Si/SiOx phase and the graphite carbon, the typical Si/SiOx/C electrode exhibits a stable and high capacity of 726 mA h g−1 after 500 cycles at a current density of 0.1 A g−1 with a capacity retention of 82%. The two-step ball-milling preparation of the Si/SiOx/C composite provides a facile approach to fabricate high-performance SiOx-based anode materials.
1. Introduction
With the rapid increase of environmental problems and people's growing demands, lithium-ion batteries (LIBs) have attracted a great deal of attention and been widely used in electric vehicles and portable electronics due to their inherent advantages such as high energy density, long cycle life and non-memory effect.1–3 However, the commercial graphite anode material of LIBs, which offers a specific capacity of only 372 mA h g−1 and limited power density,4 cannot meet the increasing demand for high-energy storage capacity. Therefore, novel anode materials with high specific capacity and high power density are highly desirable.Silicon is an attractive anode material for LIBs due to the highest theoretical capacity of 4200 mA h g−1.5,6 However, the huge volume change during the charge and discharge process can cause a pulverization of the electrode and electric disconnection from current collectors, resulting in poor cycling stability. To tackle this problem, a variety of carbon frameworks such as 0D hollow carbon spheres,7 1D CNFs8 and 2D graphene9 were utilized to support Si nanoparticles. Nevertheless, owing to the difficulty in dispersion and the high cost of pure nano-silicon material, many scientists have paid attention to other inexpensive Si-based alternative materials such as silicon monoxide (SiO), which has obvious advantages of relatively smaller volume change.10 In recent years, there have been many reports on the fabrication of SiO/C composites as anode materials in LIBs by a simple high-energy ball-milling (HEBM) process.11–15 For instance, Chil-Hoon Doh's group14 prepared a SiO/C anode through a simple one-step high-energy ball milling process, which showed a reversible charge capacity value of 688 mA h g−1 at the 30th cycle with 99% coulombic efficiency. Later, W. Y. Yoon's group15 used a W coating to improve the conductivity of one-step ball-milled SiO–graphite composite, exhibiting better charge and discharge behavior under higher current. However, it was found that one-step ball milling for the mixture of SiO and graphite could create an electrochemical inactive phase of SiC,16 reducing the specific capacity of the composites. Therefore, it is a challenge to avoid the formation of SiC phase in the fabrication of SiO/C composites by HEBM process.
In this work, a simple two-step HEBM method was used to prepare Si/SiOx/C composites by using SiO and graphite powders as raw materials. The as-obtained Si/SiOx/C electrode exhibited a stable and high reversible capacity (726 mA h g−1 at a rate of 100 mA g−1 after 500 cycles) due to the uniform coating of graphite on the surface of Si/SiOx particles and avoiding the formation of inert component SiC by the two-step ball-milling process.
2. Experimental
2.1. Synthesis of Si/SiOx/C composites
The precursors used for this synthesis were SiO (Aladdin, −200 mesh) and commercial graphite (Aladdin, −200 mesh) powders. All chemical reagents were used directly without further purification. The Si/SiOx/C composites were prepared through the high-energy mechanical ball-milling (HEBM) method. Typically, 5 g SiO powder was placed in a 300 ml stainless steel vessel containing stainless steel balls by a planetary mill (QM-1 SP04, Nanjing University Instrument Plant, China) with a rotation speed of 400 rpm. Two kinds of the stainless steel ball with diameters of 6 and 10 mm was used, and the number ratio was 2![[thin space (1/6-em)]](https://www.rsc.org/images/entities/char_2009.gif) :
:![[thin space (1/6-em)]](https://www.rsc.org/images/entities/char_2009.gif) 1. The weight ratio of the stainless steel ball to the SiO powder was 30
1. The weight ratio of the stainless steel ball to the SiO powder was 30![[thin space (1/6-em)]](https://www.rsc.org/images/entities/char_2009.gif) :
:![[thin space (1/6-em)]](https://www.rsc.org/images/entities/char_2009.gif) 1, and the vessel was filled with argon gas. The SiO in the vessel were milled for different times (2, 6, 10 and 12 h) at 400 rpm. Then, the resultant Si/SiOx particles (∼4 g) were mixed with graphite powders at different weight ratio (5
1, and the vessel was filled with argon gas. The SiO in the vessel were milled for different times (2, 6, 10 and 12 h) at 400 rpm. Then, the resultant Si/SiOx particles (∼4 g) were mixed with graphite powders at different weight ratio (5![[thin space (1/6-em)]](https://www.rsc.org/images/entities/char_2009.gif) :
:![[thin space (1/6-em)]](https://www.rsc.org/images/entities/char_2009.gif) 1, 5
1, 5![[thin space (1/6-em)]](https://www.rsc.org/images/entities/char_2009.gif) :
:![[thin space (1/6-em)]](https://www.rsc.org/images/entities/char_2009.gif) 2 and 5
2 and 5![[thin space (1/6-em)]](https://www.rsc.org/images/entities/char_2009.gif) :
:![[thin space (1/6-em)]](https://www.rsc.org/images/entities/char_2009.gif) 3), and subjected to HEBM for 40 min under the same balling conditions, respectively, to obtain Si/SiOx/C composites. Correspondingly, the as-prepared Si/SiOx/C samples were denoted as Si/SiOx/C-1, Si/SiOx/C-2 and Si/SiOx/C-3, respectively. For comparison, Si/SiOx/C-3 composite was fabricated by using one-step balling–milling method under the same balling conditions for 10 h.
3), and subjected to HEBM for 40 min under the same balling conditions, respectively, to obtain Si/SiOx/C composites. Correspondingly, the as-prepared Si/SiOx/C samples were denoted as Si/SiOx/C-1, Si/SiOx/C-2 and Si/SiOx/C-3, respectively. For comparison, Si/SiOx/C-3 composite was fabricated by using one-step balling–milling method under the same balling conditions for 10 h.
2.2. Sample characterization
The morphologies and EDS mapping of the powder samples were analyzed by a field emission scanning electron microscope (FE-SEM, Supra55, Carl Zeiss) and a high resolution transmission electron microscope (HR-TEM, Tecnai G2 F30 S-TWIN). The phase structure of the samples was investigated by using a wide-angle X-ray diffractometer (XRD, WAXD, D8 Advance, Bruker, Cu Kα, λ = 0.154 nm) and a Raman spectrometer (Renishaw, INVIA). An X-ray photoelectron spectrometer (XPS, EscaLab 250, Thermo Fisher Scientific) was used to analyze the elemental chemical status of samples. Thermogravimetric analysis was carried out on a TGA instrument (TA-Q50, America) at a heating rate of 10 °C min−1 from 40 to 800 °C in air to measure the amounts of components.2.3. Electrochemical measurements
The Si/SiOx/C composite was mixed with carbon black and poly(vinylidene difluoride) (PVDF) to form a slurry at a weight ratio of 8![[thin space (1/6-em)]](https://www.rsc.org/images/entities/char_2009.gif) :
:![[thin space (1/6-em)]](https://www.rsc.org/images/entities/char_2009.gif) 1
1![[thin space (1/6-em)]](https://www.rsc.org/images/entities/char_2009.gif) :
:![[thin space (1/6-em)]](https://www.rsc.org/images/entities/char_2009.gif) 1 in N-methyl pyrrolidone (NMP). The working electrode was prepared by casting the slurry onto nickel foil through a doctor blade method, and then dried in a vacuum oven at 120 °C for 24 h. The cells were assembled in an Ar-filled glovebox by using a Li metal foil as the counter electrode and the Celgard 2300 membrane as a separator. The electrolyte was 1 M LiPF6 in ethylene carbonate (EC)/dimethyl carbonate (DMC) (1
1 in N-methyl pyrrolidone (NMP). The working electrode was prepared by casting the slurry onto nickel foil through a doctor blade method, and then dried in a vacuum oven at 120 °C for 24 h. The cells were assembled in an Ar-filled glovebox by using a Li metal foil as the counter electrode and the Celgard 2300 membrane as a separator. The electrolyte was 1 M LiPF6 in ethylene carbonate (EC)/dimethyl carbonate (DMC) (1![[thin space (1/6-em)]](https://www.rsc.org/images/entities/char_2009.gif) :
:![[thin space (1/6-em)]](https://www.rsc.org/images/entities/char_2009.gif) 1 v/v). After assembly, cyclic voltammetry (CV) measurements were performed between 0.005 and 3 V by using an Autolab PGSTAT 302 N (Metrohm) workstation with a scan rate of 0.1 mV s−1. The galvanostatic charge/discharge measurements were carried out between 0.005 and 3.0 V on a Land CT2001A (China). Electrochemical impedance spectroscopy (EIS) measurements were also carried out at the same electrochemical workstation with the amplitude of 10 mV and a frequency ranging from 10 kHz to 0.1 Hz. The mass loading of the active materials (∼1.0 mg cm−2), including both Si/SiOx and C, was taken into account when the capacities were calculated.
1 v/v). After assembly, cyclic voltammetry (CV) measurements were performed between 0.005 and 3 V by using an Autolab PGSTAT 302 N (Metrohm) workstation with a scan rate of 0.1 mV s−1. The galvanostatic charge/discharge measurements were carried out between 0.005 and 3.0 V on a Land CT2001A (China). Electrochemical impedance spectroscopy (EIS) measurements were also carried out at the same electrochemical workstation with the amplitude of 10 mV and a frequency ranging from 10 kHz to 0.1 Hz. The mass loading of the active materials (∼1.0 mg cm−2), including both Si/SiOx and C, was taken into account when the capacities were calculated.
3. Results and discussion
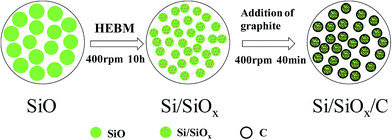
Fig. 1 illustrates the fabrication process of Si/SiOx/C composite. Firstly, the SiO powder was ball-milled and underwent a disproportionation reaction into micro–nano Si/SiOx particles,17–20 which possessed abundant electrochemical active sites for lithium storage. Then the second step ball-milling process was performed on the mixtures of the Si/SiOx particles and graphite with different weight ratios for a short time to produce Si/SiOx/C composites.Fig. 2(a) shows the XRD patterns for commercial Si, SiO and graphite(C) and the as-prepared Si/SiOx, and Si/SiOx/C-3 composites. For the commercial Si (Aladdin, 30 nm), the typical peaks at 28.3°, 47.2°, and 56.1° correspond to the (111), (220), (331) lattice orientations of Si. Comparing to the XRD pattern for the SiO sample, a slight increase of the Si peak (28.3°) height and a slight decrease of the SiO2 peak (22° and 26.4°) height were detected in the XRD pattern of the as-prepared Si/SiOx sample, indicating the slight effect of HEBM process on the phase structure of SiO. For the Si/SiOx/C-3 composite, a slight increase was seen in the C peak (26.4°), which overlapped with the peak (26.4°) of SiO2 in the pattern of Si/SiOx sample. The peak at 43.4° and 44.5° corresponds to the Fe2Si (PDF#83-1259), which is the possible production of the Si and the stainless steel ball during HEBM. As shown in Fig. 2(b), the Si/SiOx/C-3 sample fabricated by the one-step ball-milling method showed the typical peak of SiC phase at 35.6°, however, which didn't appear in the XRD pattern of the Si/SiOx/C-3 sample obtained by two-step ball-milling method. In order to further clarify the presence of SiC phase, the XRD patterns of pure SiC and Si/SiOx/C-3 composite fabricated by one-step ball milling were conducted as shown in Fig. S2.† We can observed the typical peak at 35.6° corresponding to the pure SiC that clearly show the presence of SiC. The absence of the SiC phase in the two-step ball-milling synthesized Si/SiOx/C-3 sample is favor for enhancing the electrochemical performance of Si/SiOx/C electrode.
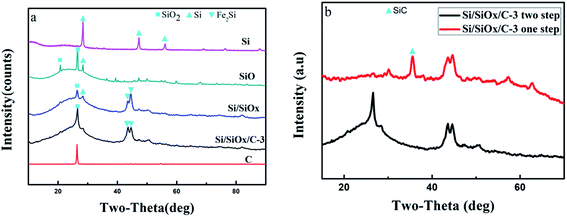 | ||
| Fig. 2 XRD patterns of (a) Si, SiO, Si/SiOx (HEBM 10 h), graphite(C), and Si/SiOx/C-3 composite and (b) Si/SiOx/C-3 composite fabricated by one-step ball-milling and two-step ball-milling. | ||
The surface morphologies and microstructures of Si/SiOx and Si/SiOx/C samples were investigated by using SEM and HRTEM. As shown in Fig. 3(a) and (b), the Si/SiOx (10 h) and Si/SiOx/C-3 composite showed similar particle morphologies. Fig. 3(c)–(f) show the corresponding EDS mapping for Si, O and C of the Si/SiOx/C composites, which reveals a homogeneous distribution of Si, O and C in the composite. In the Si/SiOx/C-3 composite, graphitic carbon with a weight percent of ∼25 wt% (Fig. S1†) provided a good electrical conductivity and an effective buffering matrix that improve the cycle performance. As shown in Fig. 3(g), some nanosized crystallites with size ranging from 3 to 10 nm were finely dispersed within the crystallized graphite phase and homogeneously encapsulated by it. In Fig. 3(h), the lattice fringes show an interplanar spacing of about 0.312 nm, which corresponds to Si (111) planes.21,22 In Fig. 3(i), the lattice fringes show an interplanar spacing of 0.212 nm, corresponding to SiO2 (311) planes.23,24 The most of lattice fringes in Fig. 3(i) except the marked SiO2 (311) planes, which are corresponded to the crystallized graphite. The detailed valence distribution of silicon elements can be obtained from XPS analysis.
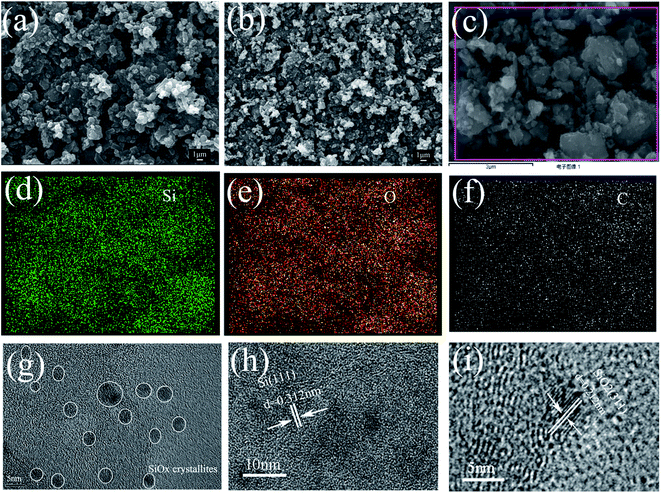 | ||
| Fig. 3 SEM images of the ball-milled (a) Si/SiOx 10 h, (b) Si/SiOx/C-3, (c)–(f) corresponding EDS mapping images of silicon, oxygen and carbon. (g–i) HRTEM images of Si/SiOx/C-3 composite. | ||
The XPS spectra of the Si/SiOx/C-3 composites are shown in Fig. 4. The full spectra of Si/SiOx/C-3 in Fig. 4(a) further confirm the presence of O, C, and Si elements. Fig. 4(b) shows the high-resolution XPS spectra of Si 2p, which can be fitted into five peaks, corresponding to five different Si oxidation states: Si0(98.7 eV), Si+(101.1 eV), Si2+(102.2 eV), Si3+(103.5 eV) and Si4+(104.6 eV).25,26 The XPS results of Si 2p confirms the presence of Si and SiOx in the Si/SiOx/C composite. Three peaks at 284.6 eV, 285.9 eV and 288.3 eV were founded in Fig. 4(c) by fitting the C 1s spectrum, which may be assigned to C–C bonds in the free carbon matrix, C–O bonds and C![[double bond, length as m-dash]](https://www.rsc.org/images/entities/char_e001.gif) O bonds, respectively. No peaks at less than 284.6 eV were observed, suggesting that the absence of C–Si bonds.27 Fig. 4(d) presents the Raman spectrum of Si/SiOx/C-3 sample. It displays a broad peak at around 491 cm−1, which is ascribed to the Si/SiOx nanoparticles, in which nanosilicon uniformly exists in SiOx particles.28,29 What is more, the two characteristic Raman peaks at 1348 cm−1 and 1576 cm−1 are observed, which are the D-band for the disordered mode and the G-band for the stretching mode of C–C bonds of graphite.30,31 Generally, the intensity ratio of D band to G band (ID/IG) is used to estimate the degree of disorder in graphite.32 The ID/IG ratio for the Si/SiOx/C-3 sample is 0.855, suggesting that the graphite in the sample has high graphitization degree, which is favor for improving the electrochemical performance of Si/SiOx/C composites.
O bonds, respectively. No peaks at less than 284.6 eV were observed, suggesting that the absence of C–Si bonds.27 Fig. 4(d) presents the Raman spectrum of Si/SiOx/C-3 sample. It displays a broad peak at around 491 cm−1, which is ascribed to the Si/SiOx nanoparticles, in which nanosilicon uniformly exists in SiOx particles.28,29 What is more, the two characteristic Raman peaks at 1348 cm−1 and 1576 cm−1 are observed, which are the D-band for the disordered mode and the G-band for the stretching mode of C–C bonds of graphite.30,31 Generally, the intensity ratio of D band to G band (ID/IG) is used to estimate the degree of disorder in graphite.32 The ID/IG ratio for the Si/SiOx/C-3 sample is 0.855, suggesting that the graphite in the sample has high graphitization degree, which is favor for improving the electrochemical performance of Si/SiOx/C composites.
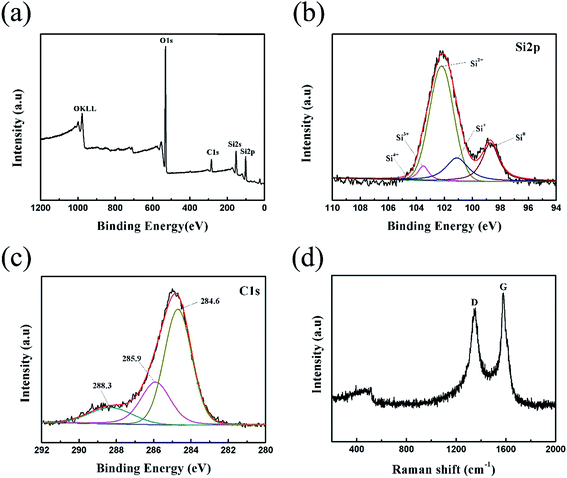 | ||
| Fig. 4 XPS spectra (a) full spectra, (b) Si 2p spectra, (c) C 1s spectra and (d) Raman spectra of Si/SiOx/C-3 composite. | ||
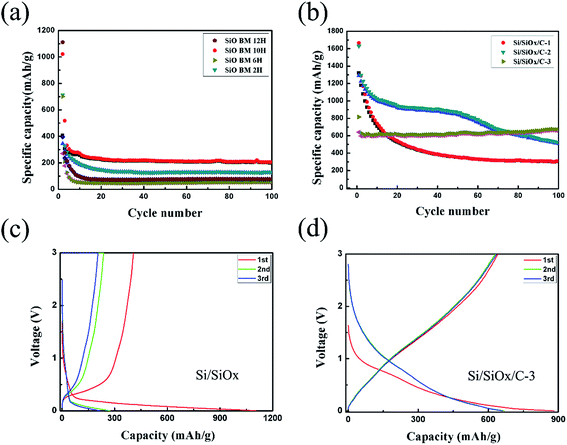
In order to get an optimal ball-milling time, the electrochemical properties of a series of Si/SiOx samples ball-milled for different times (up to 12 h) were investigated as anode materials for LIBs. As shown in Fig. 5(a), the specific capacities of the Si/SiOx series were declined quickly in the first few cycles. Among them, the Si/SiOx sample ball-milled for 10 h showed a little bit better performance than the other samples, so it was chosen as the raw material in the subsequent fabrication of Si/SiOx/C composites. Fig. 5(b) shows the cycling stability at room temperature of the Si/SiOx/C series with different weight ratios of Si/SiOx (10 h) to graphite (5![[thin space (1/6-em)]](https://www.rsc.org/images/entities/char_2009.gif) :
:![[thin space (1/6-em)]](https://www.rsc.org/images/entities/char_2009.gif) 1, 5
1, 5![[thin space (1/6-em)]](https://www.rsc.org/images/entities/char_2009.gif) :
:![[thin space (1/6-em)]](https://www.rsc.org/images/entities/char_2009.gif) 2 and 5
2 and 5![[thin space (1/6-em)]](https://www.rsc.org/images/entities/char_2009.gif) :
:![[thin space (1/6-em)]](https://www.rsc.org/images/entities/char_2009.gif) 3), corresponding to the graphite contents in the samples are about 10, 15 and 25%, respectively, as shown in Fig. S1.† Clearly, the Si/SiOx/C series presented far better cycle performance than the Si/SiOx (10 h). Moreover, the cycling performance of Si/SiOx/C was improved along with the increase of graphite content. However, the first charge capacities and discharge capacities decreased as increasing graphite content. The reason is that the content of active mass of Si/SiOx is least in the Si/SiOx/C-3, which cause the lower initial capacity. However, the carbon cannot completely relieve the volume expansion of Si/SiOx in Si/SiOx/C-1 and Si/SiOx/C-2, which cause the worse cycling performance. Finally, considering the comprehensive performance in terms of good cycling stability, high capacity and initial coulombic efficiency, the Si/SiOx/C-3 composite was considered the optimal sample for further investigation in this work.
3), corresponding to the graphite contents in the samples are about 10, 15 and 25%, respectively, as shown in Fig. S1.† Clearly, the Si/SiOx/C series presented far better cycle performance than the Si/SiOx (10 h). Moreover, the cycling performance of Si/SiOx/C was improved along with the increase of graphite content. However, the first charge capacities and discharge capacities decreased as increasing graphite content. The reason is that the content of active mass of Si/SiOx is least in the Si/SiOx/C-3, which cause the lower initial capacity. However, the carbon cannot completely relieve the volume expansion of Si/SiOx in Si/SiOx/C-1 and Si/SiOx/C-2, which cause the worse cycling performance. Finally, considering the comprehensive performance in terms of good cycling stability, high capacity and initial coulombic efficiency, the Si/SiOx/C-3 composite was considered the optimal sample for further investigation in this work.
In Fig. 5(c), the Si/SiOx (10 h) electrode delivered the first charge and discharge capacities of 1021.4 and 406.7 mA h g−1 with an initial coulombic efficiency of about 39.8%, showing no commercial value. The Si/SiOx electrode exhibited a similar potential profile to those of reported SiO and SiOx electrodes in the first lithium insertion and extraction.33,34 Generally, the high irreversible capacity could be explained by the formation of nanosilicon and Li2O. Then, the nanosilicon reacts with Li to form Li–Si alloy.35 An obvious difference exists between the first discharge voltage profile and the subsequent ones. As shown in Fig. 5(d), the Si/SiOx/C-3 electrode exhibited the first discharge capacity of 881.4 mA h g−1 and a charge capacity of 649 mA h g−1, with an initial coulombic efficiency of about 73.6%, which improved a lot compared to the Si/SiOx electrode (39.8%). In the second cycle, the coulombic efficiency increased to 94.3%. The first cycle seemed different from the others due to the formation of SEI film. In the subsequent lithiation process, a negative potential overshoot is observed due to the nucleation of new phases such as Li2O and lithium silicates.36 The carbon layer effectively prevents the electrode crushing caused by volume expansion of Si/SiOx. If the electrode crushed, Si/SiOx electrode will continue to contact with the electrolyte and form the SEI film repeatedly. Therefore, the carbon layer contributes to form a stable SEI film. Comparing with the charge and discharge voltage profiles of Si/SiOx/C-1 and Si/SiOx/C-2 in Fig. S4,† we find the redox potential of Si/SiOx/C is similar, which could not consider corresponding to the redox potential of neither Si nor graphite. The unexpected performance may be ascribed to the complexity and synergistic effect of the ball-milled nanocomposites.
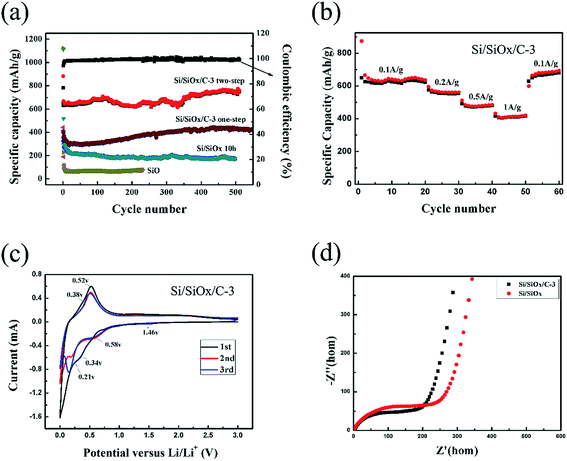
The two-step ball-milling fabricated Si/SiOx/C-3 electrode displayed stable cycle performance and maintained a reversible charge capacity and discharge capacity of 732 and 726 mA h g−1 after 500 cycles at a current density of 0.1 A g−1, as shown in Fig. 6(a). The first charge/discharge capacity of Si/SiOx/C-3 (one-step) electrode were about 408.8 and 325 mA h g−1, significantly lower than those of the Si/SiOx/C-3 (two-step) electrode (881.4 and 649 mA h g−1). This can be explained by the fact that the inert SiC phase is formed in the one-step ball milling process, which reduces the capacity of Si/SiOx/C-3 electrode. Compared to SiO and Si/SiOx electrodes, the two-step ball-milling fabricated Si/SiOx/C-3 electrode shows excellent long-term cycle performance. The capacity decay of Si/SiOx/C composite is almost negligible, indicating its good cycle stability. Fig. 6(b) presented the charge and discharge capacity at different current densities of 0.1, 0.2, 0.5, 1 and 0.1 A g−1 and the corresponding reversible capacity was 650.9, 561.6, 483.3, 412.4 and 693.8 mA h g−1, respectively. When the current density gradually increased from 0.1 to 1 A g−1, the electrode presented a stable discharge capacity at each current density. When the current density was switched back to 0.1 A g−1, the capacity can be recovered almost completely to the original value, indicating the stable structure of the electrode. Fig. 6(c) shows the cyclic voltammetry curves of the Si/SiOx/C composite electrodes at a scanning rate of 0.1 mV s−1 between 0 and 3 V for the first three cycles. In the first cycle, there are two reduction peaks at about 1.46 and 0.34 V, both of which disappear from the second cycle. The peak at 1.46 V is associated with the electrolyte decomposition and the formation of the solid electrolyte interface (SEI) layer.37 The broad peak at 0.34 V corresponds to the reduction reactions of SiOx, while the broad anodic peaks at 0.38 and 0.52 V correspond to the dealloying process of LixSi and a part of Li2Si2O5,38,39 attributing to the delithiation of LixSi back to amorphous Si.40 In the subsequent cycles, a new cathodic peak appears at about 0.21 V and becomes more intense with the activation of the electrode in third cycle, corresponding to the lithiation of amorphous silicon.23 The electrochemical impedance spectroscopy (EIS) technique was also utilized to clarify the electrochemical performance of the Si/SiOx/C composites compared with Si/SiOx materials. The horizontal axis of EIS spectra represents the high to low frequency range. As shown in Fig. 6(d), the first semicircle at the high-to-medium frequency range corresponds to the impedance of the SEI film (Ω1); the second semicircle at the medium-to-low frequency range corresponds to the impedance of the Li-ion transfer across the interface between the SEI film and the electrode (Ω2); and the inclined line at the low frequency range is ascribed to the impedance of Li-ion diffusion in the bulk electrode (Ω3).41,42 With the Si/SiOx/C-3 composite, both Ω1 and Ω2 have been reduced, suggesting that Si/SiOx/C-3 composite can facilitate the formation of a stable, dense SEI film43,44 and improve Li-ion transfer rate.45,46
Fig. 7 summarizes the contribution of each component in the Si/SiOx/C-3 sample. According to the TG analysis (Fig. S1†), the weight content of carbon in Si/SiOx/C-3 composite is about 25%. Calculating the capacity of Si/SiOx/C-3 composite according to the formula (Si/SiOx effect × 75% + C effect × 25%). The capacity of C, which is evaluated as the same condition by ball-milling 40 min as shown in Fig. S3.† It displayed a reversible charge capacity and discharge capacity of 135.4 and 135.2 mA h g−1 after 500 cycles at a current density of 0.1 A g−1. Compared with the calculated specific capacity (1st, 840 mA h g−1; 500th, 162 mA h g−1), the Si/SiOx/C-3 electrode exhibits higher specific capacity (1st, 881 mA h g−1; 500th, 726 mA h g−1), indicating a great synergistic effect between Si/SiOx and graphite carbon. The presence of graphite carbon stabilizes the Si/SiOx particles during cycling process to accommodate more lithium ions and keeps the active materials electrically interconnected.47 Therefore, the Si/SiOx/C electrode exhibits significantly enhanced capacity and cyclability. Nearly 70% capacity of Si/SiOx/C-3 after 500 cycles is ascribed to the synergistic effect. Further, it can be seen from Table 1 that the Si/SiOx/C-3 electrode showed the cycle performance better than many other reported SiOx-based electrodes.
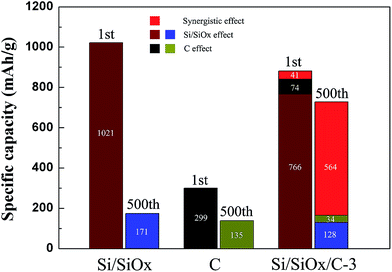 | ||
| Fig. 7 The 1st and 500th reversible charge specific capacities of Si/SiOx, C and Si/SiOx/C-3 electrode, and the calculated specific capacity based on experimental values. | ||
| Structure | Charge capacity (mAh g−1) | Current density (mA g−1) | Cycle number | Coulombic efficiency first time (%) | Ref. |
|---|---|---|---|---|---|
| SiO/C | 688 | 100 | 30 | 44.5 | 14 |
| SiO/CNFs | 700 | 100 | 200 | 35.7 | 11 |
| Nano-sized SiOx | 660 | 100 | 50 | 44 | 48 |
| SiOx–C | 674.8 | 100 | 100 | 77 | 49 |
| SiOx@C nanorods | 720 | 100 | 350 | 69 | 22 |
| Si–NiSi2–Al2O3@C | 580 | 100 | 200 | 76.8 | 21 |
| This work | 726 | 100 | 500 | 73.6 |
Fig. 8 shows the morphological and structural change of the Si/SiOx/C-3 electrode before and after cycling. As shown in Fig. 8(b), the SEI layer was observed on the electrode surface after 500 cycles, and no cracking or pulverization of the electrode caused by the volume change was observed, suggesting that the structural integrity of the Si/SiOx/C-3 electrode was maintained well during cycling. Therefore, the Si/SiOx/C-3 electrode showed a long-term cycle performance.
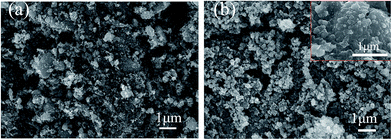 | ||
| Fig. 8 SEM images of the Si/SiOx/C-3 composites electrode (a) before cycling and (b) after 500 cycles. | ||
4. Conclusions
In summary, Si/SiOx/C composites were fabricated by using a simple and cost-effective two-step ball-milling process with the commercial SiO and graphite carbon as raw materials. Comparison with the one-step ball-milling process of SiO/C, the two-step ball-milling process can avoid the generation of inert SiC phase in the fabrication of Si/SiOx/C electrodes, providing more electrochemical active sites. Meanwhile, graphitic carbon coated on the surface of Si/SiOx uniformly and relieved its volume expansion. Owing to the synergistic effect of Si/SiOx and graphite carbon, the typical Si/SiOx/C composite used as an anode for LIBs shows high specific capacity, excellent long-term cycle performance, giving a superior reversible capacity of 726 mA h g−1 at a rate of 0.1 A g−1 after 500 cycles. The two-step ball-milling preparation of Si/SiOx/C composite provides a facile approach for fabricate high-performance silicon-based anode materials.Acknowledgements
This work was financially supported by National Natural Science Foundation of China (No. 51272021, 51142004 and 51402010) and Natural Science Foundation of Jiangsu Province (BK20140270).References
- J. Maier, Nat. Mater., 2005, 4, 805–815 CrossRef CAS PubMed.
- M. Armand and J. Tarascon, Nature, 2008, 451, 652–657 CrossRef CAS PubMed.
- A. S. Arico, P. Bruce, B. Scrosati, J. M. Tarascon and W. V. Schalkwijk, Nat. Mater., 2005, 4, 366–377 CrossRef CAS PubMed.
- N. A. Kaskhedikar and J. Maier, Adv. Mater., 2009, 21, 2664–2680 CrossRef CAS.
- H. C. Shin, J. A. Corno, J. L. Gole and M. Liu, J. Power Sources, 2005, 139, 314–320 CrossRef CAS.
- J. Yin, M. Wada, K. Yamamoto, Y. Kitano, S. Tanase and T. Sakai, J. Electrochem. Soc., 2006, 153, A472–A477 CrossRef CAS.
- N. Liu, H. Wu, M. T. McDowell, Y. Yao, C. Wang and Y. Cui, Nano Lett., 2012, 12, 3315–3321 CrossRef CAS PubMed.
- H. Wu, G. Zheng, N. Liu, T. J. Carney, Y. Yang and Y. Cui, Nano Lett., 2012, 12, 904–909 CrossRef CAS PubMed.
- M. Sangare, G. J. Fodjouong and X. Huang, Mendeleev Commun., 2013, 23, 284–285 CrossRef CAS.
- J. H. Kim, C. M. Park, H. Kim, Y. J. Kim and H. J. Sohn, J. Electroanal. Chem., 2011, 661, 245–249 CrossRef CAS.
- Q. Si, K. Hanai, T. Ichikawa, M. B. Phillipps, A. Hirano, N. Imanishi, O. Yamamoto and Y. Takeda, J. Power Sources, 2011, 196, 9774–9779 CrossRef CAS.
- W. Wu, Y. Liang, H. Ma, Y. Peng and H. Yang, Electrochim. Acta, 2016, 187, 473–479 CrossRef CAS.
- J. H. Kim, H. J. Sohn, H. Kim, G. Jeong and W. Choi, J. Power Sources, 2007, 170, 456–459 CrossRef CAS.
- C. H. Doh, C. W. Park, H. M. Shin, D. H. Kim, Y. D. Chung, S. I. Moon, B. S. Jin, H. S. Kim and A. Veluchamy, J. Power Sources, 2008, 179, 367–370 CrossRef CAS.
- J. H. Yom, J. K. Lee and W. Y. Yoon, J. Appl. Electrochem., 2015, 45, 397–403 CrossRef CAS.
- M. K. Datta and P. N. Kumta, J. Power Sources, 2007, 165, 368–378 CrossRef CAS.
- J. Wang, M. J. Zhou, G. Q. Tan, S. Chen, F. Wu, J. Lu and K. Aminec, Nanoscale, 2015, 7, 8023–8034 RSC.
- X. Y. Wang, Z. Y. Wen, Y. Liu, Y. Huang and T. L. Wen, Solid State Ionics, 2011, 192, 330–334 CrossRef CAS.
- X. J. Feng, J. Yang, Q. W. Lu, J. L. Wang and Y. Nuli, Phys. Chem. Chem. Phys., 2013, 15, 14420–14426 RSC.
- B. C. Yu, Y. Hwa, J. H. Kim and H. J. Sohn, Electrochim. Acta, 2014, 117, 426–430 CrossRef CAS.
- L. Yang, H. Li, J. Liu, Z. Sun, S. Tang and M. Lei, Sci. Rep., 2015, 5, 10908–10916 CrossRef CAS PubMed.
- S. O. Kim and A. Manthiram, J. Mater. Chem. A, 2015, 3, 2399–2406 CAS.
- Y. Ren and M. Li, J. Power Sources, 2016, 306, 459–466 CrossRef CAS.
- M. Li, Y. Zeng, Y. Ren, C. Zeng, J. Gu, X. Feng and H. He, J. Power Sources, 2015, 288, 53–61 CrossRef CAS.
- G. Hollinger and F. J. Himpsel, Appl. Phys. Lett., 1984, 44, 93–95 CrossRef CAS.
- T. Yasaka, S. Uenaga, H. Yasutake, M. Takakura, S. Miyazaki and M. Hirose, Mater. Res. Soc. Symp. Proc., 1992, 259, 385–390 CrossRef CAS.
- X. Liu, K. Xie, C. Zheng, J. Wang and Z. Jing, J. Power Sources, 2012, 214, 119–123 CrossRef CAS.
- L. Khriachtchev, S. Novikov and O. Kilpela, J. Appl. Phys., 2000, 87, 7805–7813 CrossRef CAS.
- D. Nesheva, C. Raptis, A. Perakis, I. Bineva, Z. Aneva, Z. Levi, S. Alexandrova and H. Hofmeister, J. Appl. Phys., 2002, 92, 4678–4683 CrossRef CAS.
- F. Han, Y. Bai, R. Liu, B. Yao, Y. Qi, N. Lun and J. Zhang, Adv. Energy Mater., 2011, 1, 798–801 CrossRef CAS.
- L. Qie, W. Chen, Z. Wang, Q. Shao, X. Li, L. Yuan, X. Hu, W. Zhang and Y. Huang, Adv. Mater., 2012, 24, 2047–2050 CrossRef PubMed.
- B. Guo, Q. Liu, E. Chen, H. Zhu, L. Fang and J. Gong, Nano Lett., 2010, 10, 4975–4980 CrossRef CAS PubMed.
- J. Yang, Y. Takeda, N. Imanishi, C. Capiglia, J. Xie and O. Yamamoto, Solid State Ionics, 2002, 152–153, 125–129 CrossRef CAS.
- M. Miyachi, H. Yamamoto and H. Kawai, J. Electrochem. Soc., 2007, 154, A370–A380 CrossRef.
- H. Y. Lee and S. M. Lee, Electrochem. Commun., 2004, 6, 465–469 CrossRef CAS.
- H. Nara, T. Yokoshima, T. Momma and T. Osaka, Energy Environ. Sci., 2012, 5, 6500–6505 CAS.
- M. Li, Y. Yu, J. Li, B. Chen, X. Wu, Y. Tian and P. Chen, J. Mater. Chem. A, 2015, 3, 1476–1482 CAS.
- Y. Yao, J. Zhang, L. Xue, T. Huang and A. Yu, J. Power Sources, 2011, 196, 10240–10243 CrossRef CAS.
- H. Tao, X. Yang, L. Zhang and S. Ni, Mater. Chem. Phys., 2014, 147, 528–534 CrossRef CAS.
- J. Lia and J. R. Dahn, J. Electrochem. Soc., 2007, 154, A156–A161 CrossRef.
- J. S. Gnanaraj, M. D. Levi, E. Levi, G. Salitra, D. Aurbach, J. E. Fischer and A. Claye, J. Electrochem. Soc., 2001, 148, A525–A536 CrossRef CAS.
- X. Chen, X. Li, F. Ding, W. Xu, J. Xiao, Y. Cao, P. Meduri, J. Liu, G. L. Graff and J. G. Zhang, Nano Lett., 2012, 12, 4124–4130 CrossRef CAS PubMed.
- H. Wu, G. Chan, J. W. Choi, I. Ryu, Y. Yao, M. T. McDowell, S. W. Lee, A. Jackson, Y. Yang, L. Hu and Y. Cui, Nat. Nanotechnol., 2012, 7, 310–315 CrossRef CAS PubMed.
- J. Guo, X. Chen and C. Wang, J. Mater. Chem., 2010, 20, 5035–5040 RSC.
- J. Wang, H. Zhao, J. He, C. Wang and J. Wang, J. Power Sources, 2011, 196, 4811–4815 CrossRef CAS.
- A. Veluchamy, C. H. Doh, D. H. Kim, J. H. Lee, D. J. Lee, K. H. Ha, H. M. Shin, B. S. Jin, H. S. Kim, S. I. Moon and C. W. Park, J. Power Sources, 2009, 188, 574–577 CrossRef CAS.
- C. Gui, S. Hao, Y. Liu, J. Qu, C. Yang, Y. Yu, Q. Wang and Z. Yu, J. Mater. Chem. A, 2015, 3, 16551–16559 CAS.
- M. K. Kim, B. Y. Jang, J. S. Lee, J. S. Kim and S. Nahm, J. Power Sources, 2013, 244, 115–121 CrossRef CAS.
- W. Wu, J. Shi, Y. Liang, F. Liu, Y. Peng and H. Yang, Phys. Chem. Chem. Phys., 2015, 17, 13451–13456 RSC.
Footnote |
| † Electronic supplementary information (ESI) available. See DOI: 10.1039/c7ra06671f |
| This journal is © The Royal Society of Chemistry 2017 |

