 Open Access Article
On the corrosion inhibition of carbon steel in 1 M HCl with a pyridinium-ionic liquid: chemical, thermodynamic, kinetic and electrochemical studies
Sami Ben Aoun *
*
Department of Chemistry, Faculty of Science, Taibah University, PO. Box 30002, Al Madinah Al Munawarah, Kingdom of Saudi Arabia. E-mail: sbenaoun@taibahu.edu.sa; Fax: +966 148618888 ext. 4326; Tel: +966 590900727
First published on 25th July 2017
Abstract
The efficiency of 1-hexylpyridinium bromide (NR3) ionic liquid for the corrosion inhibition of carbon steel in 1 M hydrochloric acid has been investigated by gravimetric, linear polarization (LPR), electrochemical impedance spectroscopy (EIS) and scanning electron microscopy (SEM) techniques. Increasing NR3 concentration led to increasing inhibition efficiency (IE%) following the increasing surface coverage (θ). Thermodynamic studies revealed a decreasing IE% with increasing temperature proven to be due to the physical nature of the adsorption mechanism of NR3 which was shown to obey a Langmuir isotherm. LPR elucidated the mixed type inhibition effect of NR3 and its effective blocking of both cathodic and anodic corrosion sites on the carbon steel surface leading to decreased current densities of both Tafel branches without altering the corrosion mechanism. EIS results confirmed the adsorptive behavior of the investigated ionic liquid in replacement of the initially adsorbed water molecules and the formation of a protective film leading to increasing charge-transfer resistance as a result of decreasing double layer capacitance with increasing concentrations. The IE% attained ca. 88.6% in the presence of as low as 3 × 10⁻³ M NR3 inferring the high inhibitory effect of the studied compound. SEM micrographs confirmed the formation and growth of a protective layer reaching a dense coverage at the optimum concentration.
1. Introduction
Mineral acids are widely used, among others, in oil well acidizing, acid pickling and acid descaling.1–4 This results in the chemical attack of less noble metals, for instance steel, which leads to its corrosion occurring generally via electrochemical anodic dissolution5 and causes several economical and safety problems.6–8 The use of corrosion inhibitors, mainly organic compounds, was revealed to be one of the most effective methods for corrosion control and, hopefully, its prevention.9–16 Higher inhibition efficiencies are generally achieved with compounds comprising in their molecular structures P, O, S, N, π-electrons and aromatic rings.17–31 The inhibitive activity of such compounds lies in their ability to reduce the corrosion rates via strong adsorption on the corroding metal surface.21,32–34 Nevertheless, health hazards and environmental issues are the major drawbacks of several corrosion inhibitors which justify the tremendous efforts deployed to substitute them with more eco-friendly compounds.31,35 In this respect, ionic liquids emerged in recent decade as a new class of green corrosion inhibitors.30,32,33,36–42The present paper investigates the inhibitory effect of 1-hexylpyridinium bromide (NR3) ionic liquid on the carbon steel corrosions in aggressive hydrochloric acid solution using both chemical (i.e. gravimetric) and electrochemical (linear polarization and electrochemical impedance spectroscopy) techniques. Complementarity and correlations of these techniques will be highlighted and details about the thermodynamics and kinetics of the inhibition process will be elucidated. The morphology of the corroding metal will be monitored, both in the absence and presence of inhibitor, with the aid of scanning electron microscopy.
2. Experimental
2.1. Chemicals and materials
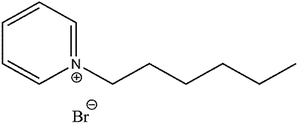
The structure of the investigated ionic liquid is shown in Scheme 1. For convenience, this compound will be denoted as (NR3) in the rest of the text. Acetone (99.5%) and hydrochloric acid (37%) were purchased from Panreac along with ethanol (99.8%, Sigma-Aldrich) and were used as described subsequently. All solutions were prepared in distilled water. 0.5 mm thick carbon-steel sheets were cut into various sizes in order to prepare the specimens for subsequent experiments.2.2. Weight loss measurements
Precisely weighted carbon steel samples (GR-202 analytical balance, A&D Co., Ltd., Japan) were first mechanically polished then cleaned with copious amounts of distilled water, acetone and ethanol. The as-prepared specimen was then immersed for 5 hours in corrosive media (15 cm2 exposed surface area) either in the absence or presence of various inhibitor concentrations (i.e. 10−5 to 3 × 10⁻³ M). In all experiments, the corrosive media volume was kept constant (i.e. 50 mL).Unless otherwise specified, the working temperature was ca. 294 ± 1 K.
2.3. Thermodynamics study
The temperature effect was investigated in the temperature range 294–343 K and the thermostatic conditions were ensured by means of a digitally-controlled water bath (Yudian Automation Technology, Hong Kong, Co., Ltd.).2.4. Electrochemical measurements
A conventional four-electrode corrosion cell (500 mL), comprising two platinum sheets counter electrodes, a saturated calomel reference electrode (SCE) jacked in a Luggin capillary and the as-prepared carbon steel specimen working electrode (1 cm2 cut), was employed in all electrochemical measurements. The experiments were carried out using an Autolab PGSTAT 128N instrument equipped with an FRA32M frequency response analyzer module (Metrohm Autolab B.V, The Netherlands). Data acquisition and analysis were done with NOVA 2.1 software.In linear polarization (LPR) experiments, a 1 mV step potential was imposed while the potential was scanned vs. corrosion potential (Ecorr) in the interval −100 mV to 100 mV at 1 mV s−1 scan rate. While for the electrochemical impedance spectroscopy (EIS) measurements, a perturbation wave of single sine and an amplitude of 10 mV was applied with a 0.125 s integration time and the frequency was scanned in the range 100 kHz to 50 mHz at the open circuit potential (OCP).
Prior to each experiment, a 30 min pre-conditioning of the working electrode was enough to reach a steady value of OCP.
2.5. Surface characterization
The morphology of the corroding carbon steel surface before and after corrosion tests either in the presence or absence of NR3 was characterized by scanning electron microscopy (SEM) with a JCM-6000 instrument (JEOL, Japan) operating under high vacuum and with 15 kV acceleration voltage.3. Results and discussion
3.1. Gravimetric study
The results of corrosion tests in 1 M HCl at 294 K for the corrosion of carbon steel in presence of various concentrations of (NR3) are displayed in Table 1. The following equations33 were used to calculate the corrosion rate (CR), the inhibition efficiencies (IE%) and the surface coverage (θ) of Table 1:
 | (1) |
 | (2) |
 | (3) |
| [NR3] (mol L−1) | 0 | 10−5 | 10−4 | 10−3 | 3 × 10⁻³ |
| CR (mg cm−2 h−1) | (205 ± 4) × 10−3 | (145 ± 6) × 10−3 | (99 ± 1) × 10−3 | (53 ± 5) × 10−3 | (36 ± 3) × 10−3 |
| IE% | — | 29.4 ± 3.2 | 51.5 ± 1.0 | 74.0 ± 2.6 | 82.4 ± 1.3 |
| θ | — | (294 ± 32) × 10−3 | (515 ± 10) × 10−3 | (740 ± 26) × 10−3 | (824 ± 13) × 10−3 |
| log[NR3] | — | −5.00 | −4.00 | −3.00 | −2.52 |
log![[thin space (1/6-em)]](https://www.rsc.org/images/entities/char_2009.gif) CR CR |
−0.688 | −0.840 | −1.003 | −1.273 | −1.444 |
| n | −0.243 | ||||
| k (mg cm−2 h−1)1/n | 9.528 × 10⁻³ | ||||
As clearly shown, the corrosion rate decreases with increasing concentrations of NR3 leading to a pronounced inhibition efficiency increase and that is graphically presented in Fig. 1, reaching 82.4% with the addition of just 3 mM NR3 to the aggressively corrosive molar hydrochloric acid. Such behavior is indicative of the high inhibitive activity of the investigated ionic liquid which might be explained by the diminishing of the exposed metal surface to corrosive solution as a consequence of increasing number of adsorbed NR3 molecules in replacement of water molecules leading to a higher surface coverage,33 shown here as an increase of θ values (cf. Table 1) and hindering the metal dissolution process.43–45
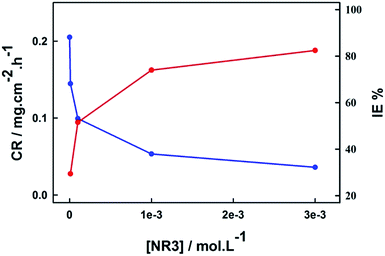 | ||
| Fig. 1 Effect of NR3 concentration on carbon steel corrosion rate (blue) and inhibition efficiency (red) in 1 M HCl at 294 K. | ||
3.2. Thermodynamics and kinetics
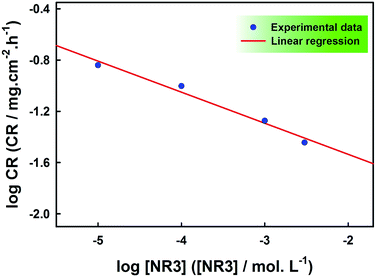
The kinetics of carbon steel corrosion in the presence of various concentrations of NR3 compound can be examined based on the following equation:46| CR = k[NR3]n | (4) |
![[thin space (1/6-em)]](https://www.rsc.org/images/entities/char_2009.gif) CR vs. log[NR3] as displayed in Fig. 2.
CR vs. log[NR3] as displayed in Fig. 2.
The good linearity of Fig. 2 (R2 = 0.978) is a proof that the corrosion rate in the current study obeys eqn (4) and the values of constants n and k can be respectively calculated from the slope and the y-intercept and the values are included with the experimental data points given in Table 1.
The inverse proportionality of the corrosion rate and NR3 concentration is revealed by the negative sign of (n) and its value infers the good inhibition efficiency of the investigated ionic liquid.32,33
Furthermore, the temperature effect on corrosion rate was studied in the temperature range (294–343 K) both in the absence and presence of optimum NR3 concentration (i.e. 3 × 10⁻³ M) and results are displayed in Fig. 3 and the extracted data is summarized in the following Table 2.
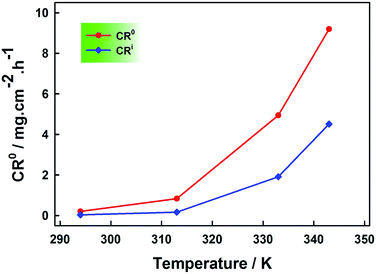 | ||
| Fig. 3 Temperature effect on the carbon steel corrosion rate in presence (CRi) and the absence (CR0) of 3 × 10⁻³ M NR3 in 1 M HCl. | ||
| T (K) | CR0 (mg cm−2 h−1) | CRi (mg cm−2 h−1) | IE% | θ |
|---|---|---|---|---|
| 294 | (205 ± 4) × 10−3 | (36 ± 3) × 10−3 | 82.4 ± 1.3 | (824 ± 13) × 10−3 |
| 313 | (835 ± 36) × 10−3 | (169 ± 10) × 10−3 | 79.8 ± 1.5 | (798 ± 15) × 10−3 |
| 333 | (4946 ± 38) × 10−3 | (1912 ± 72) × 10−3 | 61.3 ± 1.5 | (613 ± 15) × 10−3 |
| 343 | (9194 ± 25) × 10−3 | (4515 ± 275) × 10−3 | 50.9 ± 3.0 | (509 ± 30) × 10−3 |
As expected, both cases exhibited an increasing corrosion rate with increasing temperature and in the whole temperature range investigated the corrosion proceeds at higher rates in the absence of inhibitor compound as revealed in Fig. 3. Nevertheless, the increase in the corrosion rate was more pronounced (i.e. 125 folds) in the case of inhibited corrosion compared to uninhibited cases (i.e. 45 folds) inferring an inhibition efficiency decrease with increasing temperature as shown in Fig. 4. This trend is most likely a consequence of the physical adsorption (physisorption) onto the corroding metal surface of the inhibitor (NR3) molecules32 that weakens at elevated temperatures47 which, as consequence, decreases the number of the adsorbed inhibitor's molecules and eventually leads to their partial desorption.48,49
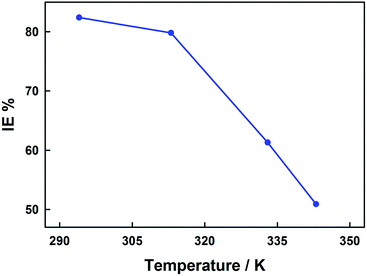 | ||
| Fig. 4 Temperature effect on the carbon steel corrosion inhibition efficiency in the presence of 3 × 10⁻³ M NR3 in 1 M HCl. | ||
This can be further elucidated by calculating the activation energy (Ea) on the assumption that the corrosion rate-temperature dependence obeys the Arrhenius equation:50
 | (5) |
The pre-exponential factor A having the same units of the corrosion rate, R is the universal gas constant, T is the absolute temperature and Ea the activation energy.
A plot of the corrosion rate natural logarithm against the absolute temperature reciprocal is shown in Fig. 5 and its good linearity both in the absence and presence of NR3 (R2 = 0.996 and 0.987, respectively) confirms the Arrhenius-type dependence of the corrosion rate on temperature in the present work conditions.
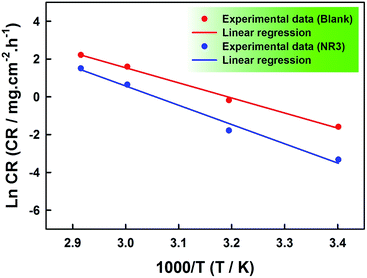 | ||
Fig. 5 ln![[thin space (1/6-em)]](https://www.rsc.org/images/entities/char_2009.gif) CR vs. (1/T) plots for the corrosion of carbon steel in the absence and presence of 3 × 10⁻³ M NR3 in 1 M HCl. CR vs. (1/T) plots for the corrosion of carbon steel in the absence and presence of 3 × 10⁻³ M NR3 in 1 M HCl. | ||
The values of the pre-exponential factor and the activation energy extracted respectively, from the slopes and the y-intercepts of the best-fitting regression lines in Fig. 5 are given in Table 3. A clearly observable activation energy increase in the presence of the optimum concentration of NR3 (i.e. 3 × 10⁻³ M) shows the energy barrier increase of the corrosion process48,50 and proves the NR3 molecules strong adsorption onto the carbon steel surface and by consequence the thickening of interfacial double layer49 resulting in its high inhibitory activity towards the carbon steel corrosion in the present work conditions. Moreover, this increase favors the physical nature of NR3 adsorption onto the metal surface.32,51
The Arrhenius transition-state equation32,33 applied to the investigated corrosion process allows the calculation of additional thermodynamic parameters:
 | (6) |
Plots of ln(CR/T) against the absolute temperature reciprocal for both uninhibited and inhibited corrosions are displayed in Fig. 6 and the various extracted parameters are included in Table 3. And here again, an activation enthalpy increase is observed in the presence of NR3 which is attributable to the existence of the ionic liquid cations at the interface of the corroding metal and the corrosive electrolyte.46 On the other hand, lower values of ΔHa compared to Ea, both in the absence and presence of corrosion inhibitor, are due to the hydrogen evolution reaction.32,33 Additionally, the difference (Ea − ΔHa = ca. 2.64 kJ) is constant for both cases and almost equal to the average value (RT = ca. 2.67 kJ) in the present work conditions, indicating a unimolecular corrosion process.32,33,51
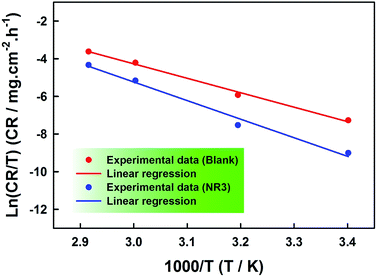 | ||
| Fig. 6 ln(CR/T) vs. (1/T) plots for the corrosion of carbon steel in the absence and presence of 3 × 10⁻³ M NR3 in 1 M HCl. | ||
With regards to the entropy of activation (ΔSa), examination of Table 3 results shows the ordering of the corroding metal surface in the rate-determining step as a consequence of the activated complex formation (negative sign of ΔSa) against a clearly pronounced disorder (positive sign of ΔSa) in the presence of inhibitor. The latter is then proven to be involved in a dissociation-type activation process.7,32,52 Furthermore, the observed increase of ΔSa is suggestive of water molecules replacement during NR3 adsorption onto the metal surface53 as discussed in the previous section.
3.3. Adsorption isotherm
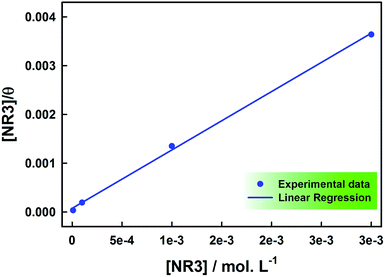
Adsorption isotherm enables the elucidation of the investigated ionic liquid inhibition mechanism through understanding its adsorptive strength and behaviour.7,48,49 The data is usually analyzed via common adsorption isotherms fitting, namely: Freundlich, Temkin, Flory–Huggins, Frumkin and Langmuir.7,34,48,49 In this work, the experimental data was best fitted to the Langmuir isotherm (R2 = 0.999) where the ratio of NR3 concentration and surface coverage (θ) is plotted against the concentration [NR3] (cf. Fig. 7) as per the equation:
 | (7) |
The extracted data are given in Table 4. The regression line slope is found to be very close to unity and that confirms again that NR3 adsorption onto the carbon steel surface follows Langmuir adsorption. This is indicative that there is no intermolecular forces between the adsorbed ionic liquid's molecules.50 The value of Kads extracted from the y-intercept was used to calculate the adsorption free energy (ΔGads) using the equation:34
ΔGads = −RT![[thin space (1/6-em)]](https://www.rsc.org/images/entities/char_2009.gif) ln(Kads × Csolvent) ln(Kads × Csolvent)
| (8) |
| Inhibitor | Slope | Kads (mol−1 L) | R2 | ΔGads (kJ mol−1) |
|---|---|---|---|---|
| NR3 | 1.196 | 13.353 × 10³ | 0.999 | −33.037 |
The relatively large adsorption constant (i.e. ca. 13.353 × 10³ mol−1 L) reveals the strong NR3 adsorption onto the corroding carbon steel surface54 which explains the observed high inhibition efficiencies. Whereas, the negative sign of the adsorption free energy confirms that this adsorption process is indeed spontaneous. On the other hand, the value of (ΔGads) gives a clear indication about the nature of the adsorption process. In this respect, it is commonly agreed in literature that free energy values equal or less than 20 kJ mol−1 are indicative a physisorption process while those equal or higher than 40 kJ mol−1 reveal its chemisorption nature.7,32–34,53,55,56 The value of (ΔGads = −33.037 kJ mol−1) obtained in the current work shows that a rather complex mixed-type adsorption is involved32–34,49,53,57 and that is a predominantly physisorption.32,58 This implies a predominant electrostatic interaction (physisorption) between NR3 and carbon steel in addition to electrons transfer or sharing (chemisorption) between NR3 molecules and the metal surface affecting most probably both anodic and cathodic sites.32,44 Such behaviour would be expected based on NR3 structure (cf. Scheme 1), for instance the nitrogen lone pairs and π-bonds as well as the aromatic ring that would be the origin of this strong adsorption and inhibition effectiveness.59,60 Further supporting results would be provided by electrochemical techniques.
3.4. Linear polarization
Linear polarization (LPR) curves for carbon steel corrosion both in the presence and absence of different concentrations of NR3 in molar HCl solutions are reported in Fig. 8.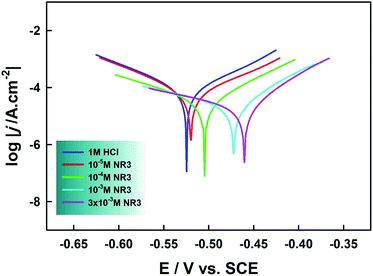 | ||
| Fig. 8 Linear polarization of carbon steel in the presence of different concentrations of NR3 in 1 M HCl at 294 K. | ||
At a first sight, it is noteworthy that Tafel-type behavior is exhibited by both anodic and cathodic branches. In addition, all curves show similar shapes which proves that neither cathodic (i.e. hydrogen evolution reaction HER) nor anodic (i.e. metal dissolution) mechanisms were altered as a consequence of the inhibitor's addition into the corrosive solution.53 From the Tafel lines extrapolation, we obtained various electrochemical parameters; cathodic slope (bc), anodic slope (ba), corrosion current (Icorr) and corrosion potential (Ecorr) which are collected in Table 5.
| [NR3] (mol L−1) | Ecorr (mV) | Icorr (A cm−2) | ba (mV dec−1) | bc (mV dec−1) | IE% | θ |
|---|---|---|---|---|---|---|
| Blank | −525 | 9.38 × 10⁻⁵ | 86 | 86 | — | — |
| 10−5 | −520 | 7.11 × 10⁻⁵ | 84 | 94 | 24.2 | 0.242 |
| 10−4 | −505 | 3.25 × 10⁻⁵ | 68 | 105 | 65.3 | 0.653 |
| 10−3 | −472 | 2.01 × 10⁻⁵ | 56 | 135 | 78.6 | 0.786 |
| 3 × 10⁻³ | −460 | 1.75 × 10⁻⁵ | 55 | 129 | 81.3 | 0.813 |
Inspection of Fig. 8 reveals parallel cathodic Tafel lines which indicate that HER is under activation (charge-transfer) control.7,49,61 Also, there is no significant change in the values of both anodic and cathodic Tafel slopes upon addition of various concentrations of NR3 compound suggesting that the inhibition mechanism of the latter proceeds through blocking the active anodic and cathodic sites on the carbon steel surface.62–64 The inhibitory effect of NR3 is also revealed as current densities decrease in both cathodic and anodic branches50 though this effect is slightly more pronounced on the latter. The degree of diminishment in current densities is a key factor for the inhibition efficiency that is calculated from the equation:
 | (9) |
Table 5 outlines steady inhibition efficiencies increase with increasing NR3 concentrations, reaching ca. 81.3% in the presence of [NR3] = 3 × 10⁻³ M agreeing very well with the gravimetric study results. Such behavior would be explainable by an increased adsorption of NR3 molecules onto the metal/corrosive media interface53 which is supported by the increasing surface coverage (cf. Table 5) which is calculated using the equation:63
 | (10) |
Such increase results in the corrosion active sites blocking which leads to the effective corrosion protection of the metal surface.7
One more observation pertains to the corrosion potential which showed a slight positive shift increasing with increasing inhibitor concentration yet the maximum shift (ΔEcorr = ca. 64 mV) remains below the threshold value 85 mV implying the mixed-type corrosion inhibitor classification of the investigated NR3 compound.62
3.5. Electrochemical impedance spectroscopy
Electrochemical impedance spectroscopy (EIS) has been extensively reported in literature as a non-destructive yet very powerful technique in corrosion studies enabling the elucidation of corrosion and inhibition mechanisms via providing useful information regarding the reaction kinetics and the surface properties through analysis of related impedance diagrams.55EIS results for the present work are shown as Nyquist and Bode presentations in Fig. 9 and 10, respectively. The single semicircular capacitive loop in the absence of inhibitor (cf. Fig. 9) is an indication of a single charge transfer process controlling the carbon steel corrosion reaction in the present study conditions.34 This shape was unaffected in the presence of NR3 at different concentrations revealing that the corrosion process activation-controlled nature was not changed, in agreement with (LPR) investigation.
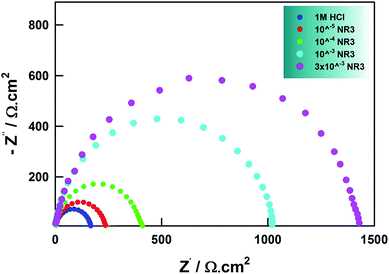 | ||
| Fig. 9 Nyquist plots for carbon steel in the presence of different concentrations of NR3 in 1 M HCl at 294 K. | ||
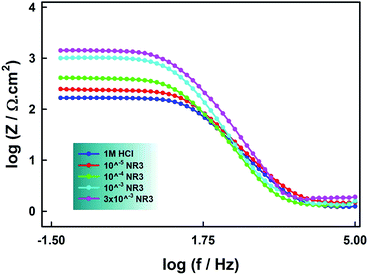 | ||
| Fig. 10 Bode plots for carbon steel in the presence of different concentrations of NR3 in 1 M HCl at 294 K. | ||
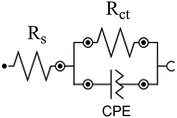
The depressed semicircles in Nyquist plots and the slopes that differ from (−1) in Bode plots are due to surface irregularity-induced frequency dispersal of impedance at the metal-solution interface that is attributable to electrode surface inhomogeneity, usually its roughness.48,50,63 Accordingly, instead of a regular capacitance, a constant-phase element (CPE) is included in the circuit model used for the EIS spectra analysis (cf. Scheme 2).
In that circuit, Rs and Rct represent the solution and charge-transfer resistances, respectively. The latter is indirectly proportional to the corrosion rate and by monitoring its value change the inhibition efficiency can be calculated by the equation:
 | (11) |
The accurate double layer capacitance values were determined by introducing the CPE in the fitting equivalent circuit since the capacitive loops in Fig. 9 are not perfect semicircles as a consequence of surface irregularities and the impedance is given by the equation:49
 | (12) |
 , w is the angular frequency, Y0 and n are, respectively, the values of the CPE admittance and exponent. The latter is a measure of the surface inhomogeneity34 ranging between 0.5 ≤ n ≤ 1 for depressed semicircle capacitive loops50 with the CPE acting as a perfect capacitance for n = 1.63
The double layer capacitance (Cdl) values are therefore determined using the expression:34
 | (13) |
All parameters are tabulated in Table 6.
| [NR3] (mol L−1) | R0ct (Ω cm2) | Rct (Ω cm2) | IE% | θ | Y0 (Mho cm−2) | n | Cdl (F cm−2) |
|---|---|---|---|---|---|---|---|
| Blank | 166 | 166 | — | — | 5.28 × 10⁻⁵ | 9.24 × 10⁻¹ | 3.57 × 10⁻⁵ |
| 10−5 | 166 | 236 | 29.7 | 0.297 | 4.74 × 10⁻⁵ | 9.18 × 10⁻¹ | 3.17 × 10⁻⁵ |
| 10−4 | 166 | 406 | 59.1 | 0.591 | 5.23 × 10⁻⁵ | 8.96 × 10⁻¹ | 3.34 × 10⁻⁵ |
| 10−3 | 166 | 1022 | 83.8 | 0.838 | 2.45 × 10⁻⁵ | 9.00 × 10⁻¹ | 1.62 × 10⁻⁵ |
| 3 × 10⁻³ | 166 | 1452 | 88.6 | 0.886 | 2.10 × 10⁻⁵ | 8.69 × 10⁻¹ | 1.24 × 10⁻⁵ |
A noteworthy feature in Fig. 10 is the increasing values of impedance with increasing NR3 concentration revealing the inhibitory effect of the investigated ionic liquid as a consequence of the corrosion process deceleration.49 Inspection of Fig. 9 reveals a remarkable increase of the capacitive semicircles diameters with increasing NR3 concentration explained by an increase in the values of Rct (cf. Table 6) suggesting a protective film formation onto the metal–electrolyte interface53 which is also supported by a notable decrease of the Cdl values especially at higher concentration of NR3 revealing the inhibitor's molecules adsorption onto the corroding metal surface in replacement of initially-adsorbed water molecules.55
According to Helmholtz model, this trend of Cdl is attributable to either or both the increase of the protective film thickness (δ) or the decrease of the relative dielectric constant (εr) as per the equation:55
 | (14) |
These results corroborate well with those of weight loss and LPR investigations, proving again that the inhibition process of NR3 proceeds by adsorption onto the metal surface.
The observed Cdl decrease and Rct increase results in increasing values of inhibition efficiencies reaching a value of ∼ca. 90% for a concentration [NR3] = 3 × 10⁻³ M with a similar trend of surface coverage (θ) by the adsorbed NR3 molecules, defined by the equation:
 | (15) |
3.6. Scanning electron microscopy
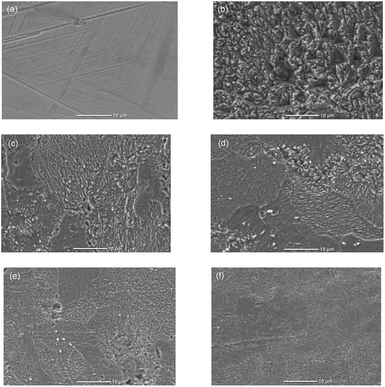
Insight onto the morphology of the corroding carbon steel surface both in the presence and absence of NR3 compound at various concentrations was achieved using scanning electron microscopy (SEM) and the respective micrographs are shown in Fig. 11.It can be remarked that the high corrosion rate in molar HCl solution caused a clear damage of the metal surface (Fig. 11b) which is gradually avoided with increasing NR3 concentrations (Fig. 11c–f). The formation and growth of a protective film can be clearly noticed by successively comparing frames (c–f) of Fig. 11. It can be easily observed that the surface morphology of the corroding metal exposed to the aggressively corrosive media containing as less as 3 mM NR3 molecules reveals a dense, thick and nearly defect-free protective layer (i.e. Fig. 11a) providing an additional evidence of the highly efficient corrosion inhibition effect of the investigated compound.
4. Conclusion
In the present work, NR3 ionic liquid has shown efficient inhibition for the corrosion of carbon steel in 1 M HCl solution. In all used techniques, the increasing inhibitor concentration led to inhibition efficiency (IE%) increase. Very well-correlated results were obtained with small numerical difference in the values of (IE%) due to the exposure time difference between gravimetric and electrochemical investigations (i.e. 5 hours vs. 30 min). The temperature effect study revealed that the NR3 inhibition mechanism proceeds via adsorption onto the surface of the corroding metal following a Langmuir isotherm with a predominant physisorption nature and a decreasing IE% with increasing temperature. This was supported by the (LPR) results proving the mixed-type nature of the investigated inhibitor where it affects both cathodic and anodic reactions as speculated from the gravimetric results. Additionally, LPR investigations confirmed the adsorptive action of NR3 molecules through blocking the active anodic and cathodic sites on the carbon steel surface lowering both cathodic and anodic corrosion currents. That was further confirmed by EIS measurements that showed unchanged activation-controlled process either in presence or absence of NR3 inhibitor. Also, from the trend of Rct and Cdl it was possible to confirm a protective film formation through the adsorption of NR3, replacing initially adsorbed water molecules. Monitoring of the surface morphology using SEM corroborated those findings by showing a steady growth of a protective film onto the corroding surface reaching a densely packed morphology at the optimum concentration (i.e. 3 mM) which showed the highest (IE%) in the present work conditions.Acknowledgements
Prof. N. Raouafi is highly acknowledged for providing the NR3 compound.References
- D. Ben Hmamou, M. R. Aouad, R. Salghi, A. Zarrouk, M. Assouag, O. Benali, M. Messali, H. Zarrok and B. Hammouti, J. Chem. Pharm. Res., 2012, 4, 3489–3497 CAS.
- A. H. Al Hamzi, H. Zarrok, A. Zarrouk, R. Salghi, B. Hammouti, S. S. Al-Deyab, M. Bouachrine, A. Amine and F. Guenoun, Int. J. Electrochem. Sci., 2013, 8, 2586–2605 CAS.
- C. Crowe, J. Masmonteil and R. Thomas, Oilfield Rev., 1992, 4, 22 Search PubMed.
- R. Solmaz, Corros. Sci., 2014, 81, 75–84 CrossRef CAS.
- M. Messali, J. Mater. Environ. Sci., 2011, 2, 174–185 CAS.
- V. S. Saji, Recent Pat. Corros. Sci., 2010, 2, 6–12 CrossRef CAS.
- M. R. Laamari, J. Benzakour, F. Berrekhis, A. Derja and D. Villemin, Arabian J. Chem., 2016, 9(suppl. 1), S245–S251 CrossRef CAS.
- S. Kharchouf, L. Majidi, M. Bouklah, B. Hammouti, A. Bouyanzer and A. Aouniti, Arabian J. Chem., 2014, 7, 680–686 CrossRef CAS.
- M. Yadav, D. Sharma and S. Kumar, Korean J. Chem. Eng., 2015, 32, 993–1000 CrossRef CAS.
- S. A. S. Dias, S. V. Lamaka, C. A. Nogueira, T. C. Diamantino and M. G. S. Ferreira, Corros. Sci., 2012, 62, 153–162 CrossRef CAS.
- M. Yu, M. Liang, J. Liu, S. Li, B. Xue and H. Zhao, Appl. Surf. Sci., 2016, 363, 229–239 CrossRef CAS.
- S. Peng, W. Zhao, H. Li, Z. Zeng, Q. Xue and X. Wu, Appl. Surf. Sci., 2013, 276, 284–290 CrossRef CAS.
- E. Roussi, A. Tsetsekou, A. Skarmoutsou, C. A. Charitidis and A. Karantonis, Surf. Coat. Technol., 2013, 232, 131–141 CrossRef CAS.
- I. Santana, A. Pepe, E. Jimenez-Pique, S. Pellice, I. Milošev and S. Ceré, Surf. Coat. Technol., 2015, 265, 106–116 CrossRef CAS.
- A. C. Balaskas, I. A. Kartsonakis, D. Snihirova, M. F. Montemor and G. Kordas, Prog. Org. Coat., 2011, 72, 653–662 CrossRef CAS.
- S. Zheng and J. Li, J. Sol–Gel Sci. Technol., 2010, 54, 174–187 CrossRef CAS.
- M. Dahmani, A. Et-Touhami, S. S. Al-Deyab, B. Hammouti and A. Bouyanzer, Int. J. Electrochem. Sci., 2010, 5, 1060–1069 CAS.
- A. Y. Musa, A. A. H. Kadhum, A. B. Mohamad, M. S. Takriff, A. R. Daud and S. K. Kamarudin, Corros. Sci., 2010, 52, 526–533 CrossRef CAS.
- E. M. Sherif and S. M. Park, J. Electrochem. Soc., 2005, 152, B428–B433 CrossRef CAS.
- E. M. Sherif and S. M. Park, Electrochim. Acta, 2006, 51, 1313–1321 CrossRef CAS.
- S. Ben Aoun, M. Bouklah, K. F. Khaled and B. Hammouti, Int. J. Electrochem. Sci., 2016, 11, 7343–7358 CrossRef.
- K. R. Ansari, M. A. Quraishi and A. Singh, Measurement, 2015, 76, 136–147 CrossRef.
- M. Yadav, S. Kumar, U. Sharma and P. N. Yadav, J. Mater. Environ. Sci., 2013, 4, 691–700 CAS.
- K. R. Ansari, Sudheer, A. Singh and M. A. Quraishi, J. Dispersion Sci. Technol., 2015, 36, 908–917 CrossRef CAS.
- N. Caliskan and E. Akbas, Mater. Chem. Phys., 2011, 126, 983–988 CrossRef CAS.
- X. Li, X. Xie, S. Deng and G. Du, Corros. Sci., 2014, 87, 27–39 CrossRef CAS.
- L. Bai, L.-J. Feng, H.-Y. Wang, Y.-B. Lu, X.-W. Lei and F.-L. Bai, RSC Adv., 2015, 5, 4716–4726 RSC.
- A. O. Yüce and G. Kardaş, Corros. Sci., 2012, 58, 86–94 CrossRef.
- M. A. Chidiebere, E. E. Oguzie, L. Liu, Y. Li and F. Wang, Mater. Chem. Phys., 2015, 156, 95–104 CrossRef CAS.
- M. Finšgar and D. Kek Merl, Corros. Sci., 2014, 83, 164–175 CrossRef.
- S. Hari Kumar and S. Karthikeyan, J. Mater. Environ. Sci., 2013, 4, 675–684 CAS.
- S. Ben Aoun, Pharma Chem., 2013, 5, 294–304 CAS.
- S. Ben Aoun, Int. J. Electrochem. Sci., 2013, 8, 10788–10804 CAS.
- H. Lgaz, R. Salghi, S. Jodeh and B. Hammouti, J. Mol. Liq., 2017, 225, 271–280 CrossRef CAS.
- B. Zhang, C. He, C. Wang, P. Sun, F. Li and Y. Lin, Corros. Sci., 2015, 94, 6–20 CrossRef CAS.
- X. Zhou, H. Yang and F. Wang, Electrochim. Acta, 2011, 56, 4268–4275 CrossRef CAS.
- P. Huang, J.-A. Latham, D. R. MacFarlane, P. C. Howlett and M. Forsyth, Electrochim. Acta, 2013, 110, 501–510 CrossRef CAS.
- N. V. Likhanova, M. A. Domínguez-Aguilar, O. Olivares-Xometl, N. Nava-Entzana, E. Arce and H. Dorantes, Corros. Sci., 2010, 52, 2088–2097 CrossRef CAS.
- I. Lozano, E. Mazario, C. O. Olivares-Xometl, N. V. Likhanova and P. Herrasti, Mater. Chem. Phys., 2014, 147, 191–197 CrossRef CAS.
- Q. Zhang and Y. Hua, Mater. Chem. Phys., 2010, 119, 57–64 CrossRef CAS.
- X. Zheng, S. Zhang, W. Li, M. Gong and L. Yin, Corros. Sci., 2015, 95, 168–179 CrossRef CAS.
- M. Scendo and J. Uznanska, Int. J. Corros., 2011, 2011 Search PubMed.
- F. Bentiss, M. Traisnel and M. Lagrenee, Corros. Sci., 2000, 42, 127–146 CrossRef CAS.
- L. Larabi, O. Benali and Y. Harek, Mater. Lett., 2007, 61, 3287–3291 CrossRef CAS.
- L. Larabi, Y. Harek, O. Benali and S. Ghalem, Prog. Org. Coat., 2005, 54, 256–262 CrossRef CAS.
- E. A. Noor, Corros. Sci., 2005, 47, 33–55 CrossRef CAS.
- L. Afia, N. Rezki, M. R. Aouad, A. Zarrouk, H. Zarrok, R. Salghi, B. Hammouti, M. Messali and S. S. Al-Deyab, Int. J. Electrochem. Sci., 2013, 8, 4346–4360 CAS.
- J. Haque, K. R. Ansari, V. Srivastava, M. A. Quraishi and I. B. Obot, J. Ind. Eng. Chem., 2017, 49, 176–188 CrossRef CAS.
- K. R. Ansari, M. A. Quraishi, A. Singh, S. Ramkumar and I. B. Obote, RSC Adv., 2016, 6, 24130–24141 RSC.
- V. V. Torres, V. A. Rayol, M. Magalhães, G. M. Viana, L. C. S. Aguiar, S. P. Machado, H. Orofino and E. D'Elia, Corros. Sci., 2014, 79, 108–118 CrossRef CAS.
- E. A. Noor, Int. J. Electrochem. Sci., 2007, 2, 996–1017 CAS.
- I. El Ouali, B. Hammouti, A. Aouniti, Y. Ramli, M. Azougagh, E. M. Essassi and M. Bouachrine, J. Mater. Environ. Sci., 2010, 1, 1–8 CAS.
- M. R. laamari, J. Benzakour, F. Berrekhis, M. Bakasse and D. Villemin, Arabian J. Chem., 2016, 9(suppl. 2), S1218–S1224 CrossRef CAS.
- A. Ghazoui, N. Bencaht, S. S. Al-Deyab, A. Zarrouk, B. Hammouti, M. Ramdani and M. Guenbour, Int. J. Electrochem. Sci., 2013, 8, 2272–2292 CAS.
- R. Laamari, J. Benzakour, F. Berrekhis, A. Abouelfida, A. Derja and D. Villemin, Arabian J. Chem., 2011, 4, 271–277 CrossRef CAS.
- A. Zarrouk, H. Zarrok, R. Salghi, B. Hammouti, F. Bentiss, R. Touir and M. Bouachrine, J. Mater. Environ. Sci., 2013, 4, 177–192 CAS.
- I. Ahamad, R. Prasad and M. A. Quraishi, Corros. Sci., 2010, 52, 1472–1481 CrossRef CAS.
- A. Guendouz, N. Missoum, A. Chetouani, S. S. Al-Deyab, B. Ben Cheikhe, N. Boussalah, B. Hammouti, M. Taleb and A. Aouniti, Int. J. Electrochem. Sci., 2013, 8, 4305–4327 CAS.
- C. Verma, M. A. Quraishi and A. Singh, J. Mol. Liq., 2015, 212, 804–812 CrossRef CAS.
- C. B. Verma, E. E. Ebenso, I. Bahadur, I. B. Obot and M. A. Quraishi, J. Mol. Liq., 2015, 212, 209–218 CrossRef CAS.
- S. Issaadi, T. Douadi, A. Zouaoui, S. Chafaa, M. A. Khan and G. Bouet, Corros. Sci., 2011, 53, 1484–1488 CrossRef CAS.
- L. Fragoza-Mar, O. Olivares-Xometl, M. A. Domínguez-Aguilar, E. A. Flores, P. Arellanes-Lozada and F. Jiménez-Cruz, Corros. Sci., 2012, 61, 171–184 CrossRef CAS.
- S. Martinez and M. Metikoš-Huković, J. Appl. Electrochem., 2003, 33, 1137–1142 CrossRef CAS.
- M. Parveen, M. Mobin and S. Zehra, RSC Adv., 2016, 6, 61235–61248 RSC.
| This journal is © The Royal Society of Chemistry 2017 |

