 Open Access Article
4,6-Dimethyl-2-mercaptopyrimidine as a potential leveler for microvia filling with electroplating copper
Mingxing Tanga,
Shengtao Zhang *a,
Yujie Qianga,
Shijin Chenb,
Li Luoa,
Jingyao Gaoc,
Li Fenga and
Zhongjian Qina
aSchool of Chemistry and Chemical Engineering, Chongqing University, Chongqing 400044, P. R. China
bResearch and Development Department, Guangdong Bomin Sci-Tech Co., Ltd., Meizhou 514000, P. R. China
cState Key Lab of Electronic Thin Films and Integrated Devices, University of Electronic Science and Technology of China (UESTC), Chengdu 610054, P. R. China
First published on 18th August 2017
Abstract
The impact of 4,6-dimethyl-2-mercaptopyrimidine (DMP) as a potential leveler on microvia electroplating copper filling from an acid cupric sulfate electrolyte, including polyethylene glycol (PEG), bis(3-sulfopropyl)disulfide (SPS), and chloride ion, was investigated. The results of electrochemical measurement, atomic force microscope (AFM), and X-ray photoelectron spectra (XPS) revealed that DMP adsorption on the copper surface inhibited copper deposition. Different surface morphology and crystalline orientation was observed after plating using electroplating solutions with different concentrations of DMP. Analytical data were obtained by field emission scanning electron microscope (FE-SEM) and X-ray diffractometer (XRD), respectively. In addition, quantum chemical calculations and molecular dynamics (MD) simulations were used to investigate the interaction mechanism between DMP and copper.
1. Introduction
Currently, multifunctional and portable electronic products, such as smart phones, tablets, and wearable devices, are rapidly developing in the direction of miniaturization and integration. Not only IC chips substrates but also motherboards of electronic products need high-density interconnections by a method using stacked microvias.1,2 In order to meet the demands of electronic products with multifunctions, high frequency, and high-speed performance,3 the microvias should be entirely filled by electroplating copper without seams or voids; i.e., so-called “superfilling” or “bottom-up filling”.4 However, according to reported literature,5 superfilling cannot be achieved due to uneven local current density contributions unless some particular additives are used which have significant influence on performance and orientation of the copper deposition.6To meet industrial requirements, several additives, such as an accelerator, a suppressor, and a leveler, must be simultaneously added to the electroplating copper solution.7 In this additive system, the accelerator not only combined with chloride ion enhanced copper deposition at the bottom but also improved grain structure of the electroplating copper; the suppressors quickly adsorbed on the copper surface in the presence of chloride ion, forming a saturated film that seriously hindered diffusion of Cu2+ to the copper surface and inhibited the copper deposition rate.8,9 For the sake of improving microvia electroplating copper filling performance and promoting copper surface uniformity, the leveler also was added to the electroplating solution.10 This was demonstrated in a large number of studies which showed that interactions among the additives in this system played a very significant role in the bottom-up filling.5 Dow et al.11 reported that ABPV can spontaneously adjust interaction between the accelerator and the suppressor from a bad filling pattern to a perfect pattern at low chloride ion concentrations. Moffat et al.9 proposed that dodecyltrimethylammonium chloride (DTAC) can deactivate the adsorbed SPS accelerator due to ion-pair interaction between the cationic head group of the DTAC and the anionic tail group of the adsorbed SPS accelerator.
As is well known, a leveler is an indispensable part of an electroplating additive system, which improves distribution of the current density and promotes microvia filling yields. However, the commonly used levelers in copper electrodeposition are quaternary ammoniums cations, such as Jauns Green B (JGB), Diazine Black (DB), Methylene Blue (MB), N-butyl-methyl piperidinium bromide (PP14Br), etc.12–17 It is a very time-consuming and expensive job to develop additives which can be used for microvia filling.18 Until now, only few additives used for microvia filling clearly have been reported.
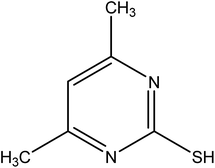
According to previous research, organic compounds with several heteroatoms (e.g., sulfur, nitrogen), conjugated double bonds, and/or polar functional groups, which have strong coordination and adsorption capability to the copper surface, can usually be used as inhibitors for corrosion of copper.19 Interestingly, the behavior of these organic compounds showed that they may be used as levelers for copper superfilling. At present, only a few compounds, such as 2-mercaptopyridine (2-MP), 6-aminobenzo-thiazole, and 4-amino-2,1,3-benzothiadiazole, have been studied as levelers for electroplating copper in microvia.20,21 Based on these structures, 4,6-dimethyl-2-mercaptopyrimidine (DMP) (Fig. 1) also appeared promising to improve filling performance, and its price is cheaper than JGB.
Another paper has reported DMP is an effective leveler, but it has no detailed research.5 Therefore, the purpose of the present work is to study filling performance in detail and electrochemical behaviors of different formulas with or without DMP, plus surface morphology, crystalline structure, thermal shock, and thermal cycle tests after copper plating. It has been proven that plating formulas containing DMP can completely meet requirements for PCB application reliability. To further study the interaction between DMP and the surface of copper, AFM and XPS patterns research was carried out. Also, both molecular dynamics (MD) simulation and quantum chemical calculations were used to analyze the active sites and adsorption behavior of DMP on copper surface.19 Based on the results of electrochemical measurements, AFM, XPS, and theoretical calculations, we can further explain the filling effect through combining with a microvia electroplating copper filling mechanism.
2. Experimental
2.1 Electroplating
The acidic electroplating Cu conditions, pretreatment techniques, and electroplating procedures have been presented in detail elsewhere.22 Test boards consisted of PCB fragments with a large number of microvias fabricated by CO2 laser ablation. The dimensions of these test boards were 6 × 13 cm2 with an effective size of 6 × 9 cm2. Diameters and depths of the microvia were 100 μm and 80 μm, respectively. Prior to microvia electroplating copper filling, the sidewalls of these microvias were metalized by electroless copper. Following that, flash plating copper (electroplating copper) was carried out to increase the thickness of copper layers up to about 5 μm to prevent electroless copper oxidation.Test boards were plated at a current density of 1.94 A dm−2 for 70 min at 25 °C. Two phosphorus-containing copper plates with a size of 6 × 13 cm2 were used as electroplating anodes and were directly placed in a Haring cell with a 1.5 L working volume. Constant agitation was produced by a wide stretch of air bubbles flowing at medium speed during electroplating of copper to guarantee efficient mass transfer. The composition of the base electrolyte was 0.88 mol L−1 CuSO4·5H2O, 0.54 mol L−1 H2SO4. Additives, such as HCl, SPS, PEG with a molecular weight of 8000, and DMP, were separately added to the Haring cell through dilution from stock solutions. The filling performance of various plating formula was assessed according to the cross-sections of microvia, which were examined using an optical microscope (OM, JX23, Guangdong Zheng ye Technology Co., LTD., China). Before examining the cross-sections of microvia, which were polished continuously with a series emery papers (320, 2000, and 5000 grit), they were etched to observe microstructures of the copper deposits.
2.2 Electrochemical measurements
All electrochemical measurements were conducted in a 250 mL glass beaker including 100 mL electroplating solution by a CHI660E electrochemical workstation with a conventional three-electrode system. The electroplating solution temperature was kept at 25 °C during electrochemical tests. A copper billet with a work area of 1 cm2 by epoxy resin sealing was used as the working electrode (WE). The counter electrode (CE) was a platinum plate and the reference electrode was a saturated calomel electrode (SCE) with a Luggin capillary.Prior to each measurement, the WE was abraded by a series of emery papers (320, 800, 2000, and 5000 grit) and was soaked in electroplating solution for 40 min until an almost steady-state open circuit potential (OCP) was obtained. Subsequently, electrochemical impedance spectroscopy (EIS) measurements were carried out at the OCP in a frequency range from 105 Hz to 10−2 Hz with an amplitude of 5 mV s−1. The EIS data were analyzed and fitted by Zsimpwin 3.10 software. Lastly, potentiodynamic polarization measurements were implemented in the potential range from OCP to −1.0 V with a scan rate of 5 mV s−1. All potential values obtained during electrochemical experiments were referred to SCE. The same electrochemical measurements were implemented 3 times to ensure good repeatability.
2.3 Reliability tests
A copper plating sample was placed in a constant temperature oven at 150 °C for 6 h and then immersed fully in a lead-free solder furnace at 288 °C for 10 s. Then it was taken out and cooled to room temperature as one test cycle. The whole test requires six repeated cycles.Then the copper plating sample was placed in a cycle test chamber, at temperatures of 125 °C and −55 °C for 15 min and working at room temperature for 20 min, respectively. This process is a test cycle, and the entire test requires 100 cycles.
2.4 FE-SEM and XRD measurements
Surface morphologies of the copper deposits obtained from different plating solutions were observed by FE-SEM, (JEOL-JSM-7800F-Japan). Structure orientation of the Cu electrodeposition was researched and analyzed by XRD (Tongda TD-3500, China) using Cu Kα radiation (1.54056 Å) at room temperature. The diffractograms were recorded in 2θ range from 30° to 100° with a step size of 0.07°.2.5 AFM and XPS measurements
The interaction between DMP and copper surface was investigated by AFM and XPS patterns. Copper sheets with surface area size of 1 cm2, which were intercepted from PCB, were used for AFM and XPS measurements. The copper sheets had to go through the following steps for preparation: initially, they were abraded and polished using all kinds of emery papers (320, 800, 2000, and 5000 grit) and polishing cloths with alumina polishing powder, respectively. Then, the polished copper sheet surfaces were washed ultrasonically with ethanol and ultrapure water, and then dried at room temperature to obtain a shining mirror-like copper surface. Lastly, they were immersed in 1 ppm DMP aqueous solution for 30 min. After soaking, they were rinsed with ultrapure water and dried at room temperature.AFM analysis was implemented with a MFP-3D-BIO (Uxford), working in the AC mode with Q-control. The XPS spectra tests were carried out using a Thermo Fisher ESCALAB 250Xi System at room temperature and employed Al Kα (1486.6 eV) as the incident radiation source.
2.6 Calculation methods
Quantum chemical calculations were performed by Gaussian 03W software. The DMP molecular structure was absolutely optimized by density functional theory (DFT) using B3LYP functional with the 6-311++G(d.p) basis set. The most popular quantum chemical parameters, such as the energy of the frontier molecule orbital (EHOMO, ELUMO), energy gap (ΔE = ELUMO − EHOMO), and dipole moment (μ), were calculated and considered.19 These parameters would be used to further explain the interaction mechanism between DMP and the copper surface.23Furthermore, interaction between DMP and the Cu (111) surface was studied by employing the forcite module in Material Studio software. The molecular dynamics (MD) simulation was carried out at 298 K with a time step of 1.0 fs and simulation time of 500 ps. The binding energy ECu–DMP between the DMP and Cu (111) surface was calculated as:24
| ECu–DMP = Ecomplex − ECu − EDMP |
3. Results and discussion
3.1 Electroplating test
Filling results of electroplating copper solutions with different formulas are shown in Fig. 2 and 3, and their filling performance is defined as the following equation:25| η = (A/B) × 100% |
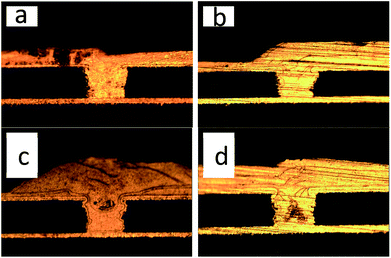 | ||
| Fig. 3 Representative OM images of cross-section of microvias obtained from the bath: (a) basic 10, (b) basic 11, (c) basic 12, and (d) basic 13. | ||
| CuSO4·5H2O (g) | H2SO4 (M) | Cl− (ppm) | SPS (ppm) | PEG-8000 (ppm) | DMP (ppm) | |
|---|---|---|---|---|---|---|
| Basic 1 | 220 | 0.54 | 30 | 0 | 0 | 0 |
| Basic 2 | 220 | 0.54 | 30 | 0 | 200 | 0 |
| Basic 3 | 220 | 0.54 | 30 | 1 | 200 | 0 |
| Basic 4 | 220 | 0.54 | 30 | 1 | 200 | 1 |
| Basic 5 | 220 | 0.54 | 30 | 1 | 200 | 2 |
| Basic 6 | 220 | 0.54 | 30 | 1 | 200 | 3 |
| Basic 7 | 220 | 0.54 | 30 | 1 | 200 | 5 |
| Basic 8 | 220 | 0.54 | 30 | 1 | 200 | 7 |
| Basic 9 | 220 | 0.54 | 30 | 1 | 200 | 9 |
| Basic 10 | 220 | 0.54 | 10 | 1 | 200 | 1 |
| Basic 11 | 220 | 0.54 | 10 | 1 | 200 | 2 |
| Basic 12 | 220 | 0.54 | 10 | 1 | 200 | 3 |
| Basic 13 | 220 | 0.54 | 10 | 1 | 200 | 5 |
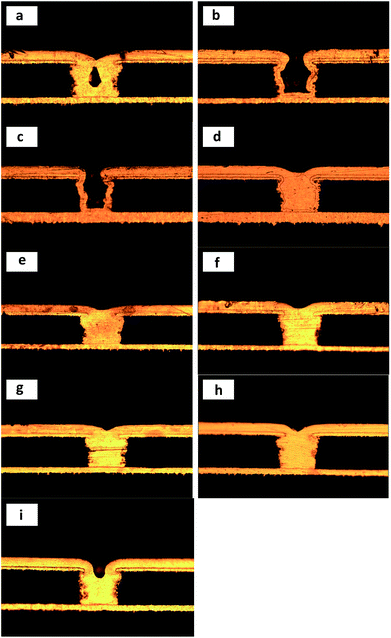
As can be seen from part a of Fig. 2, a large void was observed in the middle of the microvia; it could be attributed to non-uniform distribution of current density when no organic additives were present in the electroplating solution.27,28 This phenomenon disappeared when 200 ppm PEG (basic 2) or 1 ppm SPS and 200 ppm PEG (basic 3) was added to a bath solution, but did not turn into bottom-up filling and instead to conformal deposition.
The bottom-up filling appeared, as shown in Fig. 2d–i, by adding a small amount of DMP to the electroplating solution. Even 1 ppm DMP could cause perfect filling performance (86%) of the bath solution. Similar filling results were also obtained in other electroplating solutions using DB or JGB as a leveler.12,14 This phenomenon indicated that the synergistic effect between PEG-8000 and SPS was recovered by adding a small amount of DMP to the electroplating solution. However, when the DMP concentration was higher than 7 ppm, then filling performance of the electroplating solution declined. According to previous research, a reasonable interpretation explains this phenomenon is that excess DMP spread to the microvia, and seriously influenced the adsorption of SPS in them.15
When Cl− concentration decreased from 30 ppm to 10 ppm, the filling results of microvia and surface topography of a test board surface are shown in Fig. 3 and 4, respectively. As can be seen from Fig. 4, a uniform, light and smooth copper surface appeared in a large number of copper nodules, which form a texture that traces the air bubble flow.29 Similar electroplating results were obtained with other plating formula having low Cl− concentrations, which may be caused by local Cl− concentrations lower than the critical concentration for steady PEG adsorption.30 As shown in Fig. 3, the microvia filling turns into explosive growth regardless of the concentration of DMP. This phenomenon may be attributed to the effect of accelerating SPS–Cl−, which is greater than the inhibition of PEG–DMP–Cl− due to low chloride ion concentration easily leading to locally insufficient chloride ion coverage.29 In addition, some scholars11 consider that PEG–DMP–Cl− is a strong inhibitor of copper deposition. Nevertheless, because the Cl− concentration is too low, PEG–DMP–Cl− is not completely covering the copper surface, thus leading to the occurrence of this phenomenon.
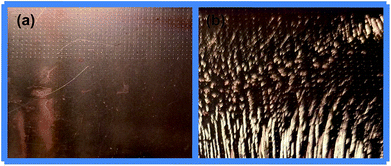 | ||
| Fig. 4 Representative photographs of copper surfaces of test boards obtained from baths: (a) basic 5 and (b) basic 11. | ||
3.2 Filling mechanism
According to the established model31 for simulating superfilling, SPS spread to the microvia in the presence of chloride ions and accumulated at the metal/electrolyte interface located at the bottom, where the complex copper deposition process containing a large number of reactions is displayed in the following equations:32–34| R–S–S–R + 2H+ + 2e− → 2R–S–H | (1) |
| 4R–SH + 2Cu2+ → 2R–S–Cu(Ι) + R–S–S–R + 4H+ | (2) |
| Cu2+ + Cl− + e− → CuCl | (3) |
| CuCl + e− →Cu + Cl− | (4) |
| nCu+ + HO((CH2)xO)yH → HO((CH2)xOCu)n((CH2)xO)y−nH | (5) |
| nCu+ + nCl− + HO((CH2)xO)yH → HO((CH2)xOCuCl)n((CH2)xO)y−nH | (6) |
Therefore, this partial accelerating effect at the microvia bottom and the inhibiting effect on the copper surface led to superfilling of microvia.
3.3 Electrochemical analysis
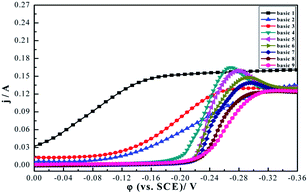
In order to get insight into the interaction between additives and the influence of different DMP concentrations on microvia filling performance, potentiodynamic polarization curves and electrochemical impedance spectroscopic were implemented.The effect of different formulas on potentiodynamic polarization curves at 298 K are shown in Fig. 5. It can be seen that deposition potential appeared at about −0.02 V using bath 1. In comparison, when PEG was added to bath 1, the deposition potential appeared as an obviously negative shift −0.13 V. This phenomenon mainly comes from PEG–Cl−, which strongly adsorbs on the surface of copper to inhibit copper deposition. According to relevant research,37 if the electroplating solution contains only PEG and Cl− without an accelerator, and the deposition rate of copper at the bottom of the microvia is not constrained by mass-transfer since Cu2+ concentration and is high, then this leads to conformal deposition. This result is consistent with our filling experiment (see Fig. 2b). When 1 ppm SPS was added to electroplating baths containing PEG and Cl−, the deposition potential appeared as a slightly positive shift (−0.12 V). This acceleration mainly derives from SPS–Cl−. However, the plating formulas also lead to conformal deposition (see Fig. 2c) due to the coverage increment of SPS on the copper surface. Therefore, excessive SPS correspondingly reduced the inhibiting effect induced by PEG–Cl− on copper deposition, resulting in a relatively fast copper deposition on the copper surface and a reversely slow copper deposition in the microvia.
With addition of DMP, the deposition potential of copper encountered an obviously negative shift (−0.21 V), and along with the cathode current density, progressively decreased. The result showed that the addition of DMP also could increase cathodic polarization even when SPS, PEG, and Cl− simultaneously exist in a bath solution, and this phenomenon became more serious with increasing DMP concentration. According to results of the AFM, XPS, and theoretical calculation (in Sections 3.6, 3.7 and 3.8), the parallel adsorbing of DMP to copper surface is through the pyrimidine ring. That increased the contact area between DMP and copper surface, and further increased the diffusion of copper ions to the cathode surface space steric hindrance. This phenomenon showed that DMP further increased an inhibiting effect caused by PEG–Cl− and co-inhibition of copper deposition. At the same time, a lot of SPS accumulated via bottom and accelerated copper deposition with the assistance of chloride ion, and thus caused different deposition rates between the copper surface and the bottom of the microvia. Hence, perfect bottom-up filling was obtained (see Fig. 2d–h). However, as the DMP concentration was increased to 9 ppm, the inhibition of the bath solution became very strong and more DMP molecules spread to the microvia, quenched catalyst activity of SPS, and affected copper deposition.38 Therefore, the microvia filling performance declined (see Fig. 2i).
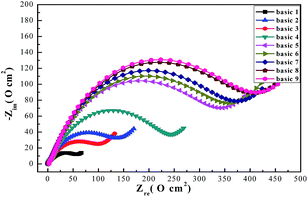
As shown in Fig. 6, Nyquist plots with different formulas can be divided into two parts according to frequency. High frequency impedance corresponding a depressed capacitive loop, which is related to double-layer capacitance (Cdl), and charge transfer resistance (Rct), indicating39 the inhomogeneities and roughness of the copper working electrodes. The low frequency impedance is straightforward, namely the Warburg impedance (W), which can be explained by dissolved cuprous chloride species transferring from the copper surface to the electroplating solution or to soluble oxygen invading the copper surface.40 As can be seen from the Nyquist plots the shape, type, and number of the capacitive loops almost stayed the same with addition of SPS, PEG, and DMP, but the diameters were different.8 Results showed that addition of the additives slightly changed the electrodeposition mechanism.41,42
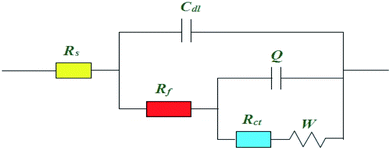
Usually, corresponding electrochemical impedance data was obtained by employing the equivalent circuits of Zsimpwin software and fitted data are listed in Table 2. This type of equivalent circuit is shown in Fig. 7, including solution resistance (Rs), charge transfer resistance (Rt), Warburg impedance (W), resistance of protective film formed on copper surface (Rf), and constant phase angle elements (CPE).
| Rs (Ω cm2) | Rf (Ω cm2) | Rct (Ω cm2) | CPE | W | ||
|---|---|---|---|---|---|---|
| Y0 (×10−3) | n | |||||
| Basic 1 | 0.4722 | 1.722 | 62.79 | 4.796 | 0.496 | 0.280 |
| Basic 2 | 0.5327 | 2.067 | 144.0 | 2.437 | 0.588 | 0.076 |
| Basic 3 | 0.5850 | 3.451 | 109.3 | 3.459 | 0.544 | 0.087 |
| Basic 4 | 0.5765 | 5.456 | 236.7 | 1.060 | 0.630 | 0.078 |
| Basic 5 | 0.5771 | 4.409 | 335.3 | 1.024 | 0.677 | 0.041 |
| Basic 6 | 0.6112 | 6.924 | 346.8 | 0.862 | 0.688 | 0.033 |
| Basic 7 | 0.5511 | 5.574 | 363.0 | 1.004 | 0.696 | 0.037 |
| Basic 8 | 0.5730 | 6.084 | 394.9 | 0.892 | 0.696 | 0.031 |
| Basic 9 | 0.6942 | 7.148 | 397.2 | 0.874 | 0.678 | 0.031 |
As can be seen from Table 2, the values of both Rs and Rf remain nearly unchanged with the addition additives. However, the Rct values changed a lot. As is well known, the copper deposition contained two steps:43
| Cu2+ + e− → Cu+ | (7) |
| Cu+ + e− → Cu | (8) |
Among them, reaction (7) is deemed to be the rate-determining step. The size of Rct usually is used to assess the suppression and acceleration ability of additives on copper deposition. From Table 2, the corresponding Rct value is 62.79 Ω only when Cl− is added to a bath solution. As is well known, the slight extent of depolarization caused by adding Cl− alone will accelerate copper surface deposition. The reaction mechanism was expressed as the above eqn (3) and (4). In addition, the copper deposition rate at the opening of the microvia is more than that of the bottom due to the uneven distribution of local current density. Therefore, a void occurred in the microvia interior (see Fig. 2a). In contrast, the Rct value increased to 144 Ω when the electroplating baths included Cl− and PEG. Many investigations44 have demonstrated that Cl− acts as an active site of PEG adsorption on the electrode surface to form a complex (PEG–Cu+–Cl−), which inhibited copper surface deposition. However, copper deposition rate of the microvia bottoms is too slow due to the low current density. Therefore, the conformal deposition appeared. After adding 1 ppm SPS to plating solution with PEG and Cl−, the Rct value decreased to 109.3 Ω. This phenomenon showed that SPS–Cl− destroyed the suppression ability of PEG–Cl− on the copper surface, and accelerated copper surface deposition. At this moment, the copper deposition rate also relatively increased due to accumulated SPS–Cl− at the microvia bottom. Therefore, the deposition rate difference between the bottom of microvia and copper surface are nearly the same, and the conformal deposition was also obtained (see Fig. 2c).
As expected, the Rct values increased with DMP added to an electroplating solution with SPS, Cl−, and PEG. This phenomenon had shown a suppression effect of the DMP on the copper surface and this effect was more remarkable with DMP concentrations up to a 7 ppm saturated value. This result can be considered to perfect DMP coverage on the copper surface during electroplating, and almost completely prevented further copper deposition with the assistance of PEG. Hence, bottom-up filling was obtained. However, as the DMP concentration was further increased, the ability of inhibiting the electroplating solution was too strong to obtain good filling performance (see Fig. 2i). All experimental results are consistent with the potentiodynamic polarization curve measurements.
3.4 Reliability measurements
Fig. 8 shows the cross-sections of microvia after a thermal shock test and thermal cycle test, respectively. As can be seen from Fig. 8, copper film peeling off, foaming phenomenon, and plate blasting after reliability tests did not appear. This means that the reliability of interconnections of PCBs is good and in accord with the quality standard in IPC-A-600H-2010.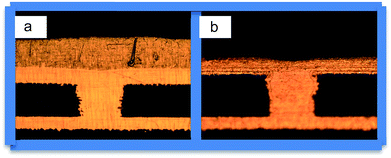 | ||
| Fig. 8 Representative metallographic photo of copper-filled via by electroplating after different shock tests: (a) tin immersion thermal shock and (b) thermal cycle. | ||
3.5 Effect of different concentrations of DMP on copper deposits morphology and crystalline orientation
The surface morphology of copper deposition obtained by adding different concentrations of DMP to the electroplating solution is shown in Fig. 9. Only two concentrations, namely, 1 and 2 ppm, can obtain a uniform, compact, and smooth surface, as shown in Fig. 9a and b. When DMP concentration increased to 3 ppm, a small quantity of acicular crystals appeared on the copper surface and became denser with increasing of DMP concentration. This means that higher DMP concentrations would destroy the synergistic effect on a copper surface. A similar plating result was obtained with the electroplating additives system using DB as a leveler.14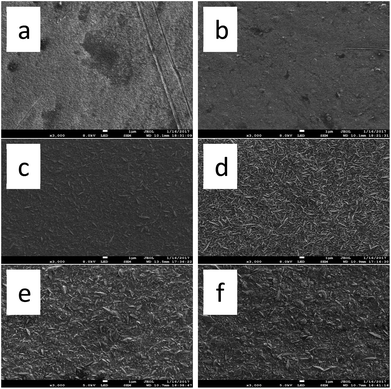 | ||
| Fig. 9 FE-SEM images of surface morphology of the electroplating Cu acquired from baths: (a) basic 4, (b) basic 5, (c) basic 6, (d) basic 7, (e) basic 8, and (f) basic 9. | ||
The influence of different concentrations of DMP on the crystalline structure of the copper deposits was characterized by XRD. As shown in Fig. 10, the diffraction pattern for the electroplating film exhibits four important peaks at 43.2°, 50.3°, 73.9°, and 90.1°, which correspond to (111), (200), (220) and (311) of copper, respectively. Previous research45–47 showed that the value of intensity ratios (111)/(220) decreased when leveler was added to an electroplating solution, so we do not discuss that here. From Fig. 10, the intensity of (111) increased and the intensity of (220) decreased with increasing DMP concentrations. When the concentration of DMP increased to 5 ppm, the value of ratios I(111)/I(220) reached a saturated value and the (111) orientation became absolutely dominant. A similar phenomenon was also obtained in another electroplating additive formula. Jiang et al.48 confirmed that higher EDTA concentrations added to an electroplating solution caused the (111) orientation to be dominant.
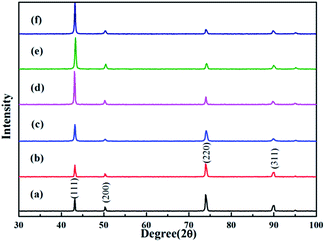 | ||
| Fig. 10 XRD patterns of the electroplating Cu film obtained from the baths: (a) basic 4, (b) basic 5, (c) basic 6, (d) basic 7, (e) basic 8, and (f) basic 9. | ||
3.6 Interaction between DMP and the copper surface of PCB
Two-dimensional (2D) and three-dimensional (3D) AFM graphs of the copper surface washed and polished by alumina polishing powder and treated without DMP are shown in Fig. 11a and b. Note that there were a few clear tiny scratches which derived from the polishing process on the copper surface. Furthermore, that part of the position of the copper surface was very angular. Fig. 11c and d presented AFM graphs of copper surfaces which have been soaked in 1 ppm DMP aqueous solution. Compared with Fig. 11a and b, the tiny scratches on the copper surface were not so obvious, and the angular degree of the entire copper surface was decreased. Mean surface roughness of the copper surface decreased from 8.941 nm (polished copper surface) to 6.403 nm. This phenomenon could be attributed to DMP adsorbed on the surface of the copper and it changed the copper surface morphology.49,50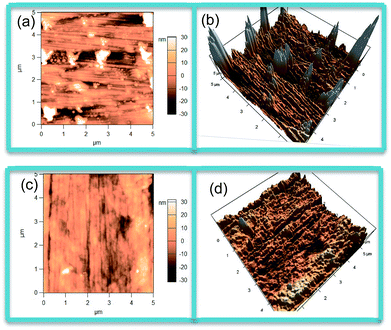 | ||
| Fig. 11 Two-dimensional and three-dimensional AFM images of (a, b) the polished copper surface and (c, d) copper surface treated with DMP aqueous solution. | ||
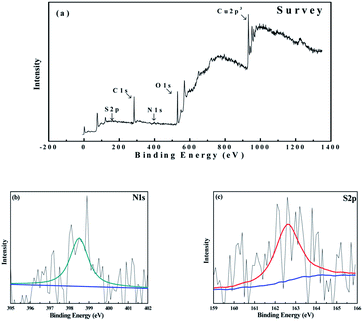
The high-resolution XPS survey scan spectra of copper surface is shown in Fig. 12a, which taken over a large binding energy region manifested the presence of carbon, nitrogen, oxygen, sulfur, and copper species. The binding energy of C1s peak at 284.8 eV was used as a standard value. The specific XPS peaks of N1s and S2p are shown in Fig. 12b and c, respectively. From Fig. 12b, we can observe a distinct peak at the binding energy of 399.7 eV, which could be attributed to the C–N or C![[double bond, length as m-dash]](https://www.rsc.org/images/entities/char_e001.gif) N bonds in DMP.51,52 As shown in Fig. 12c, we can also observe a peak at the binding energy of 162.7 eV, corresponding to the thiolate bonds in DMP.53,54 The N1s peak and S2p peak show the authentic existence of DMP molecules on the copper surface. Combined with the results of AFM and XPS patterns, it indicated that an ordered and compacted adsorption layer of DMP was obtained after the copper surface was soaked in the DMP aqueous solution. Therefore, DMP exhibited an effective levelling ability and is beneficial to microvia filling.
N bonds in DMP.51,52 As shown in Fig. 12c, we can also observe a peak at the binding energy of 162.7 eV, corresponding to the thiolate bonds in DMP.53,54 The N1s peak and S2p peak show the authentic existence of DMP molecules on the copper surface. Combined with the results of AFM and XPS patterns, it indicated that an ordered and compacted adsorption layer of DMP was obtained after the copper surface was soaked in the DMP aqueous solution. Therefore, DMP exhibited an effective levelling ability and is beneficial to microvia filling.
 | ||
| Fig. 12 (a) High definition XPS general spectra of the copper surface after 30 min of soaking in a 1 ppm DMP aqueous solution and (b) high definition peak of N1s (c); the high definition peak of S2p. | ||
3.7 Quantum chemical calculations
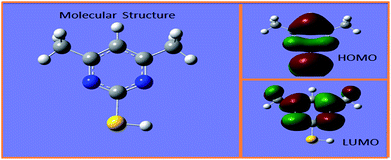
Quantum chemical calculations play a significant role to research interactions between additive molecules and the metal surface. Therefore, to gain insight into the adsorption behaviors of DMP on a copper surface, density functional theory (DFT) was implemented. Optimized geometrical configuration and density distributions of the frontier molecular orbital of DMP are shown in Fig. 13. Corresponding quantum chemical parameters, which include frontier molecular orbital energies (EHOMO, ELUMO), energy gap (ΔE = ELUMO − EHOMO), and dipole moment (μ), are collected in Table 3.| EHOMO (eV) | ELUMO (eV) | ΔE (eV) | μ (D) | |
|---|---|---|---|---|
| DMP | −0.243 | −0.046 | 0.197 | 3.41 |
According to previous reports55,56 the transition state was formed because of an interaction between the frontier molecular orbital of the reaction reagent. It is generally accepted that the EHOMO is usually relevant to electron donating ability, and the greater value of EHOMO indicated the molecular donating electrons ability became stronger. Conversely, the ELUMO is often associated with the ability of molecules to accept electrons and the lower value of ELUMO indicated the ability of molecules to accept electrons became stronger.23,57 Adsorption ability of the organic molecules on the metal surface was increased with the decreasing of ELUMO or increasing of EHOMO.58,59 Therefore, ΔE is generally associated with chemical stability of the leveler and could be used to judge adsorption ability.60 In addition, the dipole moment also plays a significant role to research the adsorption mechanism of a leveler.61 According to a previous investigation62 a high μ would lead to strong adsorption of the leveler on a copper surface due to electronic force. From Table 3, the molecule of DMP has a low value of ΔE and a high value of μ, indicating that DMP could strongly adsorb on the copper surface and result in increased cathodic potential and charge transfer resistance; thus, it inhibited copper surface deposition. Besides, as can be seen from Fig. 13, the HOMO of DMP is distributed on the –SH group, which means that the –SH was an active group donating electrons to low-energy empty molecular orbitals of copper to form a coordinate/covalent bond. The LUMO of DMP is located on N atoms, indicating N atoms were an active site for electrons from Cu to attack. These results are in accordance with the AFM and XPS measurements.
3.8 Molecular dynamic simulation
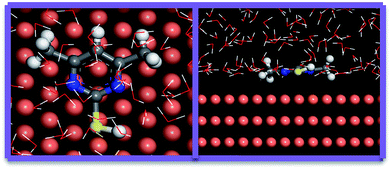
For a long time, MD simulation, which has been widely used, was a useful tool to study the interaction between the additives and copper.63 Therefore, MD simulations have been established to pattern the adsorption mechanism of DMP on the surface of Cu (111)64 in this article. The top and side views of the optimized equilibrium configuration of DMP are shown in Fig. 14. It can be seen that the DMP molecule can be parallelly adsorbed on the copper surface through the pyrimidine ring, increasing the degree of surface coverage and inhibiting copper deposition. This parallel mode fully demonstrated our conjecture for the above experimental results. Moreover, the value of adsorption energy between Cu (111) surface and the DMP molecule obtained from MD simulation is 250.5 kJ mol−1. This high absolute value indicated the strong adsorption ability between DMP and copper surface.65,66 These results further proved that the adsorption of DMP on copper surface increased cathodic potential and charge transfer resistance, inhibited the copper surface electrodeposition, and increased filling performance of microvia. This result is similar to Janus Green B, which was an effective leveler proved by several scholars.674. Conclusions
DMP was used as a leveler in microvia electroplating copper filling experiments. The main results of the study are summarized as follows:After plating copper filling experiments, a void can be clearly seen in the middle of the microvia because no organic additives were present in the bath solution. In contrast, when the electroplating solution contained only PEG and Cl− without an accelerator, the deposition rate of copper at the bottom of the microvia was not constrained by mass-transfer, which lead to conformal deposition. After 1 ppm SPS was added to the electroplating solution, which correspondingly reduced the inhibiting effect caused by PEG–Cl− on copper deposition, it resulted in a relatively fast copper deposition on the copper surface and a reversely slow copper deposition in the microvia. Therefore, conformal deposition was also obtained. That means only added DMP to an electroplating solution can obtain a perfect filling effect. However, excess DMP added to an electroplating solution caused too strong of an inhibiting ability, quenched catalyst activity of SPS, and affected copper deposition rate, which resulted in the filling performance of electroplating solution to decline. In addition, if only 10 ppm Cl− is added to an electroplating solution with SPS, PEG, and DMP, then a stable adsorption ability of PEG and DMP can't be obtained. Inversely, SPS can facilitate copper deposition. Therefore, the test board surface appeared with a large number of copper nodules, and the microvia filling had explosive growth.
With addition of SPS, the cathodic polarization shift to a more positive value and the value of Rct decreased. However, if DMP or PEG are added to the bath solution, the cathodic polarization and charge transfer resistance are increased with the assistance of Cl−, indicating that they could inhibit copper electrodeposition.
The FE-SEM images and XRD measurements indicated that a uniform, compact, and smooth surface can be obtained; when lower concentrations of DMP were added to electroplating solution, the (111) orientations became dominate. However, when higher DMP concentrations were added to the electroplating solution, acicular crystals appeared on the copper surface, and the preferential orientations of electroplating copper transformed from (220) to (111).
AFM and XPS measurements demonstrated DMP adsorbed on the cathodic surface and inhibited copper surface deposition. Hence, it exhibited an effective levelling ability and is beneficial to microvia filling.
The results obtained from quantum chemical calculations and MD simulation indicated N atoms and –SH of the DMP molecule were active groups that can be parallelly adsorbed on the surface of copper through the pyrimidine ring due to electronic forces and increased the degree of surface coverage and inhibited copper deposition.
Conflicts of interest
There are no conflicts to declare.Acknowledgements
The authors gratefully acknowledge the support of Sail plane of Guangdong province (No. 2015YT02D025), National Natural Science Foundation of China (No. 21376282), Chongqing Innovation Fund for Graduate Students (No. CYB17022), key technology and industrialization for high density intelligently control circuits of automotive electronics (2015B090901032).References
- K. Takagi, H. Honma and T. Sasabe, Development of sequential build-up multilayer printed wiring boards in Japan, IEEE Electr. Insul. Mag., 2013, 19, 27–56 CrossRef.
- V. Sundaram, R. R. Tummala, F. Liu, P. A. Kohl, J. Li, S. A. Bidstrup-Allen and Y. Fukuoka, Next-generation microvia and global wiring technologies for SOP, IEEE Trans. Adv. Packag., 2004, 27, 315–325 CrossRef CAS.
- Y. D. Chiu, W. P. Dow, S. M. Huang, S. L. Yau and Y. L. Lee, Sensitivity Enhancement for Quantitative Electrochemical Determination of a Trace Amount of Accelerator in Copper Plating Solutions, J. Electrochem. Soc., 2011, 158, D290–D297 CrossRef CAS.
- D. Josell, T. P. Moffat and D. Wheeler, Superfilling Adsorbed Accelerators Are Mobile, J. Electrochem. Soc., 2007, 154, D208–D214 CrossRef CAS.
- S. J. Ren, Z. W. Lei and Z. L. Wang, Investigation of Nitrogen Heterocyclic Compounds as Levelers for Electroplating Cu filling by Electrochemical Method and Quantum Chemical Calculation, J. Electrochem. Soc., 2015, 16, D509–D514 CrossRef.
- L. Bonou, M. Eyraud, R. Denoyel and Y. Massiani, Influence of additives on Cu electrodeposition mechanisms in acid solution: direct current study supported by non-electrochemical measurements, Electrochim. Acta, 2002, 47, 4139–4148 CrossRef CAS.
- N. Xiao, N. Li, G. F. Cui, D. Tian, S. Y. Yu, Q. Li and G. Wu, Triblock copolymers as suppressors for microvia filling via copper electroplating, J. Electrochem. Soc., 2013, 160, D188–D195 CrossRef CAS.
- A. Y. Wang, B. Chen, L. Fang, J. J. Yu and L. M. Wang, Influencing of branched quaternary ammonium surfactant molecules as levelers for copper electroplating from acidic sulfate bath, Electrochim. Acta, 2013, 108, 698–706 CrossRef CAS.
- S. K. Kim, D. Josell and T. P. Moffat, Cationic surfactants for the control of overfill bumps in Cu superfilling, J. Electrochem. Soc., 2006, 153, C826–C833 CrossRef CAS.
- A. Chrzanowska, R. Mroczka and M. Florek, Effect of interaction between dodecyltrimethylammonium chloride (DTAC) and bis(3-sulphopropyl) disulphide (SPS) on the morphology of electrodeposited copper, Electrochim. Acta, 2013, 106, 49–62 CrossRef CAS.
- W. P. Dow, M. Y. Yen, C. W. Liu and C. C. Huang, Enhancement of filling performance of a copper plating formula at low chloride concentration, Electrochim. Acta, 2008, 53, 3610–3619 CrossRef CAS.
- W. P. Dow and C. W. Liu, Evaluating the Filling Performance of a Copper Plating Formula Using a Simple Galvanostat Method, J. Electrochem. Soc., 2006, 153, C190–C194 CrossRef CAS.
- W. P. Dow, C. C. Li, M. W. Lin, G. W. Su and C. C. Huang, Copper Fill of Microvia Using a Thiol-Modified Cu Seed Layer and Various Levelers, J. Electrochem. Soc., 2009, 156, D314–D320 CrossRef CAS.
- W. P. Dow, C. C. Li, Y. C. Su, S. P. Shen, C. C. Huang, C. Lee, B. Hsuc and S. Hsuc, Microvia filling by copper electroplating using diazine black as a leveler, Electrochim. Acta, 2009, 54, 5894–5901 CrossRef CAS.
- R. Manu and S. Jayakrishnan, Effect of organic dye on copper metallization of high aspect ratio through hole for interconnect application, Mater. Chem. Phys., 2012, 135, 425–432 CrossRef CAS.
- C. Wang, M. Z. An, P. Y. Yang and J. Q. Zhang, Prediction of a new leveler (N-butyl-methyl piperidinium bromide) for through-hole electroplating using molecular dynamics simulations, Electrochem. Commun., 2012, 18, 104–107 CrossRef CAS.
- B. Bozzini, C. Mele, L. D'urzo and V. Romanello, An electrochemical and in situ SERS study of Cu electrodeposition from acidic sulphate solutions in the presence of 3-diethylamino-7-(4-dimethylaminophenylazo)-5-chloride (Janus Green B), J. Appl. Electrochem., 2006, 36, 973–981 CrossRef CAS.
- B. Chen, J. Xu, L. M. Wang, L. F. Song and S. Y. Wu, Synthesis of Quaternary Ammonium Salts Based on Diketopyrrolopyrroles Skeletons and Their Applications in Copper Electroplating, ACS Appl. Mater. Interfaces DOI:10.1021/acsami.6b15400.
- Y. J. Qiang, S. T. Zhang, S. Y. Xu and W. P. Li, Experimental and theoretical studies on the corrosion inhibition of copper by two indazole derivatives in 3.0% NaCl solution, J. Colloid Interface Sci., 2016, 472, 52–59 CrossRef CAS PubMed.
- C. Chang, X. B. Lu, Z. W. Lei, Z. L. Wang and C. Zhao, 2-Mercaptopyridine as a new leveler for bottom-up filling of microvias in copper electroplating, Electrochim. Acta, 2016, 208, 33–38 CrossRef CAS.
- H. C. Tsai, Y. C. Chang and P. W. Wu, Rapid Galvanostatic Determination on Levelers for Superfilling in Cu Electroplating, Electrochem. Solid-State Lett., 2010, 13, D7–D10 CrossRef CAS.
- W. P. Dow, H. S. Huang, M. Y. Yen and H. C. Huang, Influence of Convection-Dependent Adsorption of Additives on Microvia Filling by Copper Electroplating, J. Electrochem. Soc., 2005, 152, C425–C434 CrossRef CAS.
- C. Wang, J. Q. Zhang, P. X. Yang and M. Z. An, Electrochemical behaviors of Janus Green B in through-hole copper electroplating: an insight by experiment and density functional theory calculation using Safranine T as a comparison, Electrochim. Acta, 2013, 92, 356–364 CrossRef CAS.
- D. Wang, B. Xiang, Y. Liang, S. Song and C. Liu, Corrosion control of copper in 3.5 wt% NaCl solution by domperidone: experimental and theoretical study, Corros. Sci., 2014, 85, 77–86 CrossRef CAS.
- W. P. Dow, M. Y. Yen, W. B. Lin and S. W. Ho, Influence of Molecular Weight of Polyethylene Glycol on Microvia Filling by Copper Electroplating, J. Electrochem. Soc., 2005, 152, C769–C775 CrossRef.
- H. S. Xiao, D. J. Xiao and B. Y. Liu, Study on copper electroplating additives for blind via, Electroplat. Finish., 2013, 12, 31–34 Search PubMed.
- P. Dixit and J. Miao, Aspect ratio-dependent copper electrodeposition technique for very high aspect ratio through-hole plating, J. Electrochem. Soc., 2006, 153, G552–G559 CrossRef CAS.
- D. A. Hazlebeck and J. B. Talbot, Modeling of additive effects on the electroplating of a through-hole, AIChE J., 1990, 36, 1145–1155 CrossRef CAS.
- P. F. Chan, Y. D. Chiu, W. P. Dow, K. Krug, Y. L. Lee and S. L. Yau, Use of 3,3-Thiobis(1-propanesulfonate) to Accelerate Microvia Filling by Copper Electroplating, J. Electrochem. Soc., 2013, 160, D3271–D3277 CrossRef CAS.
- K. R. Hebert, Role of Chloride Ions in Suppression of Copper Electrodeposition by Polyethylene Glycol, J. Electrochem. Soc., 2005, 152, C283–C287 CrossRef CAS.
- T. P. Moffat, D. Wheeler, W. H. Huber and D. Josell, Superconformal Electrodeposition of Copper, Electrochem. Solid-State Lett., 2001, 4, C26–C29 CrossRef CAS.
- Y. D. Chiu and W. P. Dow, Accelerator Screening by Cyclic Voltammetry for Microvia Filling by Copper Electroplating, J. Electrochem. Soc., 2013, 160, D3021–D3027 CrossRef CAS.
- H. P. Lee, K. Nobe and A. J. Pearlstein, Film formation and current oscillations in the electrodissolution of copper in acidic chloride media. I. Experimental studys, J. Electrochem. Soc., 1985, 16, 1031–1037 CrossRef.
- T. Kekesi and M. Isshiki, Electrodeposition of copper from pure cupric chloride hydrochloric acid solutions, J. Appl. Electrochem., 1997, 27, 982–990 CrossRef CAS.
- W. Wang and Y. B. Li, Effect of Cl− on the Adsorption-Desorption Behavior of PEG, J. Electrochem. Soc., 2008, 155, D263–D269 CrossRef CAS.
- Z. V. Feng, X. Li and A. A. Gewirth, Inhibition Due to the Interaction of Polyethylene Glycol, Chloride, and Copper in Plating Baths: A Surface-Enhanced Raman Study, J. Phys. Chem. B, 2003, 107, 9415–9423 CrossRef CAS.
- W. P. Dow, M. Y. Yen, S. Z. Liao, Y. D. Chiu and H. C. Huang, Filling mechanism in microvia metallization by copper electroplating, Electrochim. Acta, 2008, 53, 8228–8237 CrossRef CAS.
- X. B. Lu, L. J. Yao, S. J. Ren and Z. L. Wang, A study of bottom-up electroplated copper filling by the potential difference between two rotating speeds of a working electrode, J. Electroanal. Chem., 2014, 712, 25–32 CrossRef CAS.
- Z. Q. Wang, Y. L. Gong, C. Jing, H. J. Huang, H. R. Li, S. T. Zhang and F. Gao, Synthesis of dibenzotriazole derivatives bearing alkylene linkers as corrosion inhibitors for copper in sodium chloride solution: a new thought for the design of organic inhibitors, Corros. Sci., 2016, 113, 64–77 CrossRef CAS.
- C. C. Li, X. Y. Guo, S. Shen, P. Song, T. Xu, Y. Wen and H. F. Yang, Adsorption and corrosion inhibition of phytic acid calcium on the copper surface in 3 wt% NaCl solution, Corros. Sci., 2014, 83, 147–154 CrossRef CAS.
- S. Varvara, L. Muresan, I. C. Popescu and G. Maurin, Comparative study of copper electrodeposition from sulphate acidic electrolytes in the presence of IT-85 and of its components, J. Appl. Electrochem., 2005, 35, 69–76 CrossRef CAS.
- S. Varvara, L. Muresan, I. C. Popescu and G. Maurin, Kinetics of copper electrodeposition in the presence of triethyl-benzyl ammonium chloride, J. Appl. Electrochem., 2003, 33, 685–692 CrossRef CAS.
- E. Mattsson and J. O. 'M. Bockris, Galvanostatic studies of the kinetics of deposition and dissolution in the copper + copper sulphate system, Trans. Faraday Soc., 1959, 55, 299–301 RSC.
- W. P. Dow and H. S. Huang, Roles of Chloride Ion in Microvia Filling by Copper Electrodeposition I. Studies Using SEM and Optical Microscope, J. Electrochem. Soc., 2005, 152, C67–C76 CrossRef CAS.
- H. Hagiwara, R. Kimizuka and H. Honma, Performance evaluation of acid copper plating films for via filling, Trans. Inst. Met. Finish., 2013, 84, 260–265 CrossRef.
- V. A. Vas'ko, I. Tabakovic, S. C. Riemer and M. T. Kief, Effect of organic additives on structure, resistivity, and room-temperature recrystallization of electrodeposited copper, Microelectron. Eng., 2004, 75, 71–77 CrossRef.
- A. Ibanez and E. Fatás, Mechanical and structural properties of electrodeposited copper and their relation with the electrodeposition parameters, Surf. Coat. Technol., 2005, 191, 7–16 CrossRef CAS.
- B. Hong, C. H. Jiang and X. J. Wang, Influence of complexing agents on texture formation of electrodeposited copper, Surf. Coat. Technol., 2007, 201, 7449–7452 CrossRef CAS.
- C. Wang, J. Q. Zhang, P. X. Yang, B. Q. Zhang and M. Z. An, Through-Hole Copper Electroplating Using Nitrotetrazolium Blue Chloride as a Leveler, J. Electrochem. Soc., 2013, 160, D85–D88 CrossRef CAS.
- C. Wang, J. Q. Zhang, P. X. Yang and M. Z. An, Through-Hole Filling by Copper Electroplating Using Sodium Thiazolinyl-Dithiopropane Sulfonate as the Single Additive, Int. J. Electrochem. Sci., 2012, 7, 10644–10651 CAS.
- M. Ahmed, J. A. Byrne and J. A. D. Mclaughlin, Glycine adsorption onto DLC and N-DLC thin films studied by XPS and AFM, e-J. Surf. Sci. Nanotechnol., 2009, 7, 217–224 CrossRef CAS.
- Y. Sasikumar, A. M. Kumar, M. Z. Gasem and E. E. Ebenso, Gasem hybrid nanocomposite from aniline and CeO2 nanoparticles: surface protective performance on mild steel in acidic environment, Appl. Surf. Sci., 2015, 330, 207–215 CrossRef CAS.
- F. Sinapi, S. Julien, D. Auguste, L. Hevesi, J. Delhalle and Z. Mekhalif, Monolayers and mixed-layers on copper towards corrosion protection, Electrochim. Acta, 2008, 53, 4228–4238 CrossRef CAS.
- Z. Mekhalif, F. Sinapi, F. Laffneur and J. Delhalle, XPS and electrochemical characterisation of polycrystalline copper modified with 12-(N-pyrrolyl)-n–dodecanethiol, J. Electron Spectrosc. Relat. Phenom., 2001, 121, 149–161 CrossRef CAS.
- L. Feng, H. Yang and F. Wang, Experimental and theoretical studies for corrosion inhibition of carbon steel by imidazoline derivative in 5% NaCl saturated Ca(OH)2 solution, Electrochim. Acta, 2001, 58, 427–436 CrossRef.
- M. Finsgar, A. Lesar, A. Kokalj and I. Milosev, A comparative electrochemical and quantum chemical calculation study of BTAH and BTAOH as copper corrosion inhibitors in near neutral chloride solution, Electrochim. Acta, 2008, 53, 8287–8297 CrossRef CAS.
- Y. J. Qiang, L. Guo, S. T. Zhang, W. P. Li, S. S. Yu and J. H. Tan, Synergistic effect of tartaric acid with 2,6-diamino pyridine on the corrosion inhibition of mild steel in 0.5 M HCl, Sci. Rep. DOI:10.1038/srep 33305.
- E. E. Oguzie, S. G. Wang, Y. Li and F. H. Wang, Influence of Iron Microstructure on Corrosion Inhibitor Performance in Acidic Media, J. Phys. Chem. C, 2009, 113, 8420–8429 CAS.
- A. Kokalj and S. Peljhan, Density Functional Theory Study of ATA, BTAH, and BTAOH as Copper Corrosion Inhibitors: Adsorption onto Cu(111) from Gas Phase, Langmuir, 2010, 26, 14582–14593 CrossRef CAS PubMed.
- K. Barouni, L. Bazzi, R. Salghi, M. Mihit, B. Hammouti, A. Albourine and S. E. Issami, Some amino acids as corrosion inhibitors for copper in nitric acid solution, Mater. Lett., 2008, 62, 3325–3327 CrossRef CAS.
- Y. J. Qiang, S. T. Zhang, L. Guo, X. W. Zheng, B. Xiang and S. J. Chen, Experimental and theoretical studies of four allyl imidazolium-based ionic liquids as green inhibitors for copper corrosion in sulfuric acid, Corros. Sci., 2017, 119, 68–78 CrossRef CAS.
- M. Sahin, G. Gece, F. Karci and S. Bilgiç, Experimental and theoretical study of the effect of some heterocyclic compounds on the corrosion of low carbon steel in 3.5% NaCl medium, J. Appl. Electrochem., 2008, 38, 809–815 CrossRef CAS.
- Y. J. Qiang, S. T. Zhang, S. Y. Xu and L. L. Yin, The effect of 5-nitroindazole as an inhibitor for the corrosion of copper in a 3.0% NaCl solution, RSC Adv., 2015, 5, 63866–63873 RSC.
- N. Kovacevic, I. Milošev and A. Kokalj, The roles of mercapto, benzene, and methyl groups in the corrosion inhibition of imidazoles on copper: II. Inhibitor–copper bonding, Corros. Sci., 2015, 98, 457–470 CrossRef CAS.
- S. Hong, W. Chen, Y. Zhang, H. Q. Luo, M. Li and N. B. Li, Investigation of the inhibition effect of trithiocyanuric acid on corrosion of copper in 3.0 wt% NaCl, Corros. Sci., 2013, 66, 308–314 CrossRef CAS.
- D. Q. Zhang, H. J. Zeng, L. Zhang, P. Liu and L. X. Gao, Influence of oxygen and oxidant on corrosion inhibition of cysteine self-assembled membranes for copper, Colloids Surf., A, 2014, 445, 105–110 CrossRef CAS.
- O. Lühn, C. VanHoof, W. Ruythoorenb and J. P. Celis, Filling of microvia with an aspect ratio of 5 by copper electrodeposition, Electrochim. Acta, 2009, 54, 2504–2508 CrossRef.
| This journal is © The Royal Society of Chemistry 2017 |

