 Open Access Article
Gold nanorods on three-dimensional nickel foam: a non-enzymatic glucose sensor with enhanced electro-catalytic performance†
Wenqi Liu *a,
Xiaochun Wub and
Xiaojin Li*a
aQingdao Institute of Bioenergy and Bioprocess Technology, Chinese Academy of Sciences, Qingdao 266101, P. R. China. E-mail: liuwq@qibebt.ac.cn
bCAS Key Laboratory of Standardization and Measurement for Nanotechnology, National Center for Nanoscience and Technology, Beijing 100190, P. R. China
First published on 24th July 2017
Abstract
We developed a non-enzymatic electrochemical glucose sensor with a unique three dimensional network structure by combining Ni foam with Au nanorods (Au NRs) on its surface (Au NRs/Ni). Electrochemical measurements revealed that the Au NRs/Ni foam exhibits very high sensitivity with a linear slope of 5.27 mA mM−1 cm−2 for glucose detection, better than the Ni foam electrode and most of the reported electrodes. And its linear dynamic range is also broader than the Ni foam electrode. Moreover, upon light excitation of the localized surface plasmon resonance (SPR) of the Au NRs, light-enhanced electrochemical activities are observed from the Au NRs/Ni foam, suggesting the possibility of modifying electrochemical sensors by surface plasmon resonance. These results highlight the potentials of the Au NRs/Ni foam electrode in practical glucose monitoring and plasmonic effects in photoelectrochemical sensing.
Introduction
Extensive studies have been devoted to the development of glucose sensors in the past few decades due to their considerable applications in the diagnosis of diabetes, waste water treatment and food analysis.1 Basically, there are two categories of glucose sensors: enzymatic and non-enzymatic ones.2 Although enzymatic detection provides high sensitivity and good selectivity, its application is restricted due to the intrinsic nature of enzymes including their instability and sensitivity to their environment.3 Therefore, tremendous efforts have been directed toward the improvement of non-enzymatic glucose (NEG) sensors.4,5 Electrochemical method is often employed for NEG detection, which is based on the current response of glucose oxidation at the electrode surface modified by specific materials. Although the mechanism of glucose oxidation at the electrode surface is still not fully understood, a variety of materials including noble metals,6 metal oxides/hydroxides,7 carbon nanotubes,8 graphene,9 polymers, and hybrids10 have been explored and applied to NEG sensors.Among numerous materials, noble metal nanoparticles (NMNPs), such as Au, Ag, Pt, Pd, exhibit high electrocatalytic activities, long-term stability and good biocompatibility11,12 and therefore have been extensively explored as electrode materials for glucose oxidation. Furthermore, NMNPs display unique optical properties, especially for Au, Ag nanoparticles, which possess strong extinctions in the visible and NIR spectral region owing to localized surface plasmon resonances (LSPR).13,14 NMNPs can act as plasmon catalysts or photosensitizers by transferring some of the absorbed plasmonic energy through either resonant energy transfer or direct hot-electron injection to the reactants, thereby improving their own catalytic activities or performances of attached substrates.15–17 This light-enhanced activity has recently attracted great attention in solar harvesting field.18
Encouraged by the achievements based on plasmon enhanced catalytic activities, we hereby propose a novel sensing platform that can utilize LSPR to enhance the glucose oxidation and thus to improve the sensitivity of the glucose sensor. The platform consists of Au nanorods (Au NRs)-modified Ni foam (Au NRs/Ni). Au NRs were employed as plasmon catalysts due to their aspect ratio-dependent LSPR responses and well-developed synthesis method.19 Ni foam was chosen as the support for the Au NRs due to its high conductivity, unique three dimensional network structure, large loading amount of active materials and low price.20,21 In addition, Ni foam can directly act as a sensing platform for glucose detection in alkaline solution, which is mediated by Ni(II)/Ni(III) redox couple.22 At first, using this nanoplatform, we investigated its electrochemical sensing of glucose in the absence of plasmon excitation by cyclic voltammetry and chronoamperometry. Significantly enhanced electro-catalytic performance has been observed using the Au NRs/Ni electrode for glucose oxidation. And it shows higher sensitivity and broader linear range than the Ni foam electrode. Upon plasmon excitation with simulated sunlight irradiation, light-enhanced electrochemical sensing of glucose is exhibited, indicating the feasibility of further improvements in sensitivity, dynamic range, and detection limit and highlighting the potential applications of plasmon effects for electrochemical sensing.
Experimental
Materials
Sodium borohydride (NaBH4), cetyltrimethylammonium bromide (CTAB), chlorauric acid (HAuCl4·3H2O), silver nitrate (AgNO3), and L-ascorbic acid (AA) were purchased from Alfa Aesar and used as received. Ni foams (110 PPI, 320 g m−2, 1 mm in thickness) were purchased from Changsha Lyrun New Material Co. Ltd., China. Other reagents and chemicals were at least analytical reagent grade and purchased from Beijing Chemical Reagent Company (Beijing, China). Milli-Q water (18 MΩ cm) was used for all solution preparations.Instruments
UV-vis-NIR absorption spectra were recorded on a Hitachi U-4100. X-ray diffraction (XRD) patterns were acquired using a Rigaku MiniFlex X-ray diffractometer equipped with Cu Kα radiation source operated at 50 kV/300 mA. Transmission electron microscopy (TEM) and scanning electron microscopy (SEM) images were obtained with a TecnaiG2 20 S-TWIN operating at an acceleration voltage of 200 kV and a Hitachi S-4800 equipped with energy dispersive spectroscopy (EDS) operating at an acceleration voltage of 10 kV, respectively. Electrochemical measurements were performed on a CHI 650 electrochemical analyzer (Shanghai, China).Synthesis of Au NRs
Au NRs were synthesized through the seed-mediated growth method. CTAB-capped Au seeds were prepared as follows: 7.5 mL of 0.1 M CTAB solution was mixed with 100 μL of 25 mM HAuCl4 and deionized water to 9.4 mL. Then, ice-cold NaBH4 (0.6 mL, 0.01 M) was added under vigorous stirring. The seed solution was then kept at room temperature and used within 2–5 h. Then, Au NRs were synthesized by reduction of HAuCl4 with AA on Au seeds: 120 μL seed solution was added to the growth solution consisted of CTAB (100 mL, 0.1 M), HAuCl4 (2 mL, 25 mM), AgNO3 (1.05 mL, 10 mM), and AA (552 μL, 0.1 M) to initiate the growth. The resultant reaction solution was gently mixed by inversion and then left undisturbed. After 12 h, AA (0.1 M, 55.2 μL) was added twice with 40 min interval. After about 3 h, the Au NRs were separated from the growth solution by centrifugation (12![[thin space (1/6-em)]](https://www.rsc.org/images/entities/char_2009.gif) 000 rpm for 5 min) twice. The precipitation was collected and redispersed in 20 mL of deionized water.
000 rpm for 5 min) twice. The precipitation was collected and redispersed in 20 mL of deionized water.
Preparation of Au NRs/Ni foam electrode
1 cm × 1 cm × 1 mm Ni foam was washed with acetone, etched in 0.1 M HCl for 1 h to remove the thin layer of oxide, and rinsed with ultrapure water prior to use. For the modification of the electrode, 200 μL of the synthesized Au NRs (0.39 μmol Au atoms, calculated by Fig. S1†) was added onto the Ni foam surface. The electrode was then dried under infrared lamp.Preparation of Au NRs/glassy carbon electrode (GCE)
GCE (Φ = 4 mm) was polished with 1.0, 0.3, and 0.05 μm α-alumina powders in sequence, and rinsed thoroughly with deionized water between each polishing step, then sonicated in 1![[thin space (1/6-em)]](https://www.rsc.org/images/entities/char_2009.gif) :
:![[thin space (1/6-em)]](https://www.rsc.org/images/entities/char_2009.gif) 1 HNO3/ethanol and deionized water, and dried at room temperature prior to modification. A volume of 7.5 μL of Nafion (5% v/v, in alcohol) was mixed with 100 μL of the synthesized Au NRs, then 7 μL of the resulting solution was applied to the GCE and allowed to dry for 1 h.
1 HNO3/ethanol and deionized water, and dried at room temperature prior to modification. A volume of 7.5 μL of Nafion (5% v/v, in alcohol) was mixed with 100 μL of the synthesized Au NRs, then 7 μL of the resulting solution was applied to the GCE and allowed to dry for 1 h.
Electrochemical measurements
All of electrochemical analyses were carried out with a three electrode system, in which a platinum wire and a Ag/AgCl (sat. KCl) electrode were used for counter electrode and reference electrode, respectively. Ni foam, Au NRs/Ni foam, and Au NRs/GCE act as the working electrode. All electrochemical measurements were performed on a CHI 650 electrochemical analyzer (Shanghai, China) at ambient temperature. The scan rate range in cyclic voltammetry (CV) was 0.001 V s−1 to 1 V s−1. The optimal working potential was set to +0.600 V for measurements of glucose. CV measurements were performed in a glucose concentration range of 0–5 mM. Current densities were normalized to the geometrical area of the working electrode. All potentials were referred to the reference electrode unless specified.Results and discussion
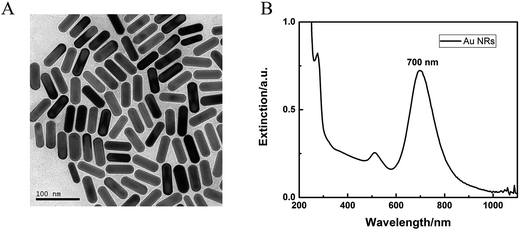
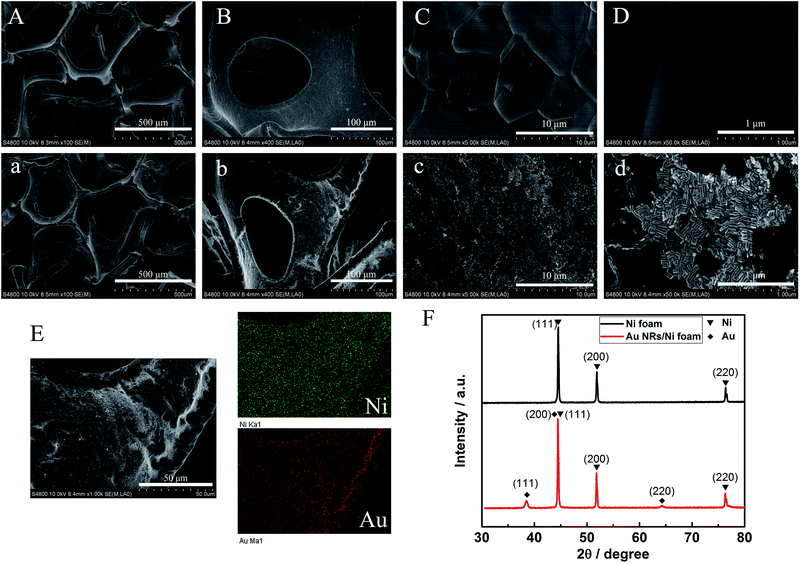
The synthesis of Au NRs was simple and efficient through the seed-mediated growth method.19 The obtained Au NRs were characterized by TEM and UV-vis-NIR extinction spectra. As shown in Fig. 1, their longitudinal SPR peaks were located at 700 nm, and the size distributions were narrow as determined from the TEM images, with an average length of 43.1 nm and average width of 15.1 nm (Table S1†). SEM images for the Ni foam substrate at various magnifications are shown in Fig. 2A–D, displaying a 3D, highly porous and cross-linked structure. Fig. 2a–d show the SEM images after the obtained Au NRs were concentrated and deposited onto the pretreated Ni foam. It can be seen through Fig. 2C and c that the Ni foam surface is covered with Au NRs. Comparing Fig. 2D with Fig. 2d, it is easily seen that the Au NRs deposition results in a significant morphology change of the Ni foam surface, demonstrating the efficient formation of Au NRs aggregates. The elemental analysis of the as-prepared samples was further performed using EDS. EDS element mappings of Au and Ni obtained from the SEM images of Au NRs/Ni foam is shown in Fig. 2E. The amount of Au NRs on the Ni foam can be controlled by varying the dropping amount or dropping times.The chemical composition and crystal phase of the samples were further examined by XRD analysis. The Ni foam shows three sharp diffraction peaks at 2θ = 44.5°, 51.8°, and 76.3° (Fig. 2F, black line), which match (111), (200) and (220) planes of the face centered cubic (fcc) phase of Ni metal (JCPDS card no. 65-2865), respectively. After modification with Au NRs, new diffraction peaks appearing in the XRD pattern (Fig. 2F, red line) at 2θ = 38.2° and 64.5°, which can be well indexed to the (111) and (220) planes of fcc Au (JCPDS card no. 65-2870). In addition, the fcc Ni (111) peak almost overlaps with the fcc Au (200) peak. The above XRD results demonstrate that the Au NRs were modified on the Ni foam surface. The resulting electrode was then characterized by cyclic voltammetry (CV) in detail.
For evaluating the electrochemical properties of Au NRs modified Ni foam electrode, cyclic voltammograms of the nickel foam substrate, Au NRs/GCE and Au NRs/Ni foam electrode were carried out in 0.1 M KOH at a scan rate of 100 mV s−1 (Fig. 3). The CVs are similar to those reported in the literature for Ni and Au electrode in alkaline solution.23,24 As can be seen, four redox peaks, A/B, a/b, C/D, and c/d are present. The a/b couple is due to the Ni(II)/Ni(III) redox couple, the same to the A/B couple. While C/D and c/d process is related to gold oxide formation and subsequent reduction to Au0.25 The voltammetric profile of the modified electrode is the weighted sum of the electrochemical behaviours of Au and Ni catalyst. In addition, the Au–Ni composite electrode exhibits good stability in alkaline solutions (Fig. S2†), possibly due to the electrostatic binding between the positively charged Au NRs and negatively charged Ni foam surface.26 Moreover, the current density for the oxidation/reduction of Au NRs/Ni foam electrode is higher than that of Ni foam substrate.
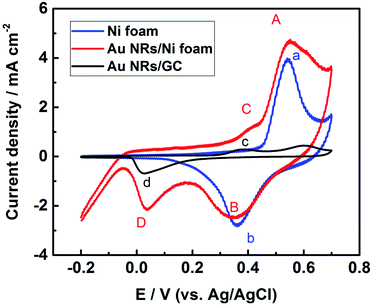 | ||
| Fig. 3 Cyclic voltammograms of the nickel foam substrate, the Au NRs/Ni foam electrode, and the Au NRs/GCE measured in 0.1 M KOH at a scan rate of 100 mV s−1. | ||
The electrochemical behaviors of glucose oxidation were investigated by CV. Fig. 4A and B and S3† display the CVs over a voltage range from −0.2 to 0.7 V for the nickel foam substrate, Au NRs/Ni foam electrode, and Au NRs/GCE in 0.1 M KOH solution with different glucose concentrations at a sweep rate of 100 mV s−1. As Fig. 4A shows, one redox peak is observed at the Ni foam due to the glucose oxidation and reduction mediated by Ni(II)/Ni(III) redox couple. The oxidation currents at 0.4–0.6 V increase gradually with the introduction of glucose from 0 to 1 mM, indicating the electrochemical oxidation of glucose, but the currents gradually become saturated from 1 to 5 mM. Fig. S3† and 4B shows the CVs for Au NRs/GCE and Au NRs/Ni foam electrode with different glucose concentrations. They exhibit some common properties. In the positive potential scan two oxidation peaks appear both in Fig. S3† and 4B at about +0.45 V (peak A) and +0.65 V (peak B), peak A is due to the direct electrochemical oxidation of glucose by the electroactive species of Au(OH)ads and peak B is attributed to the further oxidation of gluconolactone generated from glucose oxidation (peak A). While during the reverse scan a single oxidation peak at about 0 V (peak C) is also observed both in Fig. S3† and 4B. As Fig. S3† and 4B show, the rate of oxidation increases greatly and a well-defined peak (peak C) is soon developed. The formation of peak C is due to the re-oxidation of glucose for it's in the same potential region as soon as the Au oxides are reduced.27 So peak C reflects the oxidation of glucose by Au oxides. In addition, the difference between Fig. S3† and 4B is that no glucose oxidation and reduction peaks mediated by Ni(II)/Ni(III) redox couple are found in Fig. S3.† Furthermore, the peak current for Au NRs/Ni foam electrode is higher than that of Ni foam substrate, and proportional to the glucose concentration up to 5 mM, since more electrons could be provided with a high content of reaction reagents during electrochemical oxidation for Au NRs/Ni foam electrode.
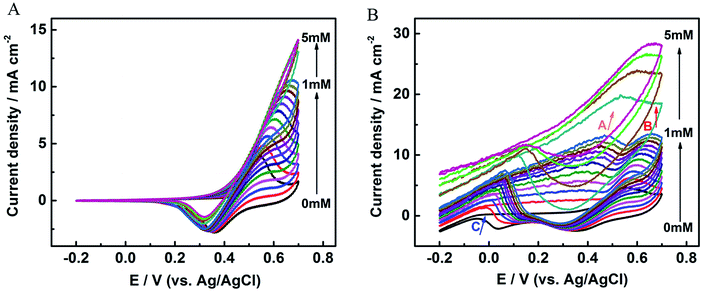 | ||
| Fig. 4 CV curves of (A) the nickel foam substrate and (B) the Au NRs/Ni foam electrode in a series of glucose concentration measured in 0.1 M KOH at a scan rate of 100 mV s−1. | ||
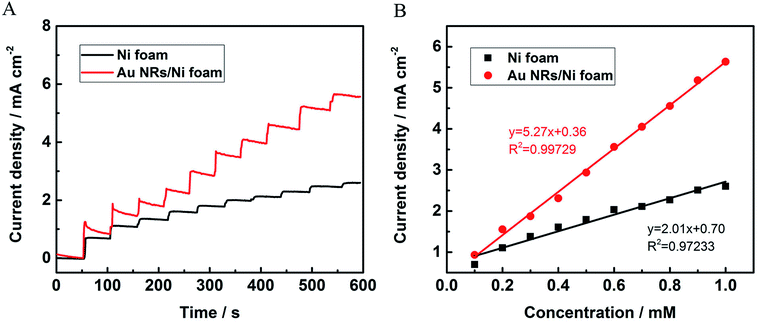
To further evaluate the sensitivity of the NEG sensor based on Au NRs/Ni foam electrocatalyst, the chronoamperometry is performed. Fig. 5A depicts the amperometric response curves of the nickel foam substrate and Au NRs/Ni foam electrode upon the successive addition of glucose at 0.6 V vs. Ag/AgCl electrode. The currents increase immediately with the increase of glucose concentrations, indicating the sensitive and rapid responses as a glucose monitor. And the Au NRs/Ni foam electrode shows larger current response toward glucose sensing than the nickel foam. Fig. 5B displays the linear relationship between the current density and the glucose concentrations. The sensitivity of the sensors could be calculated from the linear regression equations. The sensitivity of Au NRs/Ni foam is 5.27 mA mM−1 cm−2 for glucose detection, which is 2.62 times as high as the nickel foam (2.01 mA mM−1 cm−2). Table S2† summarizes the sensitivity of several typical NEG sensors with different electrodes reported previously. It should be noted that the Au NRs/Ni foam electrode possesses excellent sensitivity toward glucose detection among these electrodes. And the limit of detection can be calculated to be 14 μM for the Au NRs/Ni foam electrode based on the signal-to-noise ratio of 3 (S/N = 3). The excellent sensitivity of Au NRs/Ni foam can be attributed to the high electrocatalytic activity of Au NRs. Moreover, the well-distributed Au NRs on the surface of Ni foam favor the full access of single Au NR to glucose, which significantly enhances the electrochemical response toward glucose oxidation. The amperometric response curve of the Au NRs/GCE as control is shown in Fig. S4,† which indicates that no Ni foam as the substrate significantly decreased the sensitivity.
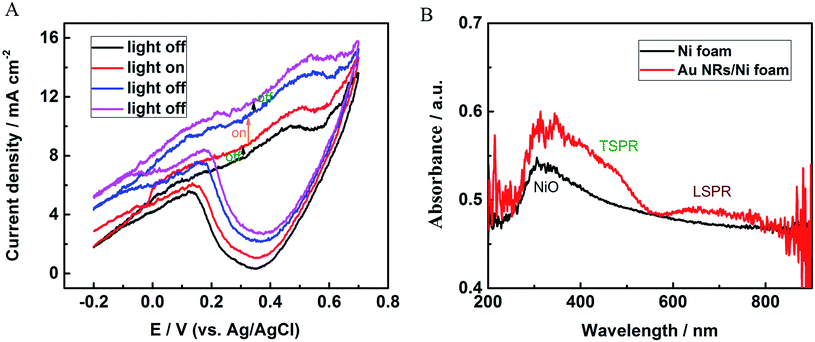
The photoelectrochemical properties of Au NRs/Ni foam electrode were studied under simulated sunlight irradiation at room temperature in 0.1 M KOH solution. Fig. 6A shows the CVs over a voltage range from −0.2 to 0.7 V for the Au NRs/Ni foam electrode with light on/off. The CV curves were measured upon successive addition of 0.1 mM glucose between every two scans. Light was turned on or off just before adding glucose. As can be seen, a clear increase in current change between two scans is observed when the light is switched on, and the current change immediately returned to its initial state after the light is turned off, suggesting the enhanced redox reactions on the sensor surface under sun light illumination. By statistics, the current change with light on is 1.77 times of the current change with light off, and the percentage of the photo-enhanced effect is about 44% in the total signal. The UV-vis-NIR spectra were measured to prove light absorption by Au NRs/Ni foam electrode. As Fig. 6B shows, Ni foam presents an absorption band at about 350 nm, which is ascribed to the absorption of NiO.28 In contrast, two additional broad absorption bands are found for the Au NRs/Ni foam between 500 and 700 nm, which correspond to the transverse and longitudinal SPR bands of the Au NRs, respectively. Band shifting and broadening are caused by the assembly of Au NRs on Ni foam. As the ultraviolet part of simulated sunlight irradiation is low, the effect of NiO absorption on light-enhanced electrochemical responses can be ignored. In contrast, plasmonic photocatalysis of the Au NRs is the main cause of improved photoelectrochemical responses for glucose. In addition, whether the Au NRs act as the photosensitizers and lead to extra photocurrent increase through transferring plasmonic energy to underneath Ni foam need further investigations. In all, our results show that the plasmonic effect has a great application potential in photoelectric sensors.
Conclusions
In summary, we successfully developed a non-enzymatic electrochemical glucose sensor by deposition of Au nanorods on Ni foam surface. The deposition of dense and well-dispersed Au NRs on the electrodes could significantly promote the electrocatalytic ability toward the oxidation of glucose during the electrochemical tests. The Au NRs/Ni foam shows better sensitivity among the reported glucose electrodes with 5.27 mA mM−1 cm−2 for glucose detection and provides larger linear dynamic range than Ni foam electrode. These results confirm that Au nanostructures could work as excellent electrode materials for the sensing of glucose. Furthermore, Au NRs/Ni foam shows absorptions in the visible spectrum due to the localized SPR, and thus can effectively enhance the glucose oxidation through light excitation of plasmonic bands and further improve the sensitivity. We believe that the proposed glucose sensor shows great promises for applications in practical glucose monitoring. And the plasmon enhanced electro-catalytic performance can also be extended to other reactions. Further research is in progress.Acknowledgements
This work was financially supported by the Key Program for International S&T Cooperation Projects of China (2016YFE0125700) and the Postdoctoral Application Research Project of Qingdao City.Notes and references
- Q. Wu, L. Wang, H. Yu, J. Wang and Z. Chen, Chem. Rev., 2011, 111, 7855 CrossRef CAS PubMed.
- K. E. Toghill and R. G. Compton, Int. J. Electrochem. Sci., 2010, 5, 1246 CAS.
- R. Wilson and A. P. F. Turner, Biosens. Bioelectron., 1992, 7, 165 CrossRef CAS.
- G. F. Wang, X. P. He, L. L. Wang, A. X. Gu, Y. Huang, B. Fang, B. Y. Geng and X. J. Zhang, Microchim. Acta, 2013, 180, 161 CrossRef CAS.
- S. Y. Tee, C. P. Teng and E. Ye, Mater. Sci. Eng. C, 2017, 70, 1018 CrossRef CAS PubMed.
- S. H. Kim, J. B. Choi, Q. N. Nguyen, J. M. Lee, S. Park, T. D. Chung and J. Y. Byun, Phys. Chem. Chem. Phys., 2013, 15, 5782 RSC.
- F. Huang, Y. Zhong, J. Chen, S. Li, Y. Li, F. Wang and S. Feng, Anal. Methods, 2013, 5, 3050 RSC.
- N. Q. Dung, D. Patil, H. Jung and D. Kim, Biosens. Bioelectron., 2013, 42280 Search PubMed.
- L. Luo, L. Zhu and Z. Wang, Bioelectrochemistry, 2012, 88, 156 CrossRef CAS PubMed.
- N. Hui, S. Wang, H. Xie, S. Xu, S. Niu and X. Luo, Sens. Actuators, B, 2015, 221, 606 CrossRef CAS.
- M. M. Biener, J. Biener, A. Wichmann, A. Wittstock, T. F. Baumann, M. Baumer and A. V. Hamza, Nano Lett., 2011, 11, 3085 CrossRef CAS PubMed.
- J. Biener, A. Wittstock, L. A. Zepeda-Ruiz, M. M. Biener, V. Zielasek, D. Kramer, R. N. Viswanath, J. Weissmuller, M. Baumer and A. V. Hamza, Nat. Mater., 2009, 8, 47 CrossRef CAS PubMed.
- C. J. Murphy, T. K. San and A. M. Gole, et al., J. Phys. Chem. B, 2005, 109, 13857 CrossRef CAS PubMed.
- Y. Xia, X. Xia and H. C. Peng, J. Am. Chem. Soc., 2015, 137, 7947 CrossRef CAS PubMed.
- Z. Zheng, T. Tachikawa and T. Majima, J. Am. Chem. Soc., 2015, 137, 948 CrossRef CAS PubMed.
- R. Jiang, F. Qin and Q. Ruan, et al., Adv. Funct. Mater., 2014, 24, 7328 CrossRef CAS.
- F. Wang, C. Li and H. Chen, et al., J. Am. Chem. Soc., 2013, 135, 5588 CrossRef CAS PubMed.
- R. B. Jiang, B. X. Li, C. H. Fang and J. F. Wang, Adv. Mater., 2014, 26, 5274 CrossRef CAS PubMed.
- N. R. Jana, L. Gearheart and C. J. Murphy, Adv. Mater., 2001, 13, 1389 CrossRef CAS.
- W. Q. Yang, S. H. Yang, W. Sun, G. Q. Sun and Q. Xin, Electrochim. Acta, 2006, 52, 9 CrossRef CAS.
- Y. L. Wang, Y. Q. Zhao, C. L. Xu, D. D. Zhao, M. W. Xu, Z. X. Su and H. L. Li, J. Power Sources, 2010, 195, 6496 CrossRef CAS.
- M. Fleischmann, K. Korinek and D. Pletcher, J. Electroanal. Chem. Interfacial Electrochem., 1971, 31, 39 CrossRef CAS.
- W. Visscher and E. Barendrecht, J. Electroanal. Chem., 1983, 154, 69 CrossRef CAS.
- M. Bektiwaska-Brzezinska, Electrochim. Acta, 1985, 30, 1193 CrossRef.
- S. Bruckenstein and M. Shay, J. Electroanal. Chem., 1985, 188, 131 CrossRef CAS.
- N. Hernández, R. Moreno, A. J. Sánchez-Herencia and J. L. G. Fierro, J. Phys. Chem. B, 2005, 109, 4470 CrossRef PubMed.
- I. G. Casella, M. R. Guascito and T. R. I. Cataldi, Anal. Chim. Acta, 1999, 398, 153 CrossRef CAS.
- F. Farzaneh and S. Haghshenas, Mater. Sci. Appl., 2012, 3, 697 CAS.
Footnote |
| † Electronic supplementary information (ESI) available. See DOI: 10.1039/c7ra06909j |
| This journal is © The Royal Society of Chemistry 2017 |

