 Open Access Article
Creative Commons Attribution 3.0 Unported Licence
The catalytic performances and reaction mechanism of nanoparticle Cd/Ce–Ti oxide catalysts for NH3-SCR reaction†
Zhichen Duana,
Kebin Chib,
Jian Liu *a,
Juan Shia,
Zhen Zhao
 a,
Yuechang Weia and
Weiyu Songa
aState Key Laboratory of Heavy Oil Processing, Beijing Key Lab of Oil & Gas Pollution Control, China University of Petroleum, 18# Fuxue Road, Chang Ping District, Beijing 102249, China. E-mail: liujian@cup.edu.cn; Fax: +86-10-69724721; Tel: +86-10-89732278
bPetrochemical Research Institute, Petro China Company Limited, Beijing 100195, China
First published on 27th October 2017
Abstract
Ce0.3–TiOx nanoparticle carrier was prepared by the sol–gel method, and a series of Cd–Ce–Ti nanoparticle catalysts with variable Cd contents were prepared by the means of an improved incipient-wetness impregnation. The catalysts were characterized by means of XRD, N2 adsorption–desorption analysis, SEM, TEM, NH3-TPD and in situ DRIFTS. The catalytic activities for deNOx were evaluated by NH3-SCR reaction. All these nanoparticle catalysts contain mesopores with a pore size around 7 nm, and the average particle size is 20 nm. Among the catalysts, 2 wt% Cd/Ce0.3TiOx catalyst exhibits the best NH3-SCR performance with a wide temperature window of 250–400 °C for NO conversion above 90%. Moreover, in situ DRIFTS spectra of NOx reduction over 2 wt% Cd/Ce0.3TiOx catalyst were also investigated. The results show that this reaction mainly follows the Langmuir–Hinshelwood mechanism at room temperature, while Eley–Rideal mechanism plays more important role when the reaction temperature is higher than 150 °C. The adsorbed NH3 coordinately linked to Lewis acid site is easy to react with NOx at high temperature.
1. Introduction
It is generally considered that the air pollution is predominantly from combustion processes of fossil fuels in power plants, vehicles and other incineration processes. Among various air contaminants, nitrogen oxides (NOx) are notable and known as major causes of photochemical smog, haze, acid rain, ozone depletion and the greenhouse effect.1,2 Selective catalytic reduction of NOx with NH3 (NH3-SCR) is a powerful technique for the abatement of NOx from stationary sources. WO3 (MoO3) modified V2O5/TiO2 are the current commercially used catalysts for NH3-SCR in industry.3–5 However, some disadvantages still exist in these catalyst systems, including high working temperature, toxicity of vanadium species and low N2 selectivity at high temperatures.6,7 Therefore, many researchers are trying to develop new NH3-SCR catalysts with high deNOx efficiency, high N2 selectivity, excellent hydrothermal stability and insensitivity to co-existing poisoning components in SCR atmosphere such as H2O, SO2 or alkali metals etc.8–10In recent years, Ce–Ti based catalysts for NH3-SCR reaction have been attracted much attention from researchers. This kind of catalyst indeed offers a number of advantages over V–Ti catalysts. They are active and selective in a wider temperature range, nontoxic, and high N2 selectivity even at high temperatures.11–14 The transition metal Cd, is belong to IIB elements, and has attracted attention in environmental catalysis, photocatalysis and hydrodesulfurization.15,16 However, there is lack to study for NOx reduction. By the incorporation of metal oxide Cd into the ceria lattice, it is beneficial to the formation of mixed oxides or solid solutions.
In this work, CdM/Ce0.3–TiOx nanoparticle catalysts were prepared by the incipient-wetness impregnation method with different Cd contents for improving the catalytic performances for the SCR of NO with NH3. Their physicochemical properties were investigated systematically.
2. Experimental
2.1 Catalyst preparation
Ce0.3–TiO2 nanoparticle carrier was prepared by the sol–gel method. All chemicals were of analytical grade. A solution of deionized water (2 ml), anhydrous ethanol (10 ml) and a certain amount of cerium nitrate were vigorously stirred at room temperature. The solution was added dropwise into the mixing solution of butyl titanate (10 g) and anhydrous ethanol (30 ml), and then a certain amount of hydrochloricacid was added to adjust pH until pH = 1. The obtained mixture was stirred for 4 h and placed at room temperature for about 2 days to form a gelatum. Then the gelatum was dried at 100 °C for 24 h and calcined at 500 °C for 4 h in air. The sample is denoted as Ce0.3TiOx, where the molar ratio of Ce and Ti is 0.3![[thin space (1/6-em)]](https://www.rsc.org/images/entities/char_2009.gif) :
:![[thin space (1/6-em)]](https://www.rsc.org/images/entities/char_2009.gif) 1.
1.
A series of CdM/Ce0.3TiOx (M = 1, 2, 3, 5, wt%) nanoparticle catalysts with fixed Ce/Ti molar ratio of 0.3 and fixed Cd loading amounts of M% were prepared by an improved incipient-wetness impregnation method. In a typical synthesis, the support of 5 g Ce0.3TiOx was preheated in a vacuum oven at 100 °C to remove the adsorbed water. Then an aqueous solution of Cd(CH3COO)2 was slowly added to the support at stirring with a glass rod under room temperature, and then ultrasonic treatment for 1 h. The precursor was dried at 100 °C for 12 h, and consequently calcined in air at 500 °C for 6 h. The final catalyst is labeled as CdM/Ce0.3TiOx (M = 1, 2, 3, 5, wt%).
2.2 Catalyst characterization
Powder XRD patterns were obtained by a powder X-ray diffractometer (Shimadzu XRD 6000) using Cu Kα (λ = 0.15406 nm) radiation with a Nickel filter and operating at 40 kV and 10 mA in the 2θ range of 5–70° at a scanning rate of 1°min−1.N2 adsorption–desorption isotherm was measured at 77 K using a Micromeritics TriStar II 2020 porosimetry analyzer. The samples were degassed at 300 °C for 8 h prior to the measurements. The specific surface areas were calculated according to the Brunauer–Emmett–Teller (BET) method.
The surface morphology of the catalyst was observed by field emission scanning electron microscopy (FESEM) on a Quanta 200F instrument using accelerating voltages of 5 kV, in combination with an EDAX genesis 4000 energy-dispersive X-ray spectrometer (EDX). TEM images were carried out using a JEOL JEM 2100 electron microscope equipped with a field emission source at an accelerating voltage of 200 kV.
Temperature-programmed desorption of ammonia (NH3-TPD) measurement was performed on a conventional flow apparatus. Prior to measurements, 100 mg of the sample was pretreated in N2 gas (60 cm3 min−1) at 500 °C for 0.5 h and then cooled down to room temperature. Next, the sample was exposed to a mixed gas (10 vol% NH3 and 90 vol% N2) flow of 30 cm3 min−1 for 0.5 h to ensure the sufficient adsorption of NH3. Before desorption, the sample was flushed in N2 gas for 1.5 h. Subsequently, NH3 desorption was performed in the range of 50–600 °C at a heating rate of 10 °C min−1 under a N2 flow of 30 cm3 min−1.
In situ DRIFTS were recorded using a thermo Nicolet IS50 spectrometer, which was equipped with a high temperature environmental cell fitted with Zn–Se window and an MCT detector cooled with liquid N2. The catalyst was loaded in the Harrick IR cell and heated to 400 °C under N2 at a total flow rate of 50 cm3 min−1 for 60 min to remove adsorbed impurities. A background spectrum was collected under a flowing N2 atmosphere and was subtracted from the sample spectra. The in situ DRIFTS spectra were recorded by accumulating 64 scans with a resolution of 4 cm−1.
2.3 Catalytic activity measurement
NH3-SCR activity measurements were carried out in a fixed bed quartz micro-reactor operating in a steady flow mode. 0.4 g of catalysts were sieved with 40–60 mesh and used in each test. The reactant gas included 1000 ppm NO, 1000 ppm NH3, 3% O2 and balance N2. The total flow rate was 500 cm3 min−1 and thus a GHSV of 45![[thin space (1/6-em)]](https://www.rsc.org/images/entities/char_2009.gif) 000 h−1 was obtained. The temperature varied from 100 to 500 °C, and heating rate was 3 °C min−1. The data was recorded when the temperature hold at each point for more than 5 min. The concentration of NOx (NOx = NO + NO2) in the inlet and outlet gas mixture was measured by a SIGNAL 4000 VM NOx analyzer. Meanwhile, the concentration of NH3, NO, NO2 and N2O were measured by a FTIR spectrometer (MKS, Multi Gas 2030HS).
000 h−1 was obtained. The temperature varied from 100 to 500 °C, and heating rate was 3 °C min−1. The data was recorded when the temperature hold at each point for more than 5 min. The concentration of NOx (NOx = NO + NO2) in the inlet and outlet gas mixture was measured by a SIGNAL 4000 VM NOx analyzer. Meanwhile, the concentration of NH3, NO, NO2 and N2O were measured by a FTIR spectrometer (MKS, Multi Gas 2030HS).
NO conversion and N2 selectivity are calculated in the following eqn (1) and (2).
 | (1) |
 | (2) |
3. Results and discussion
3.1 XRD results
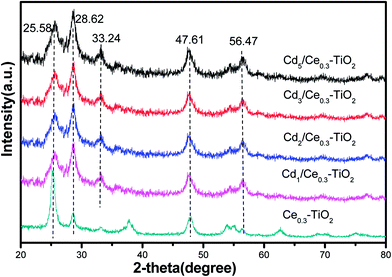
XRD was employed to analyze the phase structure of all the catalysts. Fig. 1 shows the XRD patterns of CdM/Ce0.3–TiOx mixed-oxide catalysts. Crystalline phases were identified by comparison with ICDD files (anatase TiO2, 21-1272; CeO2, 34-0394). Among them, titanium oxide was a dominating phase. As shown in Fig. 1, the diffraction peaks at 25.58°, 28.62°, 47.61°, 56.47°, are ascribed to the characteristic reflections of anatase TiO2. There is no peak at 27.5° in the samples, which indicates that there is no rutile titania existing in all samples.17,18 Moreover, there is a characteristic peak assigned to Cd oxide (peak at 33.24°).19 This indicates that Cd oxides are dispersed over Ce0.3TiOx support for CdM/Ce0.3–TiOx samples.3.2 N2 adsorption–desorption results
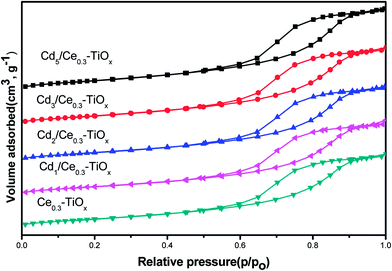
BET surface areas and structural parameters of CdM/Ce0.3–TiOx catalysts were measured by N2 adsorption–desorption. Table 1 summarizes the surface area (SBET), pore volume (Vp), and pore diameter (dp) of different samples, calculated by the BJH method based on the N2 adsorption–desorption isotherms. It is clear that Ce0.3–TiOx exhibits the lowest SBET values about 45.8 m2 g−1, while all CdM/Ce0.3–TiOx exhibit the higher SBET values about 56.9–69.0 m2 g−1. It may be due to an interaction between Ce0.3–TiOx and CH3COO– ions. In the process of impregnation, Cd(CH3COO)2 was used. The pore wall of the support Ce0.3–TiOx was acid corrosion by CH3COO– ions and the pore volume of the catalysts was enlarged. Thus, CdM/Ce0.3–TiOx exhibits the higher SBET values. BET surface area decreases when Cd contents increase. It may be due to excess Cd blocking the pores of the catalysts with the increasing of Cd contents. N2 adsorption–desorption result also shows that all samples contain mesopores with a relatively uniform pore size around 7 nm. Meanwhile, the isotherm curves of CdM/Ce0.3–TiOx catalysts show typical H1 hysteresis loop (Fig. 2). It indicates the mesoporous structure of the mixed oxide.20 The pore size distribution is concentrated. There is no additional pore-forming material was used in the process of catalyst preparation. Thus, the mesoporous structure may be produced by the aggregation of nanoparticles.3.3 SEM results
The microstructure of all catalysts was further investigated by SEM. In Fig. 3a, Ce0.3–TiOx sample is composed of irregularly localized and distinct edged particles within the regular geometry (nanoparticles). The images in Fig. 3b–e show the agglomeration degree of catalysts varies with different Cd loading amounts. There is no obvious effect on the catalyst morphology when Cd content is low. However, when the loading amount is more than 3 wt%, the catalyst surface agglomeration becomes slightly clear.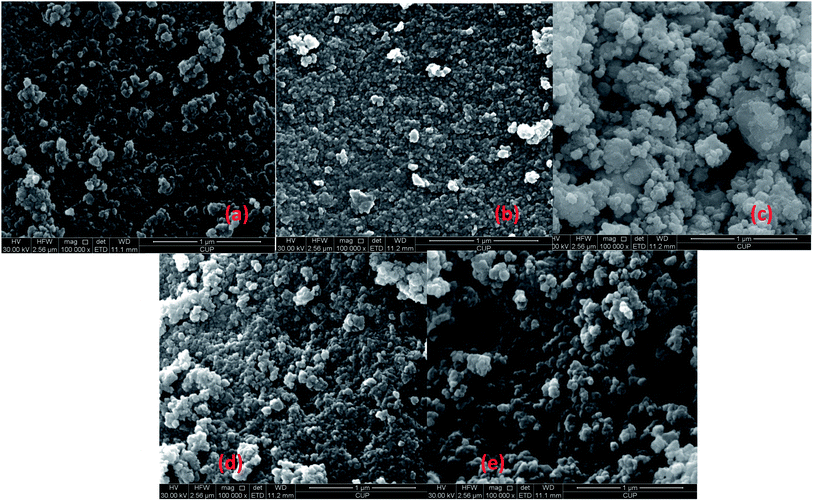 | ||
| Fig. 3 SEM images of different catalysts: (a) Ce0.3–TiOx, (b) Cd1/Ce0.3–TiOx (c) Cd2/Ce0.3–TiOx (d) Cd3/Ce0.3–TiOx (e) Cd5/Ce0.3–TiOx. | ||
3.4 TEM results
TEM image of Cd2/Ce0.3–TiOx nanoparticle catalyst is shown in Fig. 4. The lattice fringe, which is marked as 0.35 nm in the HRTEM image of Cd2/Ce0.3–TiOx, belongs to (101) planes of anatase TiO2.20,21 The lattice fringe, which is marked as 0.32 nm in the HRTEM image of Ce0.3–TiO2, belongs to (111) planes of CeO2. CdM/Ce0.3–TiOx nanocomposites show a uniform distribution and small particle sizes. The mean diameters were analyzed by statistical analysis of more than 100 particles in TEM images. The average particle size is 20 nm for CdM/Ce0.3–TiOx catalysts. The sample displays a uniform distribution of particle sizes.3.5 NH3-TPD results
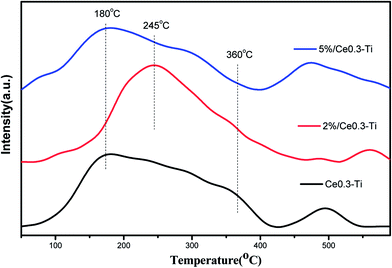
Temperature-programmed desorption of ammonia was carried out to determine the strength and amount of different acid sites. NH3-TPD patterns of CdM/Ce0.3–TiOx catalysts are depicted in Fig. 5. All catalysts show two shoulder peaks in the ranged 140–360 °C and 450–600 °C, respectively. The ammonia desorbed at low temperatures is ascribed to the weak acidic sites, which is corresponding to the partially ionic NH4+ bound to Brønsted acid sites. And the ammonia desorbed at high temperature was ascribed to the desorption of co-ordinated NH3 bound Lewis acid sites.6,22,23Furthermore, the intensity and the area of NH3 desorption over Cd2/Ce0.3–TiOx is higher than the other catalyst. The comparison of the area of the desorbed NH3 over Ce0.3–TiOx, Cd2/Ce0.3–TiOx and Cd5/Ce0.3–TiOx catalysts is 1![[thin space (1/6-em)]](https://www.rsc.org/images/entities/char_2009.gif) :
:![[thin space (1/6-em)]](https://www.rsc.org/images/entities/char_2009.gif) 1.06
1.06![[thin space (1/6-em)]](https://www.rsc.org/images/entities/char_2009.gif) :
:![[thin space (1/6-em)]](https://www.rsc.org/images/entities/char_2009.gif) 0.87. The ammonia adsorption ability of the catalyst is generally considered as one of the most important criteria for the screening of catalytic systems for the NH3-SCR.6,22,23 As was shown in Fig. 5, Cd2/Ce0.3–TiOx catalyst showed more desorbed ammonia at low temperature. It seems that the proper content of Cd catalyst possesses more weak acidic sites. Thus, the improvement in ammonia adsorption over Cd2/Ce0.3–TiOx catalyst is believed to be significantly beneficial to the NOx reduction by ammonia.
0.87. The ammonia adsorption ability of the catalyst is generally considered as one of the most important criteria for the screening of catalytic systems for the NH3-SCR.6,22,23 As was shown in Fig. 5, Cd2/Ce0.3–TiOx catalyst showed more desorbed ammonia at low temperature. It seems that the proper content of Cd catalyst possesses more weak acidic sites. Thus, the improvement in ammonia adsorption over Cd2/Ce0.3–TiOx catalyst is believed to be significantly beneficial to the NOx reduction by ammonia.
3.6 NH3-SCR activities
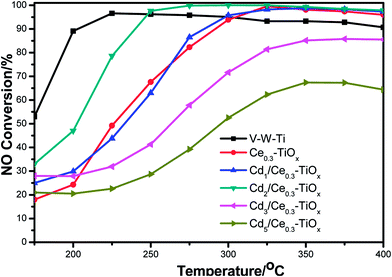
Fig. 6 shows the results of NO conversion in NH3-SCR reaction over CdM/Ce0.3–TiOx catalysts in the temperature range of 175–400 °C, and Fig. 7 shows the N2 selectivity of Cd2/Ce0.3–TiOx catalysts in the temperature range of 175–400 °C. And a commercial V2O5/WO3/TiO2 catalyst was used as a ref. 6, 24 and 25. When appropriate amounts of Cd are loaded to Ce0.3–TiOx, a significant influence on catalytic activity is observed. The temperature range for optimum NO reduction (>90%) extends toward wider temperature window. Among all the catalysts tested in this study, Cd2/Ce0.3–TiOx catalyst exhibits the widest temperature window of catalytic activity for the removal of NO. The highest temperature to maintain NO conversion of 90% is 400 °C. For Cd2/Ce0.3–TiOx catalyst, the temperature range is between 250 °C and 400 °C for NO removal above 90%. Meanwhile, the large amounts of Cd addition (3 wt% and 5 wt%) lead to a decreasing activity, which may be due to the occurrence of unselective oxidation of NH3. The catalytic performances of Cd1/Ce0.3–TiOx catalyst and Cd2/Ce0.3–TiOx catalyst are very similar in the temperature range between 325 and 400 °C. However, the catalytic behaviours of CdM/Ce0.3–TiOx catalysts are associated with the amount of Cd addition in the whole temperature range.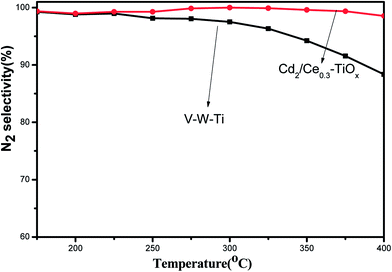 | ||
| Fig. 7 N2 selectivity as a function of reaction temperature over Cd2/Ce0.3–TiOx and V–W–Ti catalysts. | ||
Cd2/Ce0.3–TiOx exhibits the highest catalytic activity among CdM/Ce0.3–TiOx catalysts. In the temperature range of 250–400 °C, NOx conversion exceeds 90%, which is better than the commercial V–W–Ti catalyst. More remarkably, N2 selectivity is kept above 96% in the range of 175–400 °C, while the N2 selectivity of V–W–Ti catalyst is 87% at 400 °C.
Cd belongs to IIB elements and its main valence state is Cd2+. Similar to TiO2, Cd has also exhibited very high photocatalytic activity.15,16 It may indicate that there is the strong interaction a synergistic effect between Cd and TiOx. And a proper content of Cd promotes the catalytic activity of CdM/Ce0.3–TiOx catalyst for NH3-SCR reaction. The NO conversion in NH3-SCR reaction show that 2 wt% Cd/Ce0.3–TiOx is the better than other samples. It may be due to more uniformly catalyst particles, bigger surface area and excellent physicochemical properties.
Furthermore, it should be noted that the NO conversion decreased at 400 °C or higher temperature and the NO conversion decreases with the increasing of the reaction temperature due to the more unselective oxidation of NH3.
3.7 In situ DRIFTS results over Cd2/Ce0.3–TiOx catalyst
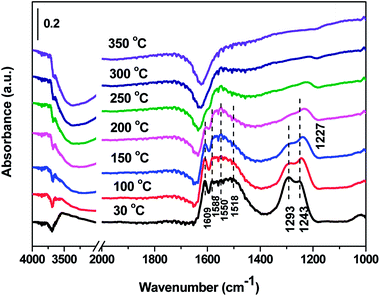
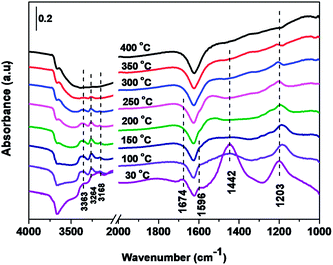 | ||
| Fig. 12 In situ DRIFTS spectra of Cd2/Ce0.3–TiOx catalyst in a flowing of 1000 ppm NH3 + 1000 ppm NO + 3% O2 at 30, 100, 150, 200, 250, 300, 350 and 400 °C. | ||
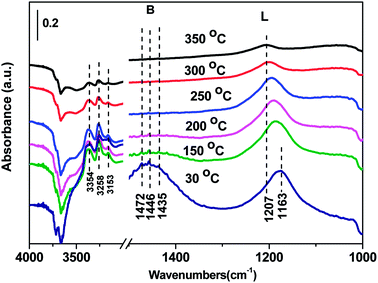
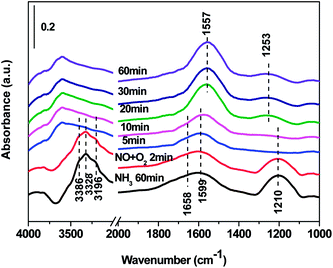
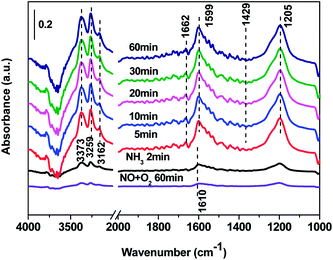
In situ DRIFTS spectra over Cd2/Ce0.3–TiOx catalyst show that there is the adsorbed NH3 species on both Lewis and Brønsted acid site, and the absorbed nitrate and nitrite species form on the surface of catalyst at room temperature. While when the temperature exceeds 150 °C, all bands attributed to NOx and NH3 species vanish gradually except the bands attributed to adsorbed NH3 species on Lewis acid site.
On the one hand, ammonia and nitrogen oxides were adsorbed in low temperature, NH bond in NH4+ chemisorbed on acid sites and the bands attributed to NOx species are obvious. The reaction between adsorbed NOx and adsorbed ammonia is related to the L–H mechanism. On the other hand, the absorbed nitrate and nitrite species were decomposed at the high temperature, and the absorbed ammonia decreased slowly. The reaction between adsorbed ammonia and NO2 or NO from the gas phase is corresponding to E–R-oriented mechanism. Thus the in situ DRIFTS spectra of Cd2/Ce0.3–TiOx catalyst show that, the main L–H mechanism may gradually transform to E–R-oriented mechanism with the increasing of the temperature.26–32
4. Conclusion
Ce0.3–TiOx nanoparticle carrier was prepared by the sol–gel method, and a series of Cd–Ce–Ti nanoparticle catalysts with variable Cd contents were prepared by the means of an improved incipient-wetness impregnation. The loading amount of Cd in the catalysts affects the NH3-SCR catalytic activity and physicochemical properties. SEM, TEM and N2 adsorption–desorption results show that the catalyst particle distributes uniformly and all catalysts contain the mesoporous structure from overlapped nanoparticles.The NH3-TPD results indicate that the intensity and the area of NH3 desorption over Cd2/Ce0.3–TiOx is higher than the other catalyst. The improvement in ammonia adsorption over Cd2/Ce0.3–TiOx catalyst is beneficial to the NOx reduction by ammonia. Among all the catalysts, Cd2/Ce0.3–TiOx catalyst exhibits the widest temperature window for the removal of NO and the temperature range is between 250 and 400 °C for NO removal above 95%, and the N2 selectivity is kept above 96% in the full temperature range.
In situ DRIFTS spectra over Cd2/Ce0.3–TiOx catalyst show that when the temperature exceeds 150 °C, the adsorbed NH3 species on Lewis acid sites play more important role than those on Brønsted acid sites. With the increasing of the temperature, the main L–H mechanism may gradually transform to E–R-oriented mechanism.
Conflicts of interest
There are no conflicts to declare.Acknowledgements
This work was financially supported by the National Natural Science Foundation of China (21673290, u1162103 and 21376261), the National Hi-Tech Research and Development Program (863) of China (2015AA034603), and the China Offshore Oil Fund (LHYJYKJSA2016002).References
- M. G. Schultz, T. Diehl, G. P. Brasseur and W. Zittel, Science, 2003, 302, 624 CrossRef CAS PubMed.
- Q. Liang, Z. Zhao, J. Liu, Y. Wei, G. Jiangand and A. Duan, Acta Phys.-Chim. Sin., 2014, 30, 129 CAS.
- A. Tomita, T. Yoshii, S. Teranishi, M. Nagao and T. Hibino, J. Catal., 2007, 247, 137 CrossRef CAS.
- X. Zhao, L. Huang, H. Li, H. Hu, J. Han, L. Shi and D. Zhang, Chin. J. Catal., 2015, 36, 1886 CrossRef CAS.
- K. Zhao, W. Han, Z. Tang, G. Zhang, J. Lu, G. Lu and X. Zhen, Colloids Surf., A, 2016, 503, 53 CrossRef CAS.
- K. Cheng, J. Liu, Z. Zhao, Y. Wei, G. Jiang and A. Duan, RSC Adv., 2015, 5, 45172 RSC.
- H. He, F. Liu, Y. Yu and W. Shan, Sci. China: Chem., 2012, 42, 442 Search PubMed.
- P. R. Ettireddy, N. Ettireddy, S. Mamedov, P. Boolchand and P. Smimiotis, Appl. Catal., B, 2007, 76, 123 CrossRef CAS.
- J. Huang, Z. Tong, Y. Huang, Y. Huang and J. Zhang, Appl. Catal., B, 2008, 78, 309 CrossRef CAS.
- S. Bai, W. Lu, D. Li, X. Li, Y. Fang and L. Yuan, Acta Phys.-Chim. Sin., 2014, 30, 1107 CAS.
- Z. Liu, S. Zhang and J. Li, Appl. Catal., B, 2014, 158, 11 CrossRef.
- W. Shan, F. Liu, H. He, C. Deng and X. Zi, Catal. Commun., 2014, 59, 226 CrossRef.
- C. Xu, J. Liu, Z. Zhao, F. Yu, K. Cheng, Y. Wei, A. Duan and G. Jiang, J. Environ. Sci., 2015, 31, 74 CrossRef PubMed.
- R. Wang, L. Lan, M. Gong and Y. Chen, Acta Phys.-Chim. Sin., 2016, 32, 1747 CAS.
- X. Lu, D. Zheng, J. Gan, Z. Liu, C. Liang, P. Liu and Y. Tong, J. Mater. Chem., 2010, 20, 9 Search PubMed.
- R. Yang, D. Wang, L. Wan and D. Wang, RSC Adv., 2014, 4, 22162 RSC.
- W. Wang, S. Wang, X. Ma and J. Gong, Catal. Today, 2009, 148, 323 CrossRef CAS.
- P. Li, Y. Xin, Q. Li, Z. Wang, Z. Zhang and L. Zheng, Environ. Sci. Technol., 2012, 46, 9600 CrossRef CAS PubMed.
- G. Zhao, Y. Yang and T. Ren, Acta Pet. Sin., 2006, 22, 308 CAS.
- G. Leofanti, M. Padovan, G. Tozzola and B. Venturelli, Catal. Today, 1998, 41, 207 CrossRef CAS.
- H. Wang, S. Cao, F. Zheng, F. Yu, Y. Liu, X. Wei and Z. Wu, Appl. Surf. Sci., 2015, 330, 245 CrossRef CAS.
- L. Chen, J. Li, M. Ge and R. Zhu, Catal. Today, 2010, 153(3), 77–83 CrossRef CAS.
- K. J. Lee, P. A. Kumar, M. S. Maqbool, K. N. Rao, K. H. Song and H. P. Ha, Appl. Catal., B, 2013, 142, 705 CrossRef.
- A. A. Markeb, L. A. Ordosgoitia, A. Alonso, A. Sánchez and X. Font, RSC Adv., 2016, 6, 56913 RSC.
- C. Tang, H. Zhang and L. Dong, Catal. Sci. Technol., 2015, 6, 1248 Search PubMed.
- Z. Liu, S. Zhang, J. Li and L. Ma, Appl. Catal., B, 2014, 144, 90 CrossRef CAS.
- R. Long and R. Yang, J. Catal., 2000, 190, 22 CrossRef CAS.
- G. Ramis, L. Yi and G. Busca, J. Catal., 1995, 157, 523 CrossRef CAS.
- F. Liu, H. He, Y. Ding and C. Zhang, Appl. Catal., B, 2009, 93, 194 CrossRef CAS.
- D. A. Peña, B. S. Uphade and P. G. Smirniotis, J. Catal., 2004, 221, 421 CrossRef.
- Y. Li, Y. Li, Y. Wan, S. Zhan, Q. Guan and Y. Tian, RSC Adv., 2016, 6, 54926 RSC.
- S. Xiong, Y. Liao, H. Dang, F. Qi and S. Yang, RSC Adv., 2015, 5, 27785 RSC.
Footnote |
| † Electronic supplementary information (ESI) available. See DOI: 10.1039/c7ra06931f |
| This journal is © The Royal Society of Chemistry 2017 |

