 Open Access Article
Creative Commons Attribution 3.0 Unported Licence
Transmembrane oligomeric intermediates of pore forming toxin Cytolysin A determine leakage kinetics†
Ayush Agrawala,
K. Apoorvab and
K. G. Ayappa *ac
*ac
aDepartment of Chemical Engineering, Indian Institute of Science, Bangalore-560012, India. E-mail: ayappa@iisc.ac.in
bDepartment of Chemical Engineering, Indian Institute of Technology, Hyderabad-502205, India
cCentre for Biosystems Science and Engineering, Indian Institute of Science, Bangalore-560012, India
First published on 7th November 2017
Abstract
Calcein leakage experiments for the α pore forming toxin Cytolysin A (ClyA) are carried out using a suspension of small unilamellar vesicles made up of 1,2-dipalmitoyl-sn-glycero-3-phosphocholine (DPPC) and cholesterol. Combining the oligomerization kinetics with a Poisson process to describe the inherent stochasticity underlying pore formation, we screen possible oligomerization pathways by comparing model predictions with calcein leakage data for ClyA. Excellent agreement with the leakage data was obtained for a reversible sequential oligomerization mechanism upon inclusion of leakage from membrane inserted partially oligomerized intermediates or ‘arcs’. In contrast, the non-sequential mechanisms were unable to predict the calcein leakage data. Reversibility in the oligomerization mechanism maintains a constant supply of protomers resulting in a broad distribution of oligomers at steady state. Additionally, the time scale for the conformational change from the water soluble monomer to the membrane bound protomer was found to be similar or larger than the time scale for oligomerization. The dominant contribution to leakage was found to occur from the smaller arcs, consistent with the low protein to lipid ratios used in the experiment. Our kinetic model is able to capture both the fast and slow time constants typically observed in calcein leakage experiments. A key inference is that arcs play a critical role in the leakage kinetics of ClyA, with the fast leakage time scale arising from the smaller oligomerized intermediates and the longer time scale arising from the slowly forming higher order oligomers.
1 Introduction
Pore forming toxins (PFTs) are specific proteins expressed by a wide variety of organisms which attack target cells by rapid and unregulated pore formation. In addition to determining the crystal structure of the pore complex and conformational changes that accompany binding and pore formation, there is substantial interest in unraveling the kinetics and oligomerization pathways for these toxins. A knowledge of pore formation kinetics and oligomerization pathways could potentially help in developing intervention strategies to prevent pore formation, mitigate PFT mediated infections as well as use PFTs for technological applications such as DNA sequencing.1The pre-pore and growing pore models are the two main pore forming paradigms that have been proposed for pore assembly pathways.2 In the pre-pore model a fully assembled pore or oligomer assembles on the membrane interface and converts to form a functional membrane inserted pore complex. Several β toxins such as listeriolysin O (LLO), lysenin, α-hemolysin and perfringolysin3 are known to form a pre-pore complex, verified by monitoring changes in height along the bilayer normal using atomic force microscopy (AFM).4 More recently high speed AFM with sub-second scanning time reveal the kinetics of these changes.5 In the growing pore model, membrane inserted intermediates known as ‘arcs’ devoid of lipid in the inner lumen undergo oligomerization to form the pore complex. These arcs can initiate lysis or leakage during the oligomerization process en route to forming the complete pore complex. Presence of arcs naturally raises the question of how arcs are formed. In one scenario arcs can form due to the oligomerization of membrane inserted protomers. Arcs if stable, would be capable of leakage due to their membrane inserted state. In an alternate scenario arcs can be formed by a ‘pre-arc’ state wherein the oligomeric intermediate first assembles on the membrane interface and subsequently undergoes an insertion to create a functional arc. Inserted arcs as well as pre-arcs at different stages of oligomerization have been observed in high AFM images of LLO.4,6–8 Since arcs are oligomerization intermediates their population on the membrane surface could in principle be modulated by the surface concentration of bound protein. It has been indicated that arcs are more likely to occur at low toxin concentration.9
Although detailed models for oligomerization kinetics of β-toxins are yet to appear in the literature, structural data gleaned from AFM images suggest a variety of intermediates that could play a role during pore formation. The situation is less certain when once considers α-toxins which is the subject of this manuscript. In contrast to β-toxins which benefit from the increased stability imparted by interstrand hydrogen bonding in the membrane inserted β-barrel, α-toxins form pores with an assembly of amphiphatic α-helices. As a consequence there have been fewer crystal structures determined for the α-toxins. The crystal structure of Cytolysin A (ClyA) expressed by E. coli, has been recently elucidated and a pore formation pathway based on the pre-pore model was hypothesized.10 Pore formation in the case of ClyA, is thought to occur through the following sequence of steps. Initially the water soluble monomer converts to a membrane bound protomer through a large conformational change during which the N-terminus moves out of a dominant helical bundle present in the monomer. The initial binding to the membrane is thought to occur through the hydrophobic β-tongue and recent molecular dynamics simulations illustrate this initial step,11 which is followed by the insertion of the N-terminus into the membrane. The details of subsequent oligomerization steps which lead to the formation of the dodecameric pore complex are unclear; oligomerization can either occur with the N-terminus present at the membrane interface (pre-pore model) or can proceed with the N-terminus inserted into the membrane (growing pore model). Conductance experiments with the α PFT, equinatoxin II (EqtII) revealed much broader conductance distributions with greater irregularity in the conductance signals when compared with the β-toxin, γ-hemolysin.12 Pores with EqtII were purported to form structures where part of the pore channel consisted of the α-toxins with toroidal lipids making up parts of the channel where proteins were absent. Using X-ray crystallography, lipidic pore arrangements have been observed in pore forming peptides.13 Pores formed with participating lipids could be more general and pertinent to pores formed by α toxins.
There have been several studies in the literature where pore formation rates have been investigated.14,15 A majority of the experimental work has been carried out on SUVs where dye leakage is on the order of a few ms and the rates of pore formation are controlling.16 Typical dye leakage from a suspension of SUVs have a characteristic feature: a fast time constant at early times followed by a longer and slower time constant.16,17 Pore formation rates are usually extracted from the fast time constant,18 by assuming a Poisson process governing the arrival rates of pores on the vesicles. In contrast to experiments with SUVs, leakage experiments with single GUVs appear to have greater control as leakage from GUVs can be directly imaged.19,20 Since diffusion from GUVs is rate controlling, kinetics obtained from single GUV leakage experiments can be related to the number of pores formed on the vesicle at steady leakage rates provided a precise knowledge of the relation between toxin concentration and bound toxin is known. Additionally a stochasticity has been observed in GUV experiments, wherein the fraction of leaked GUVs from several repeated experiments was found to change exponentially with time, having a distinct dependence on the toxin concentration.19
Models which combine detailed oligomerization kinetics and pore formation of PFTs and peptides have only recently appeared in the literature and these models can potentially provide insight into the oligomerization pathways. Vaidyanathan et al.,21 studied the rupture and leakage from RBCs when exposed to ClyA. Using a model which incorporated adsorption, binding, oligomerization and rupture kinetics, both sequential irreversible and non-sequential kinetics were found to yield similar predictions to the hemoglobin release dynamics. However the sequential model was found to capture the dependence of hemoglobin release on toxin concentration more accurately. In a recent modeling study by Lee et al.,22 the reversible sequential model was found to yield the best predictions for pore formation kinetics of Cry1Ac, α-hemolysin and ClyA. Using single molecule FRET based experiments the assembly of ClyA has been analyzed in detergent and the non-sequential mechanism was found to yield the best prediction of the oligomer and pore evolution kinetics. Further, in the modelling study by Lee et al.,22 the FRET pore evolution data was fit to a sequential model and comparison with other kinetic pathways were not reported. We point out that the time scales for oligomerization and kinetics in detergent are typically on the order of 1000's of seconds indicating that oligomerization in detergent is significantly slower when compared with membrane driven oligomerization. In contrast, the time scales encountered in small unilamellar phospholipid vesicle leakage experiments where pore formation kinetics are probed, are typically on the order of a few minutes. In a combined AFM and electron microscopy (EM) study8 of suilysin oligomerization, oligomer distributions were described by sequential kinetics and interaction between arcs, as observed by Mulvihill et al.6 in a time dependent AFM study of LLO oligomerization, were not observed. In a recent review of various oligomerization pathways across α toxins, the sequential mechanism appears to be the most prevalent.23
In this manuscript we carry out calcein leakage experiments for the pore forming toxin ClyA on a suspension of SUVs made up of DPPC/cholesterol in a 7![[thin space (1/6-em)]](https://www.rsc.org/images/entities/char_2009.gif) :
:![[thin space (1/6-em)]](https://www.rsc.org/images/entities/char_2009.gif) 3 molar ratio. We combine the oligomerization kinetics for ClyA with a Poisson process for pore formation in order to predict the temporal evolution of dye leakage. The model predictions were found to yield the best agreement with a reversible sequential mechanism after incorporating leakage from membrane inserted arcs ranging from 5–12 mer oligomeric intermediates. Significantly we capture both the short and long time dye release kinetics which to our knowledge has not been reported in the literature. Non-sequential mechanisms were unable to predict the release kinetics and we propose a model for pore formation and leakage based on the formation of ‘pre-arcs’ wherein partly oligomerized structures insert stochastically into the membrane to cause leakage.
3 molar ratio. We combine the oligomerization kinetics for ClyA with a Poisson process for pore formation in order to predict the temporal evolution of dye leakage. The model predictions were found to yield the best agreement with a reversible sequential mechanism after incorporating leakage from membrane inserted arcs ranging from 5–12 mer oligomeric intermediates. Significantly we capture both the short and long time dye release kinetics which to our knowledge has not been reported in the literature. Non-sequential mechanisms were unable to predict the release kinetics and we propose a model for pore formation and leakage based on the formation of ‘pre-arcs’ wherein partly oligomerized structures insert stochastically into the membrane to cause leakage.
2 Experimental methods
2.1 Vesicle preparation
Calcein loaded DPPC![[thin space (1/6-em)]](https://www.rsc.org/images/entities/char_2009.gif) :
:![[thin space (1/6-em)]](https://www.rsc.org/images/entities/char_2009.gif) cholesterol vesicles are prepared with the sonication method using the protocol described elsewhere.24 Briefly, DPPC (Avanti polar) and cholesterol (Sigma) are weighed to form 30 mol% cholesterol membranes and dissolved in chloroform (Sigma, HPLC grade). The solution is vacuum dried and resuspended in a 70 mM calcein solution in PBS buffer using 10 freeze–thaw cycles. Short time probe sonication for 5 minutes is used to form small unilamellar vesicles. The excess calcein is removed by passing the solution through a Sephadex G-50 column. The presence of vesicles in the eluted fractions are verified by 1% Triton-X treatment. The vesicle diameter estimated from dynamic light scattering was 60–65 nm (see ESI Fig. 1†)
cholesterol vesicles are prepared with the sonication method using the protocol described elsewhere.24 Briefly, DPPC (Avanti polar) and cholesterol (Sigma) are weighed to form 30 mol% cholesterol membranes and dissolved in chloroform (Sigma, HPLC grade). The solution is vacuum dried and resuspended in a 70 mM calcein solution in PBS buffer using 10 freeze–thaw cycles. Short time probe sonication for 5 minutes is used to form small unilamellar vesicles. The excess calcein is removed by passing the solution through a Sephadex G-50 column. The presence of vesicles in the eluted fractions are verified by 1% Triton-X treatment. The vesicle diameter estimated from dynamic light scattering was 60–65 nm (see ESI Fig. 1†)
2.2 Determination of lipid concentration
We have used the ammmonium ferrothiocyanate method to determine the lipid concentration,25 lying in the range of 0.01–0.1 mg ml−1. The calibration curve used to determine the lipid concentration is illustrated in the ESI (Fig. 2).†2.3 Fluorescence data
An Agilent Cary Eclipse fluorescence spectrophotometer is used for the SUV leakage experiments. Calcein dye has an excitation and emission of 495 nm and 520 nm respectively. The photomultiplier (PMT) voltage was kept at 600 V, the excitation line was at 490 nm whereas the emission line was at 520 nm with a 5 nm slit width. The data has been collected at intervals of 100 ms. Experiments have been performed at a temperature of 300 K and in all the leakage experiments 6 μg of the ClyA toxin was added to 200 μl of the DPPC/cholesterol (70/30) SUV solution.2.4 Expression and purification of ClyA
The ClyA encoded plasmid was obtained from J. Green (University of Sheffield, Sheffield, UK). E. coli BL21 endo− cells transformed with pPROb ClyA were grown in Terrific Broth (Pronadisa), and proteins were expressed upon induction with 500 μM isopropyl thiogalactopyranoside at 16 °C for 12 h. Proteins were purified using a procedure described earlier,21 and purified proteins were desalted in buffer containing 50 mM Tris–HCl (pH 8.0), 5 mM β-mercaptoethanol, 100 mM NaCl, and 10% glycerol. Cleavage of histidine tagged proteins was carried out with TEV protease to tagless proteins. The activity of ClyA was tested using RBC lysis experiments at 25 °C.3 Modeling calcein leakage and oligomerization kinetics
3.1 Calcein leakage
We briefly illustrate how the leakage data is modeled to obtain the efflux function from the experiment. If at any time t, Nl vesicles have leaked then the concentration of dye in the external solution is,
 | (1) |
| I(t) = ACd, | (2) |
 | (3) |
 | (4) |
 | (5) |
Substituting eqn (5) into (4) we obtain
 | (6) |
 | (7) |
3.2 Oligomerization kinetics
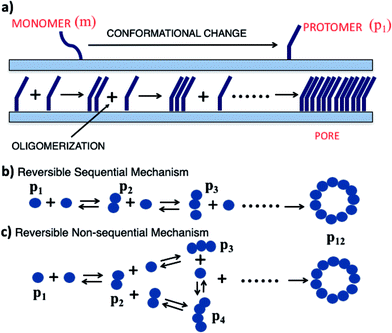
Oligomerization and pore formation proceeds with the membrane bound monomer m undergoing a conformational change to convert to a protomer p1. Subsequently the protomer undergoes further oligomerization to form higher order oligomers, pi. We investigate both sequential and non-sequential kinetic mechanisms for oligomerization and pore formation as illustrated in Fig. 1. In irreversible sequential kinetics (IRS), oligomerization occurs sequentially by the addition of a protomer to other protomers or oligomers. In the case of reversible sequential kinetics, with the exception of the conformational change, all the steps are considered reversible. The model is developed under the assumption that the forward and backward rate constants are similar for all the different kinetic mechanisms examined. This assumption significantly reduces the parameters, and has also been shown to effectively predict oligomerization and leakage kinetics in other modelling studies.21,22The mass balance on the monomer is,
and
 | (8) |
In the above equations the dimensionless variables are,
In the non-sequential (NS) mechanisms, higher order oligomers can be formed not only by the addition of a single protomer but via various allowed integer combinations e.g. a tetramer can be formed by the addition of two dimers as well as the addition of a trimer to a protomer. All these steps can be either reversible or irreversible. In case of the NS mechanism oligomerization is assumed to proceed via bimolecular association or dissociation steps resulting in second order kinetics. Hence a tetramer cannot be formed by the addition of 2 protomers and one dimer. The mass balance equations for the NS mechanism are given below,
 | (9) |
The RNS mechanism is recovered by setting αb = 0 in the above equations.
3.3 Leakage function and Poisson statistics
Calcein leakage is treated as a Poisson process, wherein we assume that the arrival times (due to the formation) of leaky intermediates/arcs or pores on the vesicles can be modeled using a Poisson distribution.26 Since the number of vesicles, Nv is significantly larger than the number of protein molecules available for pore formation this assumption is justified. We point out that the diffusion time for the calcein molecules to leak out through a pore or arc, can been estimated using a simple diffusion model which results in the relation, tD = Vvlp/ApD, where tD is the diffusion time for calcein leakage, Vv is the vesicle volume, lp = 10 nm is the length of the ClyA pore, Ap is the effective pore or arc area and D = 100 μm2 s−1 is the diffusion constant of calcein. The time scales for leakage are on the order of milliseconds irrespective of whether we consider leakage through an arc or through a full pore. We obtain a leakage time of 3.6 ms, through a dodecameric ClyA pore of radius 1.25 nm for a vesicle of diameter 70 nm. Since these diffusion time scales through the arcs/pores are significantly smaller compared to the conformational and oligomerization time scales, the dye leakage mechanism is controlled by pore formation time scales which are on the order of seconds to minutes. Therefore we do not consider leakage times from the different sized arcs or pores. As a consequence, the measured time variation of the fluorescence intensity reflects the rate of pore formation on the vesicle. This separation of time scales is an important factor while analyzing leakage data from SUVs.26 Typical estimates for Nv lie in the range of 1.5–1.9 × 10¹³ and the protein to lipid ratios range from 30–35 protein molecules/vesicle. Since the ClyA pore is dodecameric,27 the small number of protein molecules per vesicle indicate that several vesicles are likely to have partially formed oligomers. We shall see that incorporating leakage from these partially formed oligomers plays an important role while making contact with the calcein leakage data.If λi represents the average rate of formation of an oligomer containing i mers (pi) on the vesicle surface then the probability that a vesicle contains k such pores is,
 | (10) |
The probability that a vesicle will not have any pores is obtained by setting k = 0 in eqn (10),
| E(k = 0;λi,t) = e−λit. | (11) |
If Nu represents the number of unleaked vesicles, Nl the number of leaked vesicles and Nv the total number of vesicles in the system, then the probability of observing Nu unleaked vesicles is, Nu/Nv and
| Nu/Nv = e−λit. | (12) |
During a leakage experiment not all the vesicles leak. If N∞u is the number of unleaked vesicles at long time then,
 | (13) |
In the above analysis we assume that leakage occurs through a well defined pore with a fixed number of mers. In the case of ClyA it is natural to assume that leakage would occur through a dodecameric pore, however it is possible that leakage could occur through partially formed intermediates or arcs.
In order to incorporate leakage through smaller intermediates or arcs, we assume that leakage occurs independently from the different oligomeric intermediates. We propose a pre-arc based model to support this hypothesis later in the text. In this situation leakage is assumed to occur through independent Poisson processes since leakage occurs instantaneously once a pore is formed on a particular vesicle. In this scenario, the probability of observing k and l pore intermediates due to independent pore formation rates λi and λj are,
 | (14) |
The probability of not observing either k or l intermediates is obtained by setting k = 0 and l = 0, resulting in
| E(k = 0, l = 0; λi, λj, t) = e−(λi+λj)t. | (15) |
Extending this, for n independent rates corresponding to n distinct pore intermediates, then the probability of not observing any leakage is simply an extension of eqn (15) giving rise to the leakage or efflux function,
 | (16) |
 | (17) |
Substituting the expression for λi from eqn (17) into (16) we obtain,
 | (18) |
 | (19) |
For a given mechanism, we seek a solution to the oligomerization equation (eqn (8) or (9)) coupled with eqn (19). The unknown parameters are γ, τf, αb and αc. We have estimated the lipid concentration to range from 1–1.3 mg ml−1 using the procedure described earlier and this concentration is used to estimate the number of vesicles which lie in the range of 1.5–1.9 × 10¹³. The protein concentration used in the experiment is 0.68 μM and the solution volume is 260 μl. Using a mean vesicle size of between 65–70 nm and a mean molecular area for the lipid (DPPC) as 70 Å2 we estimate γ to lie between 30–35. Although we have a good estimate for the range for γ values, we treat γ as a free parameter and check the sensitivity of the model predictions to γ. We obtain estimates for τf from double exponential fits to the calcein leakage data which are used as initial guesses for the optimization routines. This leaves αc and αb as the primary unknown parameters at a fixed value of the number of n-mer complexes that can contribute to leakage. The optimal parameter set is obtained using a genetic algorithm technique, using the function GA, in MATLAB 2013a. This technique can be used for optimization in the absence of a well defined range for the model parameters. This technique does not require a continuous functional form or objective function and the optimized parameters are passed to subsequent generations while seeking the optimal solution.
4 Results and discussion
4.1 Leakage data
Fig. 2 illustrates the normalized efflux function, E(t) for the intensity changes during the calcein leakage experiments from vesicles incubated with ClyA. The efflux function for the dye shows the characteristic fast and slow time scales typically observed in SUV leakage experiments. In order to estimate the time constants associated with these regimes we use a double exponential fit,
E(t) = A![[thin space (1/6-em)]](https://www.rsc.org/images/entities/char_2009.gif) exp(−t/τ1) + B exp(−t/τ1) + B![[thin space (1/6-em)]](https://www.rsc.org/images/entities/char_2009.gif) exp(−t/τ2) exp(−t/τ2)
| (20) |
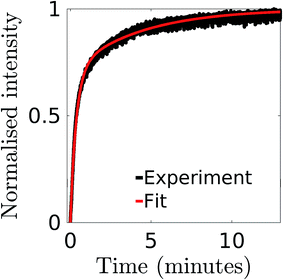 | ||
Fig. 2 Normalized intensity for calcein leakage from vesicles where 6 μg of ClyA has been incubated with 200 μl solution of DPPC![[thin space (1/6-em)]](https://www.rsc.org/images/entities/char_2009.gif) : :![[thin space (1/6-em)]](https://www.rsc.org/images/entities/char_2009.gif) chol (7 chol (7![[thin space (1/6-em)]](https://www.rsc.org/images/entities/char_2009.gif) : :![[thin space (1/6-em)]](https://www.rsc.org/images/entities/char_2009.gif) 3) SUVs. The data is fitted to a double exponential function (eqn (20)) and the parameters τ1 and τ2 which correspond to the fast and slow time constants are given in Table 1. 3) SUVs. The data is fitted to a double exponential function (eqn (20)) and the parameters τ1 and τ2 which correspond to the fast and slow time constants are given in Table 1. | ||
| Model parameters | Mean values |
|---|---|
| A | 0.79 ± 0.074 |
| τ1 (min) | 0.45 ± 0.162 |
| τ2 (min) | 5.68 ± 1.893 |
| B | 0.21 ± 0.074 |
4.2 Model predictions
Optimized or best fit parameters to the efflux function E(t) are obtained for the irreversible sequential (IRS), reversible sequential (RS), reversible non-sequential (RNS) and irreversible non-sequential (IRNS) mechanisms. In case of the irreversible mechanisms three parameters, αc, τf and γ are optimized, and for the reversible mechanism, in addition to these parameters, αb is also optimized. We have optimized these parameters to obtain the best fit, for different mechanisms by considering leakage contributions from various oligomer fractions in the efflux function. The optimized parameters for the RS mechanism are given in Table 2 and parameters for the other mechanisms are in the ESI (Tables 1–3).† The predicted efflux functions upon considering various populations of the oligomers that contribute to leakage are illustrated in Fig. 3 and 4 for the non-sequential and sequential mechanisms respectively. The results from different mechanisms are discussed next.| Oligomers | αb | αc | τf (s) | Proteins per vesicle (γ) |
|---|---|---|---|---|
| 5–12 | 0.026 | 5.9 | 4.4 | 35 |
| 7–12 | 1.3 | 2.0 | 3.0 | 54 |
| 9–12 | 0.28 | 12.3 | 2.9 | 90 |
| 12 | 0.17 | 6.8 | 2.5 | 227 |
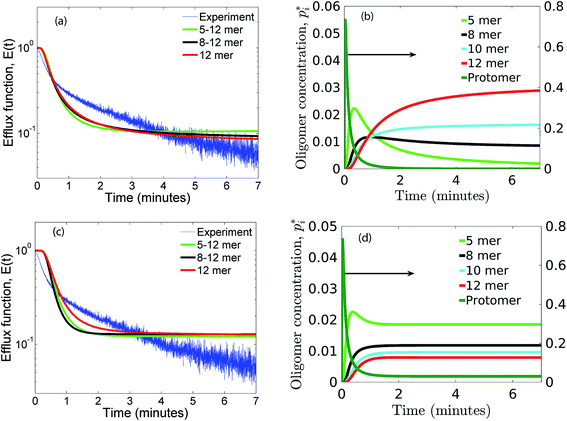
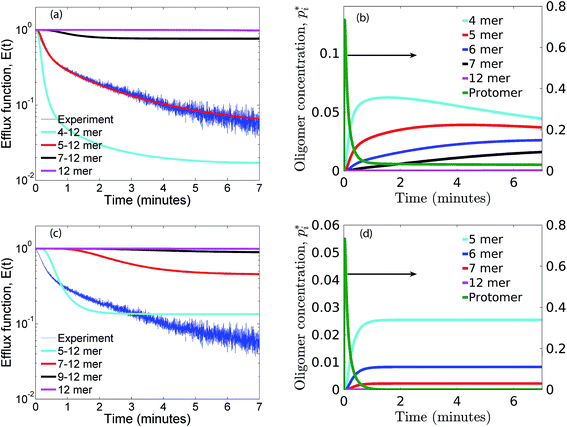
Fig. 4b illustrates the time evolution of oligomers for parameter values obtained for the best fit to the leakage data. The key observation is the rapid rise in the lower order oligomers at the early times. The data in Fig. 4b corresponds to the optimal solution to the data shown in Fig. 4a. Here the lower order oligomers between 5, 6 and to some extent 7 show an increase between 0–0.5 minutes which contributes to the rapid drop in the efflux function during this time scale. At longer times, between 1–3 minutes, the fraction of higher order oligomers gradually increases and the rate of formation of the lower order oligomers remain steady. Over the time scale of the experiment, contributions from higher order oligomers are not significant. This is a consequence of the low protein to lipid ratios, γ in the system. The concentration of protomers (p1) drops sharply and attains a steady non-zero value due to the reversibility in the kinetic model. In order to study the contribution from the higher order oligomers we obtained optimized solutions by varying the upper limit of the mers that contribute to leakage (ESI Fig. 3†). The leakage function is significantly underestimated if only 5 mers are assumed to contribute to leakage. Including 5–7 mers captures the short time transient and is able to predict the leakage function up to 1 minute. However the longer time leakage response is underestimated at these oligomer populations. The predictions from 5–10 mers improves the long time (1–7 minutes) contribution to the leakage function and excellent predictions are obtained across the entire observation time. Addition of 11 and 12 mers, marginally improves the leakage predictions at longer times, indicating that the dominant contribution to leakage arises from the intermediate pores formed from p5–p10. For the estimated values of γ and noting that ClyA forms a dodecameric pore, 2–3 pores can form per vesicle if all the protein converts to form the dodecameric pore complex.
The predictions with the IRS mechanism are illustrated in Fig. 4c, where the model is unable to capture the leakage trends. Unlike the NS mechanism the leakage is a strong function of the mer populations used in the model. Inclusion of only the higher order oligomers results in a very low leakage intensity and the corresponding γ values (Table 2) are unusually high. This trend is observed for the RS mechanism as well. Since steady states are achieved once the p1 population is exhausted, a steady mer distribution is observed after 2 minutes for the 5–12 mer simulation. This results in a characteristic step-like leakage function (Fig. 4c) under these conditions.
4.3 Assessing reversibility; αb
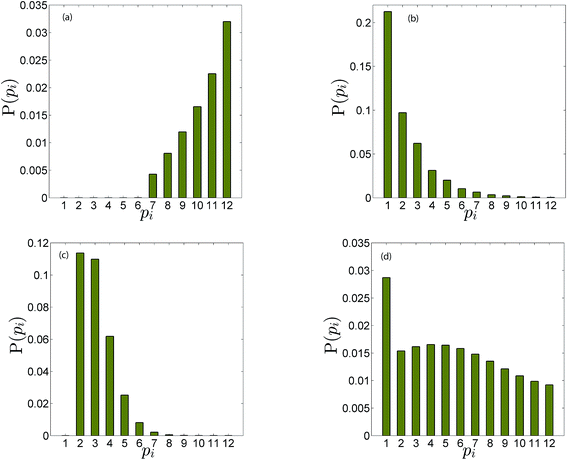
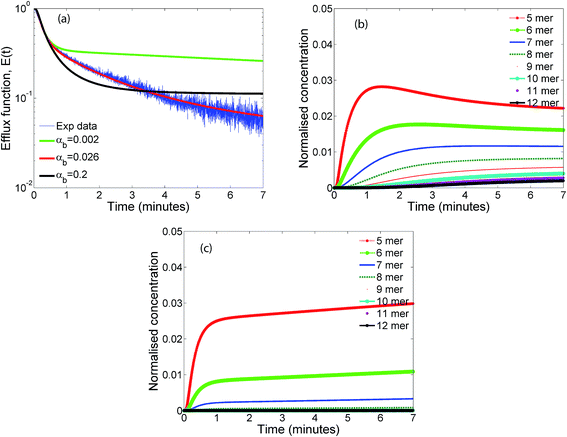
The evolution of the efflux function, with varying values of αb are illustrated in Fig. 6a for the RS mechanism. For a wide range of αb, which is the ratio of the forward to backward time constants, the initial fast time constant in the leakage data is captured quite accurately, however the values of αb is seen to have a strong influence on the longer time evolution of the efflux function and the entire temporal evolution is captured only when αb lies in the range of 0.02–0.03. As αb is lowered, the mechanism tends to that of the IRS mechanism. In this mechanism oligomerization ceases when the protomer concentration p1 reduces to zero. Hence a steady distribution of the lower oligomers which dominate the early dynamics, are achieved at earlier times for higher values of αb = 0.2 (Fig. 6b) leading to a relatively constant efflux evolution at earlier times when compared with the prediction at lower values of αb = 0.002 (Fig. 6c). At intermediate values of αb (Fig. 6b) the 5 mer population is seen to go through an initial maximum. The extent of reversibility plays an important role in the evolution of the population of mers on the surface of the membrane. In the absence of reversibility, oligomerization ceases when p1 concentration drops to zero for the sequential mechanisms. However even a small amount of reversibility maintains a supply of p1 which influences the overall oligomer evolution. The steady distribution of oligomers in the case of the RS mechanism is more evenly distributed when compared with the distribution obtained for the IRS mechanism where the distribution is skewed toward the lower order oligomers which remain trapped once p1 is no longer present (Fig. 5c). Our analysis indicates that reversibility plays an important role in maintaining a supply of intermediate oligomers that can contribute to leakage. This is consistent with findings in this study as well as with the oligomerization models that were used to fit pore formation kinetics by Lee et al..22 We point out that in our analysis we have assumed that the p12 or the ClyA pore complex can reversibly breakup to form p1 and p11. Relaxing this assumption did not alter the model predictions due to the low concentration of p12 oligomers when compared with the concentration of the lower order oligomers formed for the time scales involved in the leakage experiments.4.4 Influence of conformation and oligomerization times, αc
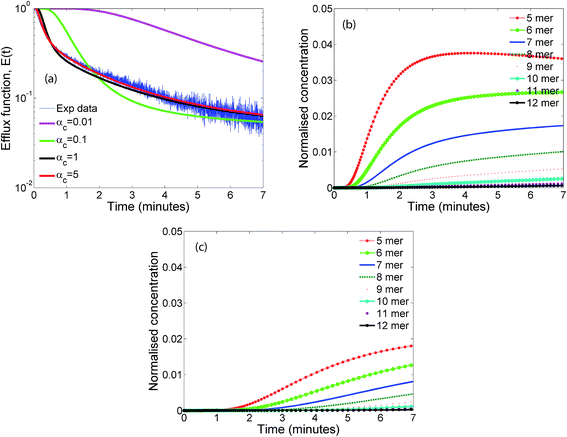
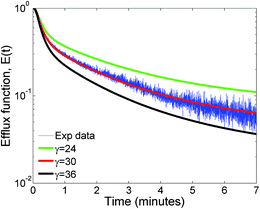
The influence of the parameter αc which is the ratio of the oligomerization time constant to the conformational time is illustrated in Fig. 7a. Only a marginal change is observed for αc values greater than 1, indicating that the oligomer distributions are relatively insensitive to αc in this range where the conformational changes are complete. We did not observe any significant change in the leakage evolution for αc values between 1–5 and the predictions remain unchanged upon further increase in the value of αc. At higher values of αc, the monomer converts rapidly to form the membrane inserted protomer and a steady state is achieved more rapidly for the RS mechanism. In contrast, the model predictions are sensitive to αc below 1. As αc is lowered, the time constant for conformational change is increased compared to the oligomerization time, and the evolution of oligomer populations is delayed (Fig. 7b and c). Hence at the lower value of αc ≤ 1, we observed a delay ranging from 1–2 minutes, before leakage is initiated. Since the optimal value of the time constant for oligomerization τf = 1/kfmo is 4.4 s, an αc = τf/τc value of 5 and 1 imply τc values of 0.88 and 4.4 s respectively. We point out that it is generally accepted that the conformation time is larger than the oligomerization time constant for ClyA.29 Our observation for the optimal solution indicates that the conformational time is faster or similar to the time scales for oligomerization.Fig. 8 illustrates the effect of varying γ which is proportional to the protein to lipid ratio, on the model predictions. Increasing the value of γ, results in a greater drop in the efflux function due to formation of a larger number of pores. Model predictions are quite sensitive to changes in γ and the best fit is obtained for the computed values based on the lipid and protein concentrations in the experiment which lie in the range of 30–35 proteins per vesicle.
5 Discussion: leaky intermediates, pre-arcs and arcs
As seen earlier, the best predictions to the efflux data are obtained while using a model that includes leakage from a range of intermediates or arc-like pore structures. The contribution from these various fractions as determined by the oligomerization kinetics influences the evolution of the efflux function. We have observed that contributions from 5 to 12 oligomers provide the best fit over the entire temporal evolution of the observed leakage. In Fig. 4a we illustrate the effect of varying the range of ‘arcs’ that contribute to leakage. If the only contribution to leakage is from the dodecameric 12-mer pore complex we are unable to capture the leakage data for any combination of parameter sets, since the evolution of the 12-mer complex is significantly slower when compared with the formation rates for the lower order oligomers over the time scales sampled in the experiment. Increasing the contribution from the lower order oligomers is a critical requirement in order to capture the rapid efflux at short times. Including the 4-mer population in the model results in a large overestimate of the efflux evolution. Upon considering a fully formed pore consisting of 12 protomeric units, the angle subtended by each protomeric unit is 30°. Based on projected areas and using a hydrodynamic radius of 0.74 nm for the calcein molecule we estimate the number of calcein molecules that can be filled in the arcs of ClyA. Using this geometric criterion for the pore cross-section, the 5-mer arc is able to pack about 6 calcein molecules, however for the 4-mer arc this number reduces to 4–5 calcein molecules. This simple geometric criterion only provides an upper estimate of the void space and does not account for the reduced hydrodynamic diameter of the pore due to the presence of bound water and ions.30The model predictions suggest that leakage from ClyA on SUVs occurs predominantly through arcs which are oligomeric intermediates formed during pore formation. The propensity to form these lower order pore oligomers or arcs that remain trapped without subsequent oligomerization is further enhanced due to the low protein to lipid ratios in our system. High curvature in SUVs could also play a role. In recent molecular dynamics simulations of ClyA, carried out in our laboratory we have shown that membrane inserted arcs or pores are lined by the protein on one face with toroidal lipids forming the pore interior in regions where proteins are absent.31 These arcs were found to be stable structures with a water channel capable of transporting material across the transmembrane channel supporting the prediction that arcs play a dominant role in the leakage. Arc-like transmembrane constructs have been purported to exist for other α-helical transmembrane proteins such as actinoporins.12 Since the predictions of leakage data are dominated by a population transmembrane arcs, the propensity to form the complete dodecameric pore is restricted, at least on the time scale of the leakage experiment. It is well known that curvature effects play an important role in the pore formation propensity and positive curvature lipids are known to stabilize toroidal pore formation with antimicrobial peptides.32 This supports the notion that high curvature present in the SUVs used in this study could play a role in stabilizing the formation of toroidal lipids which are required to form the transmembrane arc-like ClyA structures predicted by the model. Complete oligomerization for α-hemolysin (a β-toxin) has been shown to be reduced in membranes with higher curvature.33
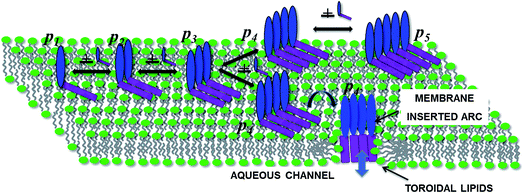
In order to rationalize leakage through these arcs we invoke the following model for pore formation as illustrated in Fig. 9. Since a higher order oligomer must necessarily be preceded by a lower order oligomer, leakage occurs through the smallest transmembrane arcs capable of transporting calcein. Noting that leakage times are significantly smaller than pore formation times, leakage would then be entirely dependent on the formation of the first leaky intermediate. Our model suggests that pore formation and leakage in the collection of SUVs is governed by the underlying stochasticity of a Poisson process. In the pre-pore model,10 pre-arcs which are not membrane inserted, first assemble on the membrane surface (Fig. 9). Recent molecular dynamics simulations in our laboratory, reveal that this membrane inserted state is driven by the insertion of the hydrophobic β tongue into the membrane lipids.11 At this stage the N-terminus, depicted in purple in Fig. 9 is not yet inserted into the membrane. Oligomerization takes place to form the pre-arcs pi and membrane insertion converts a pre-arc to an arc which is then capable of leakage. In this scenario one can envision the assembly of pre-arcs which continue to oligomerize on some vesicles to form larger pre-arcs which can eventually assemble to form the dodecameric pore provided sufficient toxin is available. Within this picture, the oligomerization kinetics as evaluated in our model, represents the rates for the formation of pre-arcs. The conversion of the pre-arc to a membrane inserted arc is assumed to be a relatively fast step when compared with the oligomerization kinetics. Since the protein to lipid ratio is small, it is highly probable that these pre-arcs can no longer oligomerize to completion and convert rapidly to a functional transmembrane arc. The model predictions further support the view that formation of transmembrane arcs capable of leakage on the membrane surface follows a Poisson process which determines the arrival times of arcs/pores on the vesicle surface.
Before concluding this section we discuss our results in light of other oligomerization mechanisms that have been proposed for ClyA as well as other cholesterol dependent cytolysins (CDCs). Our model for ClyA oligomerization on vesicles invokes certain common features associated with AFM data, albeit on CDCs. These are the presence of arcs and pre-arcs as well as the membrane inserted arcs. Note that in our model for ClyA leakage kinetics, we did not include the transition from a pre-arc to a membrane inserted arc and additional experimental evidence is required to elucidate the details of this mechanism, if it exists. Further, a simple sequential model was able to qualitatively match the steady state arc distributions obtained for suilysin on supported lipid membranes8 and arc–arc interactions to form pores (non-sequential mechanism) observed in a previous LLO study6 were not observed by these authors. Additional efforts are required to resolve these underlying differences. Our results concur with the reversible sequential mechanism used by Lee et al.,22 to predict the kinetics of pore formation for ClyA as well as other toxins. In contrast, single molecule FRET experiments by Benke et al.,34 are compatible with a non-sequential mechanism for oligomerization kinetics of ClyA in detergent where a molten globule off-pathway intermediate was found to be present in the monomer to protomer transition. It is likely that the assembly and kinetic pathways sampled for protein assembly in bulk detergent solution can vary with pathways for membrane assisted oligomerization where kinetics are about 50–100 times faster than assembly in detergent.
6 Summary and conclusion
We carried out calcein leakage experiments for ClyA using a suspension of SUVs made up of DPPC/Cholesterol in a 7![[thin space (1/6-em)]](https://www.rsc.org/images/entities/char_2009.gif) :
:![[thin space (1/6-em)]](https://www.rsc.org/images/entities/char_2009.gif) 3 molar ratio. Using a Poisson model to describe the inherent stochasticity present during pore formation in the SUV suspension we test various oligomerization pathways on the vesicles by comparing the model predictions with the observed calcein leakage data for ClyA. The model predictions were found to yield the best agreement with a reversible sequential mechanism after incorporating leakage from membrane inserted arcs ranging from 5–12 mer oligomeric intermediates. The dominant contribution was found to occur from the smaller arcs, consistent with the low protein to lipid ratios used in the experiment. There are two models that have been proposed in the literature for pore formation. In the pre-pore model oligomerization proceeds on the membrane surface to form a pre-pore structure. These pre-pore complexes are not capable of leakage until they penetrate into the membrane to form a transmembrane pore complex capable of transporting ions and cellular content across the membrane. In this model the pre-pore assembly proceeds without the formation of any membrane inserted oligomers capable of leakage. In a second model known as the growing pore model, membrane inserted arcs which are partially formed oligomers are capable of leakage. Our analysis suggests a model for the pore formation mechanism of ClyA connected to the pre-pore hypothesis usually associated with the formation of a fully formed dodecameric pre-pore.10 However, we propose that pre-arcs which are oligomeric intermediates insert into the membrane in a stochastic manner to cause leakage. The primary evidence for this mechanism is derived from the reversible sequential oligomerization model which provides an excellent fit to the leakage data. In this model pre-arcs evolve and insertion and ensuing leakage occurs stochastically. This stochasticity is built into the Poisson process where the arrival times of the leaky arcs or pores follow a Poisson distribution. Further our model is able to capture for the first time both the fast and slow time constants typically observed in calcein leakage data. A key inference is that intermediate arcs play a critical role in leakage and our model predicts that leakage from arcs ranging from 5–12 mers are required to capture the entire time evolution of the leakage data. The fast time scale arises from the smaller arcs and longer slower time scales are attributed to the higher oligomeric arcs.
3 molar ratio. Using a Poisson model to describe the inherent stochasticity present during pore formation in the SUV suspension we test various oligomerization pathways on the vesicles by comparing the model predictions with the observed calcein leakage data for ClyA. The model predictions were found to yield the best agreement with a reversible sequential mechanism after incorporating leakage from membrane inserted arcs ranging from 5–12 mer oligomeric intermediates. The dominant contribution was found to occur from the smaller arcs, consistent with the low protein to lipid ratios used in the experiment. There are two models that have been proposed in the literature for pore formation. In the pre-pore model oligomerization proceeds on the membrane surface to form a pre-pore structure. These pre-pore complexes are not capable of leakage until they penetrate into the membrane to form a transmembrane pore complex capable of transporting ions and cellular content across the membrane. In this model the pre-pore assembly proceeds without the formation of any membrane inserted oligomers capable of leakage. In a second model known as the growing pore model, membrane inserted arcs which are partially formed oligomers are capable of leakage. Our analysis suggests a model for the pore formation mechanism of ClyA connected to the pre-pore hypothesis usually associated with the formation of a fully formed dodecameric pre-pore.10 However, we propose that pre-arcs which are oligomeric intermediates insert into the membrane in a stochastic manner to cause leakage. The primary evidence for this mechanism is derived from the reversible sequential oligomerization model which provides an excellent fit to the leakage data. In this model pre-arcs evolve and insertion and ensuing leakage occurs stochastically. This stochasticity is built into the Poisson process where the arrival times of the leaky arcs or pores follow a Poisson distribution. Further our model is able to capture for the first time both the fast and slow time constants typically observed in calcein leakage data. A key inference is that intermediate arcs play a critical role in leakage and our model predicts that leakage from arcs ranging from 5–12 mers are required to capture the entire time evolution of the leakage data. The fast time scale arises from the smaller arcs and longer slower time scales are attributed to the higher oligomeric arcs.
The insight provided by the oligomerization mechanism can be useful while developing drug targets to potentially disrupt pore formation by compromising oligomeric intermediates thereby preventing the formation of transmembrane channels implicated in PFT mediated infections. Our analysis in the present work has been carried out for leakage data obtained from a DPPC/Cholesterol system and it is well known that ClyA pore formation is enhanced by the presence of cholesterol. Although leakage kinetics are expected to vary with cholesterol content and the underlying transition temperature of the lipids, we expect the generic conclusions deduced in this manuscript to remain unaltered.
Conflicts of interest
There are no conflicts to declare.Acknowledgements
This work was carried out with funding from the Department of Science and Technology (DST) under the IRHPA scheme. AA and KGA would like to thank Jaydeep Basu, Sandhya Visveshwaraiah, Sanjeev Gupta, Rahul Roy and Pradeep Sathyanarayana for several useful discussions during the course of this work. The ClyA toxins used in this work were expressed and purified by Pradeep Sathyanarayana.References
- M. Soskine, A. Biesemans, B. Moeyaert, S. Cheley, H. Bayley and G. Maglia, Nano Lett., 2012, 12, 4895–4900 CrossRef CAS PubMed.
- A. P. Heuck, R. K. Tweten and A. E. Johnson, J. Biol. Chem., 2003, 278, 31218–31225 CrossRef CAS PubMed.
- D. M. Czajkowsky, E. M. Hotze, Z. Shao and R. K. Tweten, EMBO J., 2004, 23, 3206–3215 CrossRef CAS PubMed.
- M. Podobnik, M. Marchioretto, M. Zanetti, A. Bavdek, M. Kisovec, M. M. Cajnko, L. Lunelli, M. Dalla Serra and G. Anderluh, Sci. Rep., 2015, 5, 1–10 Search PubMed.
- N. Yilmaz and T. Kobayashi, ACS Nano, 2015, 9, 7960–7967 CrossRef CAS PubMed.
- E. Mulvihill, K. van Pee, S. A. Mari, D. J. Müller and O. Yildiz, Nano Lett., 2015, 15, 6965–6973 CrossRef PubMed.
- N. K. Sarangi, K. G. Ayappa, S. S. Visweswariah and J. K. Basu, Phys. Chem. Chem. Phys., 2016, 18, 29935–29945 RSC.
- C. Leung, N. V. Dudkina, N. Lukoyanova, A. W. Hodel, I. Farabella, A. P. Pandurangan, N. Jahan, M. Pires Damaso, D. Osmanovic, C. F. Reboul, M. A. Dunstone, P. W. Andrew, R. Lonnen, M. Topf, H. R. Saibil and B. W. Hoogenboom, eLife, 2014, 3, e04247 Search PubMed.
- R. J. Gilbert, Biochim. Biophys. Acta, Biomembr., 2016, 1858, 487–499 CrossRef CAS PubMed.
- M. Mueller, U. Grauschopf, T. Maier, R. Glockshuber and N. Ban, Nature, 2009, 459, 726–730 CrossRef CAS PubMed.
- V. V. H. Giri Rao, R. Desikan, K. G. Ayappa and S. Gosavi, J. Phys. Chem. B, 2016, 120, 12064–12078 CrossRef CAS PubMed.
- K. Č. Kristan, G. Viero, M. Dalla Serra, P. Maček and G. Anderluh, Toxicon, 2009, 54, 1125–1134 CrossRef PubMed.
- S. Qian, W. Wang, L. Yang and H. W. Huang, Proc. Natl. Acad. Sci. U. S. A., 2008, 105, 17379–17383 CrossRef CAS PubMed.
- J. M. Alam, T. Kobayashi and M. Yamazaki, Biochemistry, 2012, 51, 5160–5172 CrossRef CAS PubMed.
- M.-T. Lee, W.-C. Hung, F.-Y. Chen and H. W. Huang, Proc. Natl. Acad. Sci. U. S. A., 2008, 105, 5087–5092 CrossRef CAS PubMed.
- G. Schwarz, R.-T. Zong and T. Popescu, Biochim. Biophys. Acta, Biomembr., 1992, 1110, 97–104 CrossRef CAS.
- G. Menestrina, S. Forti and F. Gambale, Biophys. J., 1989, 55, 393–405 CrossRef CAS PubMed.
- S. Rex and G. Schwarz, Biochemistry, 1998, 37, 2336–2345 CrossRef CAS PubMed.
- Y. Tamba and M. Yamazaki, Biochemistry, 2005, 44, 15823–15833 CrossRef CAS PubMed.
- Y. Tamba, H. Ariyama, V. Levadny and M. Yamazaki, J. Phys. Chem. B, 2010, 114, 12018–12026 CrossRef CAS PubMed.
- M. Vaidyanathan, P. Sathyanarayana, P. K. Maiti, S. S. Visweswariah and K. G. Ayappa, RSC Adv., 2014, 4, 4930–4942 RSC.
- A. Lee, M. Senior, M. Wallace, T. Woolley and I. Griffiths, J. R. Soc., Interface, 2016, 13, 20150762 CrossRef CAS PubMed.
- K. Cosentino, U. Ros and A. J. García-Sáez, Biochim. Biophys. Acta, Biomembr., 2016, 1858, 457–466 CrossRef CAS PubMed.
- G. Menestrina, FEBS Lett., 1988, 232, 217–220 CrossRef CAS PubMed.
- J. C. M. Stewart, Anal. Biochem., 1980, 104, 10–14 CrossRef CAS PubMed.
- G. Schwarz and C. H. Robert, Biophys. J., 1990, 58, 577 CrossRef CAS PubMed.
- M. Mueller, U. Grauschopf, T. Maier, R. Glockshuber and N. Ban, Nature, 2009, 459, 726–730 CrossRef CAS PubMed.
- G. Schwarz and G. Beschiaschvili, Biochim. Biophys. Acta, Biomembr., 1989, 979, 82–90 CrossRef CAS.
- N. Eifler, M. Vetsch, M. Gregorini, P. Ringler, M. Chami, A. Philippsen, A. Fritz, S. A. Müller, R. Glockshuber and A. Engel, et al., EMBO J., 2006, 25, 2652–2661 CrossRef CAS PubMed.
- M. Taraknath, S. Kanchi, K. G. Ayappa and P. K. Maiti, Nanoscale, 2016, 8, 13045–13058 RSC.
- R. Desikan, P. K. Maiti and K. G. Ayappa, Langmuir, 2017, 33, 11496–11510 CrossRef CAS PubMed.
- A. A. Sobko, E. A. Kotova, Y. N. Antonenko, S. D. Zakharov and W. A. Cramer, FEBS Lett., 2004, 576, 205–210 CrossRef CAS PubMed.
- S. Fujii, T. Matsuura and T. Yomo, ACS Chem. Biol., 2015, 10, 1694–1701 CrossRef CAS PubMed.
- S. Benke, D. Roderer, B. Wunderlich, D. Nettels, R. Glockshuber and B. Schuler, Nat. Commun., 2015, 6, 6198 CrossRef CAS PubMed.
Footnote |
| † Electronic supplementary information (ESI) available. See DOI: 10.1039/c7ra07304f |
| This journal is © The Royal Society of Chemistry 2017 |

