 Open Access Article
Creative Commons Attribution 3.0 Unported Licence
Modeling of phase separation across interconnected electrode particles in lithium-ion batteries
Ying Zhao a,
Luis R. De Jesusb,
Peter Steina,
Gregory A. Horrocksb,
Sarbajit Banerjee
 *b and
Bai-Xiang Xu*a
aMechanics of Functional Materials Division, Department of Materials Science, TU Darmstadt, Jovanka-Bontschits-Str. 2, 64287 Darmstadt, Germany. E-mail: xu@mfm.tu-darmstadt.de; Fax: +49-6151-16-21034; Tel: +49-6151-16-21906
bDepartment of Chemistry, Department of Materials Science and Engineering, Texas A&M University, College Station, TX 77845-3012, USA. E-mail: banerjee@chem.tamu.edu
First published on 23rd August 2017
Abstract
Lithium transport and phase separation in and across interconnected electrode particles are investigated in this paper. This paper signifies the influential role of particle size variation on battery performance with phase-separating electrodes. In this work, a model is developed which accounts for lithium transport in the particles, phase separation, and interface reactions across the particle network. The implementation in 3D is carried out using the B-spline based finite cell method for a straightforward treatment of the Cahn–Hilliard equation and a flexible representation of particle geometry. Representative examples based on scanning transmission X-ray microscopy (STXM) images are simulated to discuss the factors that will influence phase separation during non-equilibrium lithiation and delithiation, as well as relaxation towards equilibrium. The simulations reveal that particles with a slight advance during (de-)lithiation at the beginning will strengthen their advance at the expense of neighboring particles, in a “winner-takes-all” fashion. Moreover, rapid reaction can suppress phase separation, both inside a single particle and across the particle network. Lastly, both particle size and size variation in electrodes composed of phase-separating materials ought to be small to avoid intra- and inter-particle phase separation. This study can serve as a guide for the design of battery electrodes composed of phase-separating materials.
Introduction
Many electrode materials undergo phase transformation and separation upon lithium intercalation, such as LiFePO4, lithium titanate, lithium nickel manganese oxides, V2O5, graphite and crystalline silicon (c-Si).1–10 Such phase separation can be problematic and sometimes destructive to the cyclic electrochemical performance of lithium-ion batteries. Although the volumetric expansion of amorphous silicon (a-Si) is as large as 300% with full lithiation, the homogeneous breathing-like volumetric expansion and contraction alone will not give rise to severe cracks in the particle. Instead, it is the abrupt increase in lithium concentration and tremendous strain mismatch at the c-Si/a-Si interface during the lithiation of c-Si that results in crack propagation and the irreversible capacity fade.11 Furthermore, phase separation also contributes to the concentrated current in a small number of particles (current “hot-spots”), as reported in the case of LiFePO4.12Considerable phase heterogeneity is also observed for V2O5 cathode materials upon lithiation. The layered nature of this compound as well the multiple accessible redox states makes this material an interesting model system for fundamental explorations of intercalation phenomena. Indeed, Raman spectroscopy and powder X-ray diffraction have been used to evaluate the phase evolution of V2O5 upon chemical lithiation as a function of particle size.13 The orthorhombic layered phase of V2O5 undergoes a series of intercalation-induced phase transformations with an increasing concentration of inserted Li ions.14–17 An α-phase, which is slightly distorted from the parent orthorhombic structure, first appears upon the insertion of Li ions and is stabilized for a diminutive composition range of 0 < x < 0.1 in LixV2O5. Subsequently, an ε-phase nucleates and is the thermodynamically stable polymorph of LixV2O5 in the compositional range of 0.3 < x < 0.85; the structure is characterized by the initial puckering of the apical oxygens due to their electrostatic interactions with the Li ions and an increase in the inter-layer spacing compared to pristine V2O5. Next, a highly puckered δ-phase is stabilized for concentrations of 0.88 < x < 1.0 in LixV2O5 and is characterized by the sliding of the layers by half a unit cell length along the b direction. Indeed, further lithiation above x > 1.0 still yields more distorted γ- and ω-phases,15 however, in these phases the layered V2O5 framework is irreversibly transformed and cannot be recovered upon delithiation.18 In contrast, at a low depth of discharge, the transition between the α-, ε-, and δ-phases is entirely reversible.
In previous work, summarized in Table 1, the progression of the phase nucleation of the aforementioned phases in V2O5 has been mapped using X-ray diffraction and Raman spectroscopy for different particle sizes: bulk particles (1–10 μm particle size), hydrothermally synthesized nanowires (with diameters of 150–250 nm and lengths spanning multiple microns), and nanoplatelets grown by chemical vapor deposition (20–50 nm).19 Fig. 1 depicts the electron microscopy images of the three different size distributions. Lithiation of these materials was explored by reacting V2O5 with n-butyllithium;20 chemical lithiation has been shown to parallel the phase progression achieved during electrochemical lithiation with high fidelity and allows for evaluation of the lithiation process while eliminating confounding factors such as distance from the electrode and the need for three-point contact in the electrolyte–electrode–conductor.13 Table 1 summarizes the findings for three different time intervals of lithiation. Upon 1 min of exposure to the lithiating agent, bulk V2O5 shows the characteristic signs of the initiation of lithiation: the interior of the sample retains a pristine V2O5 character, whereas the surface shows indications of nucleation of the α-phase. In contrast, for the V2O5 nanowires the core is transformed to the α-phase, whereas the surface shows indications of nucleation of the ε-phase. The particles with the smallest dimensions, the nanoplatelets, appear to be homogeneously lithiated to the ε-phase. Upon 5 min of chemical lithiation, the bulk samples show a homogeneous α-phase within the core and the surface. For the intermediate size particles, the nanowires, the core is still primarily in the α-phase, whereas the surfaces of the nanowires show signs of ε- and δ-phases. The nanoplatelets with the smallest dimensions show clear signs of the Li-rich ε′-phase. Finally, upon exposure to the lithiating agent for 30 min, the bulk sample shows a core that is completely transformed to the α-phase and a surface with some characteristic signs of the ε-phase. The several hundred nanometer wide nanowires show an interior that is a mix of α- and ε-phases and the nanowire surface is completely transformed to the ε-phase. The smallest particles, the nanoplatelets, are homogeneously transformed to the δ-phase in this time period.19 These observations, which are summarized in Table 1, clearly illustrate the pronounced influence of particle size on both (i) the kinetics of lithiation and intercalation-induced phase transformations and (ii) phase separation and homogeneity. The α-phase can be readily formed upon the initial lithiation of V2O5; however, subsequent phases with higher Li content are stabilized by nucleation and growth through a two-phase regime.21 There is a monotonic increase in the kinetics of the intercalation-induced phase transformations with decreasing particle size. For the same elapsed time, the smaller particles progress to significantly more Li-rich phases. The particles with the smallest dimensions, the nanoplatelets, show distinctively different behavior which is characterized by homogeneous lithiation without phase separation. Phase separation is clearly size dependent for this system, which shows a pronounced role of dimensionality in modulating Li-ion insertion and extraction. However, the mesoscopic mechanism underpinning such phenomena, which is expected to be widely generalizable to other phase-separating cathode materials, remains to be determined and will indeed be a primary focus of this article. In order to model chemical lithiation, the assumption of a constant global Li-ion flux is most realistic and such a formalism has been used in this work.
| Reaction time interval | Morphology | Interior composition (LixV2O5) | Surface (LixV2O5) | Phase separation |
|---|---|---|---|---|
| 1 minute | Bulk (1–10 μm) | V2O5 (x ∼ 0) | α (x < 0.1) | Yes |
| Nanowires (150–250 nm) | α (x < 0.1) | ε (0.35 < x < 0.8) | Yes | |
| Nanoplatelets (20–50 nm) | ε (0.35 < x < 0.8) | ε (0.35 < x < 0.8) | No | |
| 5 minutes | Bulk (1–10 μm) | α (x < 0.1) | α (x < 0.1) | No |
| Nanowires (150–250 nm) | α (x < 0.1) | ε (0.35 < x < 0.8) + δ (0.88 < x < 1.0) | Yes | |
| Nanoplatelets (20–50 nm) | ε′ (x > 0.35) | ε′ (x > 0.35) | No | |
| 30 minutes | Bulk (1–10 μm) | α (x < 0.1) | α (x < 0.1) + ε (0.35 < x < 0.8) | Yes |
| Nanowires (150–250 nm) | α (x < 0.1) + ε (0.35 < x < 0.8) | ε (0.35 < x < 0.8) | Yes | |
| Nanoplatelets (20–50 nm) | δ (0.88 < x < 1.0) | δ (0.88 < x < 1.0) | No |
 | ||
| Fig. 1 The three different morphologies of V2O5 listed in Table 1: (a) micron-sized powders denoted as bulk, (b) nanowires with lateral dimensions spanning 150–250 nm and spanning tens of microns in length, and (c) nanoplatelets with thicknesses in the range of 20–50 nm.19 Phase separation is suppressed for the thin nanoplatelets. | ||
Various models have been developed to account for the intercalation-induced phase separation phenomena in electrode materials. Huang et al.22 developed a model that used a flexible sigmoid function to describe the two phase concentration profile with respect to the interface position. In a study by Liu et al.,23 a concentration-dependent diffusion coefficient was introduced in order to describe the sharp Li concentration drop across the interface during lithiation. Zhang et al.24 developed a reaction-controlled diffusion model to account for the bond breaking energy when lithium inserts into c-Si. However, the aforementioned models are either highly empirical and are only applicable in very limited cases, or require sophisticated numerical techniques to track the interface and to re-mesh adaptively.
The phase-field method based on the Cahn–Hilliard equation25,26 has recently found more applications for lithium diffusion in phase-separating materials, as it requires no tracking of the phase interface. Moreover, it can be tailored for different specific materials, given proper free energy expressions from DFT calculations or from the CALPHAD method.27 For a qualitative study, the regular solution model28 is often used to determine the free energy of a binary mixture. The mechanical stress and phase separation in the spherical particles in lithium-ion batteries are discussed in the literature.29,30 Moreover, the reaction and crack propagation have also been intensively studied in the last several years.31–36 On the other hand, reaction-limited models based on the Allen–Cahn equation are employed for the simulation of LiFePO4 nanoparticles37,38 to realize the “domino-cascade” model13 and to explain the suppression of phase separation at high rates.39,40
However, these models are all dealing with single particles and the inter-particle exchange of the Li ions is disregarded. While it is reasonable to assume that single-particle models can reflect multi-particle behaviors in solid-solution systems, they fall short in describing phase-separating systems, as discussed in this article. Ferguson and Bazant developed a porous electrode model, which can describe multi-particle phase-separation behavior.41 However, in their model, each particle is treated as an effective homogeneous solid solution and the intra-particle phase separation shown in Table 1 is not considered. To account for both the intra- and inter-particle phase separation, a network of particles that can both work independently and communicate with each other is needed. Although there are studies in this regard42 the connection between the particles is not explicitly considered. Rather, the electrostatic potential drop and the overall current are controlled at the same time in order to implicitly introduce the coupling of two particles without involving actual lithium transport through the electrolyte or across the particle-to-particle interfaces. In this work, the interaction between the particles is explicitly modeled and simulated. The phase-separation behavior within a multi-particle network is then discussed.
Model
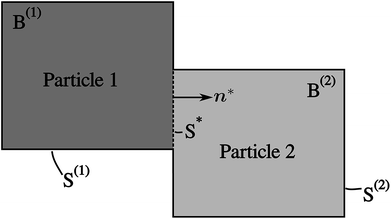
A network consisting of several particles in contact with each other is considered in this model. Its 2D illustration with two particles is shown in Fig. 2. The model consists of Cahn–Hilliard bulk diffusion and the Butler–Volmer surface reaction on the electrode/electrolyte, electrode/electrode surfaces.Diffusion and phase separation in the particles
The lithium diffusion inside each particle p is subject to the Cahn–Hilliard equation
 | (1) |
 | (2) |
Reaction on the electrode/electrolyte interface
On the electrode/electrolyte interface, for simplicity, the reaction
Liely+ + ![[script letter H]](https://www.rsc.org/images/entities/char_e142.gif) − ⇌ Li − ⇌ Li![[script letter H]](https://www.rsc.org/images/entities/char_e142.gif)
| (3) |
![[script letter H]](https://www.rsc.org/images/entities/char_e142.gif) being the host material. The lithium influx is given as
being the host material. The lithium influx is given as| jely→(p) = c(p)sR(p)BV on S(p) | (4) |
 | (5) |
| η(p) = μ(p)/F + Δϕ(p) − VOC | (6) |
Reaction on the electrode/electrode interface
On the electrode/electrode interface of two interconnected particles, the intercalation of lithium from one particle to another can be considered as the occurrence of the following reaction44| Li(1) ⇌ Li(2) | (7) |
 | (8) |
 | (9) |
The parameter  is given by (1 − c(1))−1(1 − c(2))−1. The two particles are considered to be electronically well connected, therefore the overpotential is purely the difference of the lithium chemical potential in the two particles, i.e. η* = (μ(1) − μ(2))/F.
Simulation details
The eqn (1), (4) and (8), together with the initial conditions are solved by the finite element method in three-dimensional space and the backward Euler method in time. In particular, since the Cahn–Hilliard equation is a fourth-order partial differential equation, an additional boundary condition| ∇c(p)·n = 0 on S*∪S(p) | (10) |
In the simulation, the particle network is immersed in a lithium bath with a constant potential. The potential drop Δϕ(p) is kept constant for a complete (de-)lithiation process. Moreover, since the particles are considered to have equal potential, Δϕ(p) is the same for all particles in a single simulation. The simulation parameters are shown in Table 2.
| Description | Symbol | Value | Unit | Sources |
|---|---|---|---|---|
| Gas constant | R | 8.32 | J mol−1 K−1 | — |
| Absolute temperature | T | 283 | K | — |
| Faraday’s constant | F | 96![[thin space (1/6-em)]](https://www.rsc.org/images/entities/char_2009.gif) 485 485 |
C mol−1 | — |
| Maximum concentration | cmax | 2.28 × 10⁴ | mol m−3 | 47 |
| Symmetry factor | β | 0.5 | — | 39 |
| Diffusivity | D | 1 × 10⁻¹² | cm2 s−1 | 47 |
| Length scale | L | 1 | μm | — |
| Phase parameter | χ | 2.5 | — | 48 |
| Interfacial parameter | κ | J m2 mol−1 | — | |
| Single reaction step time | τ0 | 1 | s | 47 |
| Lithium activity in electrolyte | aely | 1 | — | 39 |
| Open circuit potential | VOC | 3.4 | V | 47 |
Results and discussion
Phase separation during (de-)lithiation
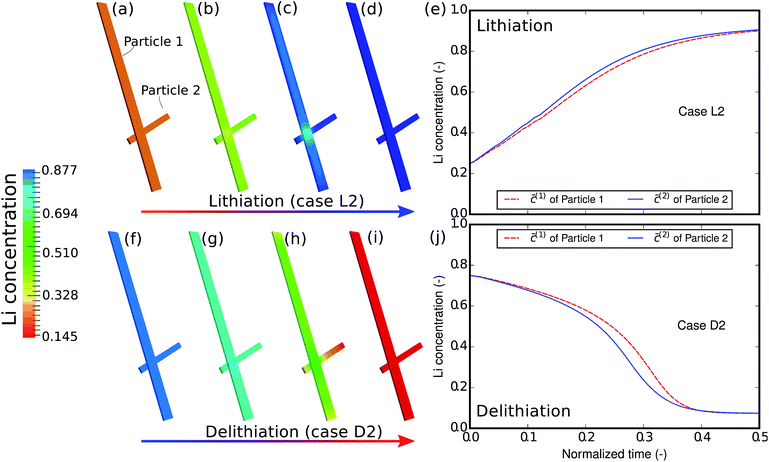
As the first example, delithiation and lithiation in a two-particle system are investigated. Fig. 3a–d depict scanning transmission X-ray microscopy (STXM) maps of the phase separation of Li-rich and Li-poor domains between two connected V2O5 particles that have been chemically lithiated in a lithium bath with a constant potential. The Li content was deduced based on methodology discussed in previous work.5 Sharp heterogeneity is evident across the interface. In the simulation, the particle geometries are taken from the two V2O5 particles in Fig. 3; the larger particle (particle 1) has a size of 20 μm × 0.6 μm × 0.2 μm and the smaller one (particle 2) has a size of 6.8 μm × 0.3 μm × 0.2 μm. The finite element background mesh is quadratic, instead of linear, to capture the interface with fewer elements. The integration points are generated based on an adaptive subdivision to level 3 from the original Cartesian mesh, as shown in Fig. 3e and f. The simulation conditions for the different cases are given in Table 3. The two particles have homogeneous initial concentrations. Upon application of a constant potential drop on the particle surfaces, lithium will flow into/out of the particle during the reaction. At the same time, since the two particles are not lithiated at the same pace due to—for instance—different particle sizes, exchange of lithium across the particles also occurs. In this section, for the sake of convenience, the results of concentration and time are given in their normalized form. Concentration is normalized with respect to the maximum concentration cmax, as mentioned previously. Time is normalized by![[t with combining tilde]](https://www.rsc.org/images/entities/i_char_0074_0303.gif) = tD/L02. Fig. 4 shows a sequence of contour plots of the two-particle system during lithiation (a–d) and delithiation (f–i). During lithiation, instead of being lithiated concurrently, the smaller particle is fully lithiated far before the other particle as shown in Fig. 4c, exhibiting behavior similar to a particle-by-particle transformation. Moreover, the phase change starts from the joint between the two particles (Fig. 4b), indicating that the smaller particle will further extract lithium from the neighboring particle, resulting in an even larger concentration difference and a faster transformation of the smaller particle.42 This “winner-takes-all” phenomenon is also observed during delithiation: the smaller particle accelerates its delithiation at the cost of the larger one. Fig. 4e and j show plots of the average concentration
= tD/L02. Fig. 4 shows a sequence of contour plots of the two-particle system during lithiation (a–d) and delithiation (f–i). During lithiation, instead of being lithiated concurrently, the smaller particle is fully lithiated far before the other particle as shown in Fig. 4c, exhibiting behavior similar to a particle-by-particle transformation. Moreover, the phase change starts from the joint between the two particles (Fig. 4b), indicating that the smaller particle will further extract lithium from the neighboring particle, resulting in an even larger concentration difference and a faster transformation of the smaller particle.42 This “winner-takes-all” phenomenon is also observed during delithiation: the smaller particle accelerates its delithiation at the cost of the larger one. Fig. 4e and j show plots of the average concentration ![[c with combining macron]](https://www.rsc.org/images/entities/i_char_0063_0304.gif) (p) in each particle during lithiation and delithiation. The average concentration
(p) in each particle during lithiation and delithiation. The average concentration ![[c with combining macron]](https://www.rsc.org/images/entities/i_char_0063_0304.gif) (p) is computed through the equation
(p) is computed through the equation
 | (11) |
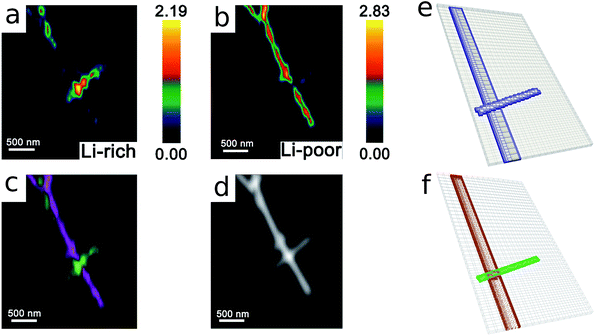 | ||
| Fig. 3 Compositional mapping of phase separation across two orthogonally connected nanowires based on X-ray microscopy and numerical representation. (a) and (b) map the spatial localization of Li-rich and Li-poor domains, respectively. (c) depicts an overlay of the two domains and (d) is an integrated greyscale intensity image. The assignments of the extent of lithiation are based on methodology discussed in detail in previous work.5 (e) illustrates the Cartesian background mesh (in black) and the adaptively subdivision (in blue), where the former is the computing grid and the latter is only for calculating the volume integration points. The surface integration points are shown in (f), where the contacting interface S* is shown in magenta and the other surfaces, S(1) and S(2), exposed to the electrolyte are in brown and green, respectively. | ||
 . The overpotential is chosen in the simulation so that the lithiation/delithiation will continue until a certain concentration is reached. For a detailed discussion interested readers are referred to the work of Zhao et al.33 and Stein et al.43
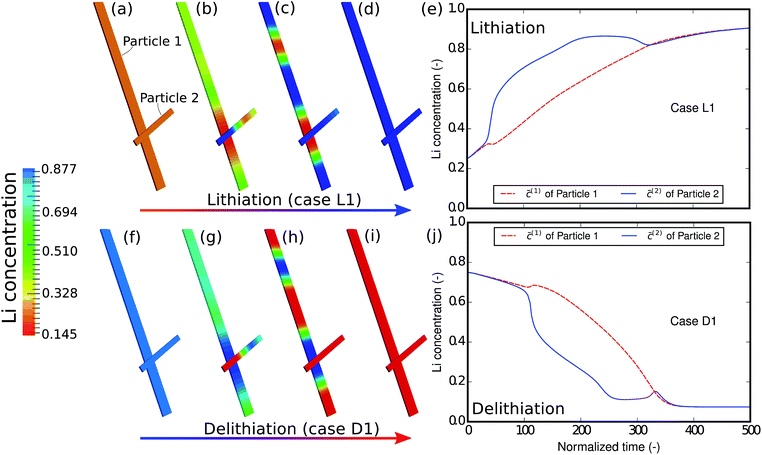 | ||
| Fig. 4 Contour plots and average concentration in each particle during (a–e) lithiation and (f–j) delithiation for case L1/D1. The simulation conditions for the cases are listed in Table 3. The smaller particle experiences fast phase transformation at the cost of the interconnected particle. The phase separation during delithiation is more significant than during lithiation. (-) in this figure as well as in the following figures stands for the fact that both concentration and time are given in their normalized form. Concentration is normalized with respect to the maximum concentration cmax and time is normalized with respect to L02/D. | ||
The concentration in the two particles bifurcates towards two phases when entering the spinodal region. Curiously, despite the symmetric conditions in the simulation (as shown in Table 3), the fact that delithiation is remarkably slower than lithiation at the beginning indicates that the reaction is non-symmetric. By considering the Butler–Volmer equation (eqn (3)) the reaction is biased by the chemical activity coefficient of the transition state γA, which suggests that as lithium occupies more surface sites, it becomes more energetically expensive for the reactants to transit over the activation barrier, thus the reaction becomes slower.38 The initial concentration in the delithiation process is much higher than that in the lithiation process, therefore the reaction is much slower in the beginning. However, as time goes on, the reaction rate of the delithiation process overtakes that of the lithiation process since the latter is gradually saturated. For the same reason, the concentration difference between the two particles is larger in the delithiation process than in the lithiation process. In other words, the phase separation is more pronounced during delithiation than during lithiation.40
The phase-separation behavior can also be influenced by the reaction rate. Fig. 5 shows the contour plots and the average concentration in the two particles during lithiation and delithiation when the reaction is much faster than the aforementioned case. This is realized numerically by varying the parameter c(p)s for computational convenience. Experimentally, this can be achieved by a surface treatment on the particle. Alternatively, one can also change the potential difference to attain faster lithiation. From the contour plots we can no longer observe phase separation inside each particle but only a solid-state solution phase. This can be explained by the fact that the influx is so large and quick that it hardly allows particles to equilibrate. Moreover, Fig. 5e and j show that the two particles are almost (de-)lithiated at the same speed, indicating that inter-particle phase separation is also suppressed by fast kinetics of insertion. The phase transformation has been shifted from the particle-by-particle pattern to a concurrent one.12 It is also observed that, in this case, the concentration difference between the two particles during delithiation is still larger than that during lithiation, which is similar to the previous case.
In the next example, the influence of the interconnectivity between the particles on the phase separation is studied. Fig. 6 shows the simulation results of the scenario where the interaction between the particles is absent. From the contour plots of different time instances we can still observe phase separation in each particle, a phenomenon very much similar to that in the case of D1/L1. However, a more careful comparison between Fig. 4 and 6 shows that only in a well connected network the lithium redistribution starts from the junction of the particles (Fig. 4c), which is also observed in Fig. 3a and b. Moreover, the concentration plots show that, compared to the D1/L1 case, the difference between the two particles is much smaller than that in the D3/L3 case and the two particles are (de-)lithiated almost simultaneously with a slight difference due to the particle size. This indicates that apart from the geometric variations the ionic connectivity also contributes to the phase heterogeneity: the better the connectivity, the stronger the phase heterogeneity. The well established connections between the particles offer a fast pathway for the lithium to equilibrate, allowing the reduction of the phase interfaces within the particle.
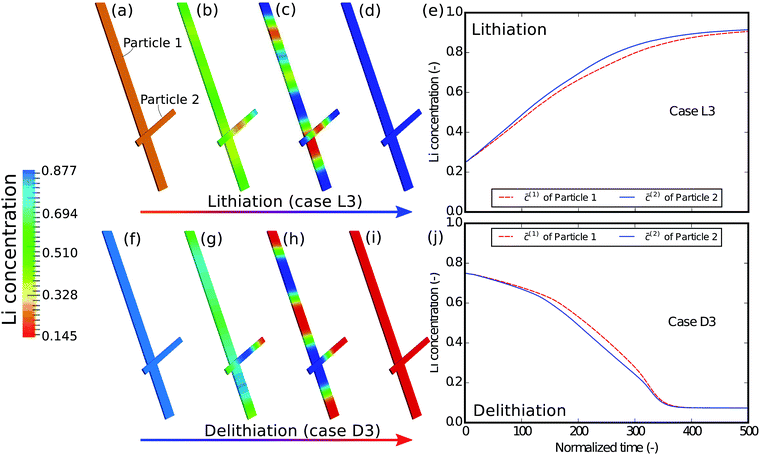 | ||
| Fig. 6 Contour plots and averaged concentration in each particle during (a–e) lithiation and (f–j) delithiation in case L3/D3, where the interconnectivity between the particles is absent. The particles are lithiated independently and almost concurrently, which is very different from that in Fig. 4, indicating that a single particle model sometimes cannot exhibit the behavior of a network of multiple particles. | ||
Relaxation from the non-equilibrium solid-solution phase
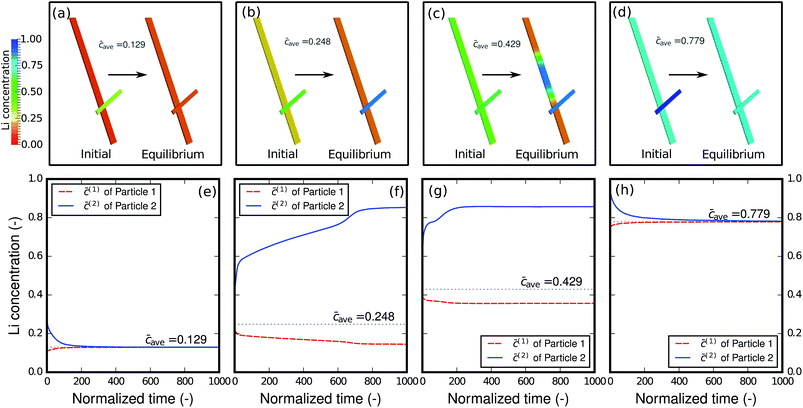
As shown in the previous example and discussed in the literature,49 at high-rate cycling a non-equilibrium solid-solution is formed with slight compositional variations in different particles. It is thus of interest to evaluate how the relaxation will proceed when the network of particles is charged at different states-of-charge (SOC): will it stay as a solid-solution phase, or will it decompose into different phases? Fig. 7 shows the relaxation of the two-particle network from the initial solid-solution phase with different overall average concentrations caves, which represent different SOC. Single-phase diffusion tends to occur when the average amount of lithium is low, as shown in Fig. 7a and e. The particle with higher concentration is willing to bestow lithium to the neighboring particle and a homogenized phase forms across the particles. However, as the lithium content increases to the spinodal region, as shown in Fig. 7b and f, the particle with higher concentration starts to acquire lithium from the neighboring particle in order to globally minimize the energy in the complete network. As a result, instead of blending into one mixture, the concentration in the two particles bifurcates and two distinct phases form. It is worth mentioning that blocking the connection between the particles will prevent the lithium from moving from one particle to another and global energy minimization will not be possible. Thus, inter-particle phase separation will not be observed. If a Li-rich phase already exists in one particle as shown in Fig. 7c and g, a phase transformation will proceed in the other particle, and two phases inside the particle will co-exist. Finally, a homogenized phase appears again when the average concentration is large enough to be out of the spinodal region, as shown in Fig. 7d and h.Size effect
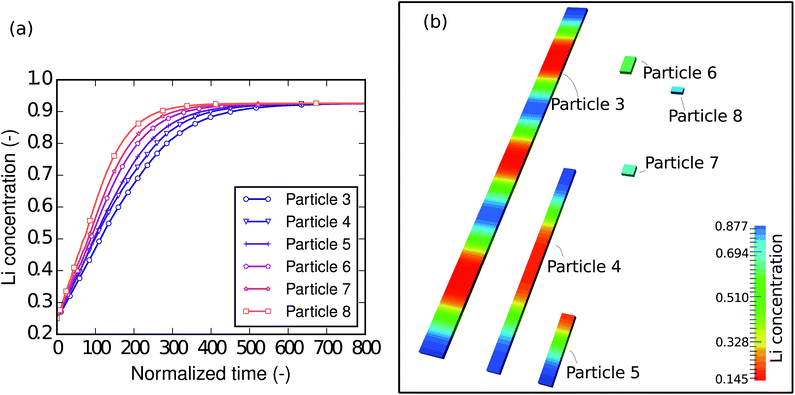
To understand the size-dependent behavior of the phase separation, particles with different sizes were investigated. The particle sizes are listed in Table 4. The particles were immersed and sparsely distributed in a large lithium bath with a constant potential so that they are neither connected to nor influenced by each other. Fig. 8a shows plots of the respective concentration evolution in each particle. Although the particles are in the same environment, the time for each particle to be fully lithiated varies substantially. In other words, for the same period of time, different particles achieve different levels of lithiation. Apparently, the time for the particle to be fully lithiated increases with increasing particle size. The larger particles have smaller surface-area-to-volume ratios (as shown in Table 4), so they expose less surface per unit volume for the reaction. This explains the “lithium hot-spots” in the network of particles with large size variations.| Particle | Dimensions (μm3) | S/V (μm−1) |
|---|---|---|
| 3 | 20 × 0.6 × 0.3 | 10.100 |
| 4 | 10 × 0.3 × 0.3 | 13.533 |
| 5 | 3 × 0.3 × 0.3 | 14.000 |
| 6 | 1 × 0.3 × 0.3 | 15.333 |
| 7 | 0.5 × 0.3 × 0.3 | 17.333 |
| 8 | 0.1 × 0.3 × 0.3 | 33.333 |
Moreover, a closer check into the intermediate state of each particle shows that the intra-particle phase-separation behavior is also size dependent. Fig. 8b shows the concentration distribution in the particles at the normalized time instant ![[t with combining tilde]](https://www.rsc.org/images/entities/i_char_0074_0303.gif) = 100, when all of the particles are lithiated by around 50% of the total capacity. In the larger particles (3, 4 and 5), phase separation occurs. In particle 3, we can even see patterns of repeated Li-rich and Li-poor phase pairs. It is also worth noting that Li-rich phases always initiate from the ends of the bar-like particles, since there are local high surface-area-to-volume ratios. In the smaller particles (6, 7 and 8), only a solid-solution phase exists. This can be explained by the following two points. Firstly, in smaller particles the reaction-to-diffusion rate is larger, therefore phase separation is more likely to be suppressed, which has been discussed in the D2/L2 case. Secondly, in the small particles, the interfacial mismatch cannot be compensated internally, allowing the interface to grow on to the free surface, thus suppressing phase separation. Based on previous work48 it is also reasonable to predict that, when the elastic strain is taken into account, the suppression of phase separation will occur even more easily. Since the small particles are almost homogeneous, it is easy to tell that they are at different lithiation stages—the smallest particle is lithiated the most. This agrees very well with Table 1: nanocrystals do not phase separate and medium size nanowires show clear phase separation.
= 100, when all of the particles are lithiated by around 50% of the total capacity. In the larger particles (3, 4 and 5), phase separation occurs. In particle 3, we can even see patterns of repeated Li-rich and Li-poor phase pairs. It is also worth noting that Li-rich phases always initiate from the ends of the bar-like particles, since there are local high surface-area-to-volume ratios. In the smaller particles (6, 7 and 8), only a solid-solution phase exists. This can be explained by the following two points. Firstly, in smaller particles the reaction-to-diffusion rate is larger, therefore phase separation is more likely to be suppressed, which has been discussed in the D2/L2 case. Secondly, in the small particles, the interfacial mismatch cannot be compensated internally, allowing the interface to grow on to the free surface, thus suppressing phase separation. Based on previous work48 it is also reasonable to predict that, when the elastic strain is taken into account, the suppression of phase separation will occur even more easily. Since the small particles are almost homogeneous, it is easy to tell that they are at different lithiation stages—the smallest particle is lithiated the most. This agrees very well with Table 1: nanocrystals do not phase separate and medium size nanowires show clear phase separation.
Conclusion
In this study, a model was developed taking into account lithium transport and phase separation inside and across interconnected electrode particles. The model was simulated in 3D with the B-spline based finite cell method. From the representative examples, the following insights are gained.• In phase-separating materials, particles with a slight advance during lithiation and delithiation at the beginning will strengthen their advance at the cost of the neighboring particle, exhibiting “winner-takes-all” behavior.
• Phase separation—both inside a single particle and across a well connected particle network—is suppressed by rapid intercalation reactions. Moreover, the influence of rapid reactions is more profound during lithiation than during delithiation, representing a non-symmetric reaction.
• Phase separation upon relaxation largely depends on the lithiation state. When the particle network is only slightly or very deeply charged, the homogeneous phase tends to establish itself; when the overall lithiation concentration is in the spinodal region, phase separation is bound to happen.
• Each particle in a network behaves independently as a single particle when the current is large or the ionic connectivity between particles is weak. In either case, the inter-particle mass transfer is not fast enough to equilibrate globally.
• Smaller particles are (de-)lithiated faster than larger particles due to their large surface-area-to-volume ratios. Furthermore, the smaller the particles, the less likely that phase separation inside them will occur.
All of these observations show that, in order to prevent phase separation and the consequent current “hot-spots” in an interconnected particle network, not only particle sizes but also the size variation in electrodes composed of phase-separating materials ought to be made as small as possible.
Conflicts of interest
There are no conflicts to declare.Acknowledgements
The authors gratefully acknowledge the computing time granted on the Hessian High Performance Computer “Lichtenberg”. The author Xu would particularly like to thank the Adolf Messer Foundation for awarding her the Adolf Messer Prize and for financial support. Texas A&M researchers acknowledge support from the National Science Foundation under DMR 1504702. LDJ acknowledges support from the Graduate Research Fellowship under Grant No. 1252521.References
- C. Daniel and J. O. Besenhard, Handbook of Battery Materials, Wiley-VCH, Weinheim, 2nd edn, 2011 Search PubMed.
- M. T. McDowell, I. Ryu, S. W. Lee, C. Wang, W. D. Nix and Y. Cui, Adv. Mater., 2012, 24, 6034–6041 CrossRef CAS PubMed.
- A. Van der Ven, C. Marianetti, D. Morgan and G. Ceder, Solid State Ionics, 2000, 135, 21–32 CrossRef CAS.
- W.-J. Zhang, J. Power Sources, 2011, 196, 877–885 CrossRef CAS.
- L. R. D. Jesus, G. A. Horrocks, Y. Liang, A. Parija, C. Jaye, L. Wangoh, J. Wang, D. A. Fischer, L. F. J. Piper, D. Prendergast and S. Banerjee, Nat. Commun., 2016, 7, 12022 CrossRef PubMed.
- J.-J. Xu, Q.-C. Liu, Y. Yu, J. Wang, J.-M. Yan and X.-B. Zhang, Adv. Mater., 2017, 29, 1606552 CrossRef PubMed.
- H. Zhong, J. Wang, F. Meng and X. Zhang, Angew. Chem., Int. Ed., 2016, 55, 9937–9941 CrossRef CAS PubMed.
- F. Meng, H. Zhong, D. Bao, J. Yan and X. Zhang, J. Am. Chem. Soc., 2016, 138, 10226–10231 CrossRef CAS PubMed.
- H.-X. Zhong, K. Li, Q. Zhang, J. Wang, F.-L. Meng, Z.-J. Wu, J.-M. Yan and X.-B. Zhang, NPG Asia Mater., 2016, 8, e308 CrossRef CAS.
- J. Wang, H.-X. Zhong, Z.-L. Wang, F.-L. Meng and X.-B. Zhang, ACS Nano, 2016, 10, 2342–2348 CrossRef CAS PubMed.
- J. Rohrer and K. Albe, J. Phys. Chem. C, 2013, 117, 18796–18803 CAS.
- Y. Li, F. El Gabaly, T. R. Ferguson, R. B. Smith, N. C. Bartelt, J. D. Sugar, K. R. Fenton, D. A. Cogswell, A. L. D. Kilcoyne, T. Tyliszczak, M. Z. Bazant and W. C. Chueh, Nat. Mater., 2014, 13, 1149–1156 CrossRef CAS PubMed.
- C. Delmas, M. Maccario, L. Croguennec, F. Le Cras and F. Weill, Nat. Mater., 2008, 7, 665–671 CrossRef CAS PubMed.
- N. A. Chernova, M. Roppolo, A. C. Dillon and M. S. Whittingham, J. Mater. Chem., 2009, 19, 2526–2552 RSC.
- M. S. Whittingham, Chem. Rev., 2004, 104, 4271–4302 CrossRef CAS PubMed.
- C. Satto, P. Sciau, E. Dooryhee, J. Galy and P. Millet, J. Solid State Chem., 1999, 146, 103–109 CrossRef CAS.
- J. Galy, J. Solid State Chem., 1992, 100, 229–245 CrossRef CAS.
- R. J. Cava, A. Santoro, D. W. Murphy, S. M. Zahurak, R. M. Fleming, P. Marsh and R. S. Roth, J. Solid State Chem., 1986, 65, 63–71 CrossRef CAS.
- G. A. Horrocks, M. F. Likely, J. M. Velazquez and S. Banerjee, J. Mater. Chem. A, 2013, 1, 15265–15277 CAS.
- M. S. Whittingham and M. B. Dines, J. Electrochem. Soc., 1977, 124, 1387–1388 CrossRef CAS.
- G. A. Horrocks, E. J. Braham, Y. Liang, L. R. De Jesus, J. Jude, J. M. Velázquez, D. Prendergast and S. Banerjee, J. Phys. Chem. C, 2016, 120, 23922–23932 CAS.
- S. Huang, F. Fan, J. Li, S. Zhang and T. Zhu, Acta Mater., 2013, 61, 4354–4364 CrossRef CAS.
- X. H. Liu, L. Zhong, S. Huang, S. X. Mao, T. Zhu and J. Y. Huang, ACS Nano, 2012, 6, 1522–1531 CrossRef CAS PubMed.
- X. Zhang, S. W. Lee, H.-W. Lee, Y. Cui and C. Linder, Extreme Mech. Lett., 2015, 4, 61–75 CrossRef.
- J. W. Cahn and J. E. Hilliard, J. Chem. Phys., 1958, 28, 258–267 CrossRef CAS.
- J. W. Cahn, Acta Metall., 1961, 9, 795–801 CrossRef CAS.
- L.-Q. Chen, Annu. Rev. Mater. Res., 2002, 32, 113–140 CrossRef CAS.
- E. Guggenheim, Mixtures: The Theory of the Equilibrium Properties of Some Simple Classes of Mixtures Solutions and Alloys, Clarendon Press, 1952 Search PubMed.
- M. Huttin and M. Kamlah, Appl. Phys. Lett., 2012, 101, 133902 CrossRef.
- E. Bohn, T. Eckl, M. Kamlah and R. McMeeking, J. Electrochem. Soc., 2013, 160, A1638–A1652 CrossRef CAS.
- C. V. Di Leo, E. Rejovitzky and L. Anand, Int. J. Solids Struct., 2015, 67–68, 283–296 CrossRef CAS.
- C. Miehe, H. Dal, L.-M. Schänzel and A. Raina, Int. J. Numer. Meth. Eng., 2016, 106, 683–711 CrossRef.
- Y. Zhao, B.-X. Xu, P. Stein and D. Gross, Comput. Meth. Appl. Mech. Eng., 2016, 312, 428–446 CrossRef.
- B.-X. Xu, Y. Zhao and P. Stein, GAMM-Mitteilungen, 2016, vol. 39, pp. 92–109 Search PubMed.
- M. Klinsmann, D. Rosato, M. Kamlah and R. M. McMeeking, J. Electrochem. Soc., 2016, 163, A102–A118 CrossRef CAS.
- P. Barai and P. P. Mukherjee, J. Electrochem. Soc., 2016, 163, A1120–A1137 CrossRef CAS.
- G. K. Singh, G. Ceder and M. Z. Bazant, Electrochim. Acta, 2008, 53, 7599–7613 CrossRef CAS.
- M. Z. Bazant, Acc. Chem. Res., 2013, 46, 1144–1160 CrossRef CAS PubMed.
- P. Bai, D. A. Cogswell and M. Z. Bazant, Nano Lett., 2011, 11, 4890–4896 CrossRef CAS PubMed.
- J. Lim, Y. Li, D. H. Alsem, H. So, S. C. Lee, P. Bai, D. A. Cogswell, X. Liu, N. Jin, Y.-s. Yu, N. J. Salmon, D. A. Shapiro, M. Z. Bazant, T. Tyliszczak and W. C. Chueh, Science, 2016, 353, 566–571 CrossRef CAS PubMed.
- T. R. Ferguson and M. Z. Bazant, J. Electrochem. Soc., 2012, 159, A1967–A1985 CrossRef CAS.
- B. Orvananos, H.-C. Yu, A. Abdellahi, R. Malik, C. P. Grey, G. Ceder and K. Thornton, J. Electrochem. Soc., 2015, 162, A965–A973 CrossRef CAS.
- P. Stein, Y. Zhao and B.-X. Xu, J. Power Sources, 2016, 332, 154–169 CrossRef CAS.
- N. Sato, Electrochemistry at Metal and Semiconductor Electrodes, Elsevier Science, Amsterdam, 1998 Search PubMed.
- Y. Zhao, D. Schillinger and B.-X. Xu, J. Comput. Phys., 2017, 340, 177–199 CrossRef CAS.
- R. L. Taylor, FEAP – Finite Element Analysis Program, 2014 Search PubMed.
- B. Orvananos, T. R. Ferguson, H.-C. Yu, M. Z. Bazant and K. Thornton, J. Electrochem. Soc., 2014, 161, A535–A546 CrossRef CAS.
- Y. Zhao, P. Stein and B.-X. Xu, Comput. Meth. Appl. Mech. Eng., 2015, 297, 325–347 CrossRef.
- H. Liu, F. C. Strobridge, O. J. Borkiewicz, K. M. Wiaderek, K. W. Chapman, P. J. Chupas and C. P. Grey, Science, 2014, 344, 1252817 CrossRef PubMed.
| This journal is © The Royal Society of Chemistry 2017 |

