 Open Access Article
Creative Commons Attribution 3.0 Unported Licence
Preparation and characterization of Co and Ga2O3-codoped ZnS and ZnSe bulk ceramics
Yong Pan ,
Li Wang*,
ShuFeng Li,
DongWen Gao and
XiaoWei Han
College of Applied Sciences, Beijing University of Technology, Beijing, 100124, China. E-mail: lwang.1@bjut.edu.cn; Tel: +86-10-67392198
First published on 1st November 2017
Abstract
The bulk ceramics (Co)x(Ga2O3)0.6−x(ZnS/Se)0.4 (x = 0.1, 0.3 and 0.5) were fabricated via a solid state reaction in a high temperature pipe boiler at temperatures ranging from 1000 to 1400 °C. The structure, optical, valence and morphological properties were determined by XRD, XPS, Raman spectroscopy, SEM, UV-vis spectroscopy and IR absorption spectroscopy. The impressive effect of the sintering temperature on the doping elements was investigated, and the optimum sintering temperature in the range 1000–1200 °C was revealed, by analysis of the mass loss, molar ratio and shrinkage rate of (Co)x(Ga2O3)0.6−x(ZnS/Se)0.4. The zinc-blende structure of the bulk ceramic, and optimum doping ratio of (Co)0.5(Ga2O3)0.1(ZnS/Se)0.4, was confirmed by XRD and Raman spectroscopy. A broad and continuous absorption band from visible to infrared wavelengths was demonstrated for (Co)0.5(Ga2O3)0.1(ZnS/Se)0.4. The +2 and +3 valences of Co and Ga in the materials was proved by XPS. The surface morphology of the films was visualised by SEM and exhibited excellence when sintering temperatures were in the range 1000–1200 °C. The bulk ceramics (Co)x(Ga2O3)0.6−x(ZnS/Se)0.4 show a promising potential for future applications.
1. Introduction
Group II–VI and III–V transition metal (TM) doped chalcogenide materials, especially ZnS and ZnSe crystals, have received extensive attention over the years because of their faster optical response time, wider transparency range in the mid-infrared, low optical loss, low phonon energy, high linear or nonlinear refractive index, good chemical stability and unique photosensitive properties, which are widely used in sensors, optical thin films and absorption in the mid-infrared region.1–8 Co has abundant absorption and emission energy levels and ferromagnetism, which makes it attractive among other transition metals. In addition, the semiconductor oxide Ga2O3 has a large energy gap of 4.9 eV for its direct band-gap, which is very suitable for emission, or to stimulate the spectrum of ultraviolet, visible and near infrared. Therefore, many researchers are focused on the preparation and relevant properties of these materials such as Co doped in ZnS,9–11 Ga doped in ZnSe,12–14 Co–Ga co-doped in ZnO,15 Co–Fe co-doped in ZnS/Se,16 Ga–Mn co-doped in ZnO,17 and the diluted magnetic semiconductors ZnCoO.18,19 But, most of the previous work was concerned with thin films, crystals, quantum dots, nano-wires or nano-particles, and less so with the bulk material. There are still many unsolved problems with these materials, such as the quality of raw material, the growth conditions and the impact of the dopant. In fact, bulk ceramics are also valuable materials for research, to understand the relationship between the bulk and thin films or other nano-materials. Furthermore, the effect of the different performance of the bulk and the optimization strategies should be discussed. Recently, various techniques have been used to prepare films such as pulsed laser deposition (PLD),20 molecular beam epitaxy (MBE),21 and metal organic chemical vapor deposition (MOCVD).22 In short, it is important to fabricate high quality raw materials and thin films.In this paper, a material with Co–Ga2O3 co-doped in bulk ceramic ZnS/Se, (Co)x(Ga2O3)0.6−x(ZnS/Se)0.4 (x = 0.1, 0.3 and 0.5) is reported for the first time; the material was prepared via a solid state reaction in a high temperature pipe boiler. The influence of the temperature on the preparation, structure and spectral characteristics was investigated for the (Co)x(Ga2O3)0.6−x(ZnS/Se)0.4 bulk ceramic. The main motivations of our paper can be summarized in two points: investigating the relationship between the preparation of target or bulk ceramics and the future characteristics of the film, and acquiring the optimum preparation methods to achieve excellent doping in the material. Our research will be an important reference for related research areas.
2. Experimental
The (Co)x(Ga2O3)0.6−x(ZnS/Se)0.4 bulk ceramics were prepared via a solid state reaction in a high temperature pipe boiler. The raw ceramic bulk ZnS (99.99%), Co (99.99%) and Ga2O3 (99.999%) powders were weighed using an electronic balance according to the stoichiometric values. The powder was manually ground for about 2 h in an agate mortar, and mechanically ball-milled for about 6 h three times, with respect to the degree of their mixed and granular size. The mixed powder was pressed in a Φ20 mm cylindrical mould under 10 MPa pressure for 15 min and then the preparation of the cylindrical bulk material was complete. The bulk was put in a tube furnace at 800–1400 °C for 6–10 h. The process described above was used to make all six stoichiometric (Co)x(Ga2O3)0.6−x(ZnS/Se)0.4 materials. Also, an Ar atmosphere was pumped into the high temperature pipe boiler, eliminating the effect of oxygen in sintering.The mass loss and size shrinkage rate of the bulk materials were recorded before and after sintering, and the relationship between the sintering temperature, mass loss and size shrinkage rate was calculated. The change of constituents in the bulk materials was measured by an X-ray fluorescence spectrometer (PANalytical Magix PW2403). The structures of the (Co)x(Ga2O3)0.6−x(ZnS/Se)0.4 bulk ceramics were analyzed by XRD (BRUKER D8 ADVANCE), and Raman spectroscopy (Horiba Jobin Yvon T6400 spectrograph) at an excitation wavelength of 325 nm. The optical properties of the bulk ceramics were examined by UV-vis and near-infrared absorption spectroscopy using a U-4100 spectrometer. The valence state of Co and Ga was tested by XPS (X-ray photoelectron spectroscopy using Escalab 250 Thermo). The surface morphology of the thin film was imaged by SEM (JEOLJSM 6500F).
3. Results and discussion
3.1. The effect of sintering temperature
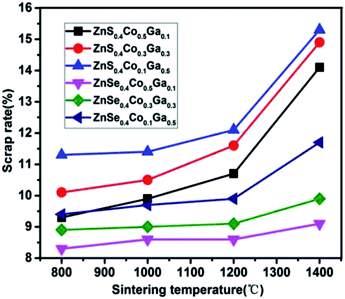
The mass loss rate of the (Co)x(Ga2O3)0.6−x(ZnS/Se)0.4 ceramic bulk depends on the sintering temperature, ranging from 800 °C to 1400 °C, as shown in Fig. 1. The quality of the material changed to some extent before and after sintering. The raw material powder became the target ceramic by a process of weighing, grinding, ball-milling, pressing and sintering. The mass loss rate is calculated by the following formula:
 | (1) |
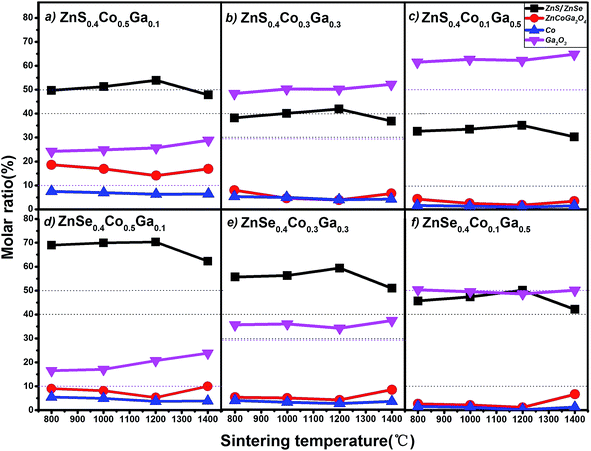
The relationship between sintering temperature and molar ratio of the (Co)x(Ga2O3)0.6−x(ZnS/Se)0.4 ceramic bulks is shown in Fig. 2. The variation of the ratio between the components in the material is obtained from the graph, which shows ZnS/Se, ZnCoGa2O4, Co and Ga2O3. In general, the molar ratio of ZnS decreases, while the molar ratio of Ga2O3 increases. Co and ZnCoGa2O4 exhibit a trend of decline with the reduction of Co content and rise of Ga2O3 content, confirming the rule and analysis of Fig. 1. From Fig. 2(a), the molar ratio of ZnS is quite a bit higher than the Co content and the molar ratio of Co is reduced by about 30%. This demonstrates that Co has been doped into ZnS and obtained a better absorbing power in the chalcogenide. What’s more, the content of each component is stabilized in the range 800–1200 °C, when the stoichiometric ratio has a higher doping of Co and lower doping of Ga2O3, namely (Co)x(Ga2O3)0.6−x(ZnS/Se)0.4. From Fig. 2(b) we find that the content of Ga2O3 has elevated dramatically and that of ZnS has decreased to a nearly normal mixing ratio, which explains the absorption efficiency of Co dropping with the rise of the doping content of Ga2O3. The content of each component remains stable in the range 1000–1200 °C. Fig. 2(c) shows that the molar ratio of Co is relatively low because of the higher absorption and lower doping concentration of Co ions in the (Co)0.5(Ga2O3)0.1(ZnS/Se)0.4 ceramic. In addition, the content of ZnCoGa2O4 is reduced by the change in Co concentration. An important effect with the change of Ga content in our materials was also confirmed by this result. The content of each component remains stable in the range 1000–1200 °C.
Fig. 2(d) shows a high molar ratio of ZnSe when the stoichiometric ratio has a higher doping of Co and lower doping of Ga2O3 and (Co)0.5(Ga2O3)0.1(ZnS/Se)0.4. This situation indicates that ZnSe has a higher absorption than ZnS in terms of the Co element in the chalcogenide, which is reflected by the fact that the content of each component remains stable in the range 800–1000 °C. The trend, similar to that of ZnS above, is shown in Fig. 2(e), but the rate and range of the descent of the molar ratio of ZnSe are higher than ZnS in the same conditions and stoichiometry. This fact proves that the absorption properties of ZnSe are higher than those of ZnS in terms of doping ions. Besides, the increased stability also is reflected by the graph in the range 800–1000 °C. Fig. 2(f) shows a similar law to that of ZnS, and the content of each component remains stable in the range 1000–1200 °C.
In summary, all of the samples have a minimum content of ZnCoGa2O4 at 1200 °C and the best performance in the range 800–1200 °C. Furthermore, all of the samples have the lowest loss rate at 800 °C according to Fig. 1, but each of the stoichiometries has the highest content of ZnCoGa2O4 at 800 °C. Therefore, we conclude that the optimum sintering temperature range for this material is 1000–1200 °C. The absorption rate of Co ions for ZnSe is higher than that for ZnS. The best doping proportion is x = 0.5.
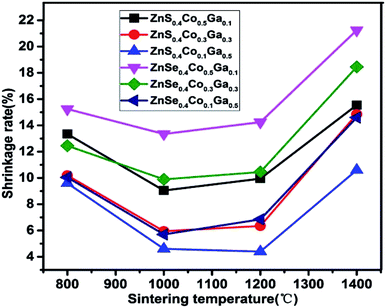
The relevance of the sintering temperature and shrinkage rate of the (Co)x(Ga2O3)0.6−x(ZnS/Se)0.4 ceramic bulk is shown in Fig. 3. The shrinkage rate is calculated by the difference in the diameter of the sample before and after sintering. The loss rate can be affected by a change of the molar ratio in a material. The change in the loss rate can directly lead to deformation of the material, which may further result in a transformation of the structure, stress and density of (Co)x(Ga2O3)0.6−x(ZnS/Se)0.4. Therefore, practical significance was endowed upon the investigation of the relationship between the sintering temperature and shrinkage rate. Meanwhile, investigations can also be used to verify the range of the optimum sintering temperature in (Co)x(Ga2O3)0.6−x(ZnS/Se)0.4. As the experiment used a 20.0 mm cylindrical mould in the preparation, the diameter of all samples can be regarded as 20.0 mm before sintering. Fig. 3 shows that all six materials show the same trend that increases after an initial decrease. But, in general, the shrinkage rate of ZnSe is higher than that of ZnS, which conforms with the relationship between the sintering temperature and molar ratio, and further explains the reason why the absorptivity of ZnSe is higher than that of ZnS. All of the samples have the lowest shrinkage rate in the range 1000–1200 °C, which directly proved the conclusions above. It is concluded that the shrinkage of the material is smallest in the range 1000–1200 °C.
3.2. The analysis of structure
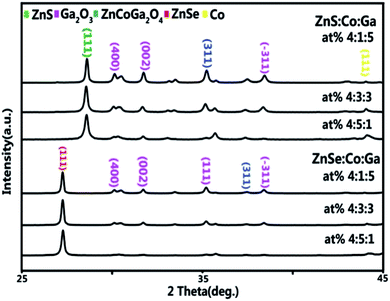
The XRD patterns of the (Co)x(Ga2O3)0.6−x(ZnS/Se)0.4 ceramic bulks sintered at 1200 °C are shown in Fig. 4. The acquired patterns were compared with standard library cards in the JCPDS database, including ZnS (JCPDS 65-9583), ZnSe (JCPDS 37-1463), α-Co (JCPDS 89-4307) and Ga2O3 (JCPDS 43-1012). The result demonstrates that all of the samples are cubic phase and there is no single phase of Co, Ga2O3 with Co high-doped and Ga2O3 low-doped in (Co)0.5(Ga2O3)0.1(ZnS/Se)0.4, which suggests that multi-phase materials didn’t exist in the initial state of the powder. Furthermore, a more complete solid phase reaction is found under the condition of a (Co)0.5(Ga2O3)0.1(ZnS/Se)0.4 doping ratio.ZnCoGa2O4 was found in the XRD pattern of the (Co)x(Ga2O3)0.6−x(ZnS/Se)0.4 ceramic bulks as the content of Ga2O3 increased and Co decreased. This is a result of a more fully solid-phase reaction in the powders of Co, Ga2O3 and ZnS with the rise of Ga2O3 in high sintering temperature conditions. Oxygen replaced sulphur in the reaction, but elemental sulphur didn’t appear in the XRD pattern, which suggests that sulphur still existed in the ZnS (similar to ZnSe). Most importantly, the replacement didn’t destroy structure of the ZnS and ZnSe. Besides, the diffraction peaks of Ga2O3 were found in the XRD pattern with the rise of Ga2O3 content, which illustrates that the absorptivity of ZnS/Se for Ga2O3 is limited. The fact has a certain relationship with the stability of Ga2O3.23 It is inevitable that the material is formed via solid-phase sintering.24,25 In conclusion, the XRD patterns of ZnSe show that it has better structural properties than ZnS due to the absorptivity and doping efficiency. Higher doping of Co and lower doping of Ga2O3 (namely x = 0.5) are regarded as the best doping proportions.
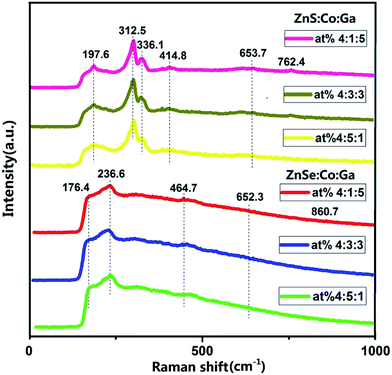
The Raman spectra of the (Co)x(Ga2O3)0.6−x(ZnS/Se)0.4 ceramic bulks sintered at 1200 °C are shown in Fig. 5. There is no phonon signal corresponding to wurtzite of ZnS or ZnSe.26 The Raman peaks of ZnS at 312.5 and 197.6 cm−1, and ZnSe at 236.6 and 176.4 cm−1 in the spectra can be explained by the LO and TO phonon modes.27,28 The vibrations of the Ga2O3 structure are shown by the peak at 336.1 cm−1,29 and the peaks at 414.8, 653.7 and 762.4 cm−1 are the vibrations of the Ga–O, Zn–O and Ga–O bonds.30,31 But, the Raman peak at 336.1 cm−1 doesn’t exist in ZnSe with the same stoichiometry. The peaks in the Raman spectra at 464.7, 652.3 and 860.7 cm−1 for ZnSe can be attributed to Ga–O, Zn–O and Ga–O bonds.31,32 Although the two kinds of materials are relatively similar in their structure, the difference in absorptivity of Ga is well reflected in the research of the ZnS and ZnSe ceramic bulks. Meanwhile, there is no relevant information on Co in the Raman spectra, but there is in the results of XRD, which illustrates that the two materials have a similar ability to absorb Co and Co has a better absorption in the bulk of the materials. In addition, the two kinds of materials have the same trend in the change of stoichiometry, and the best doping proportion is a higher doping of Co and a lower doping of Ga2O3 in the same content of ZnS/ZnSe.
3.3. The properties of absorption
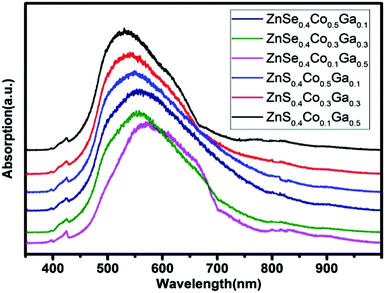
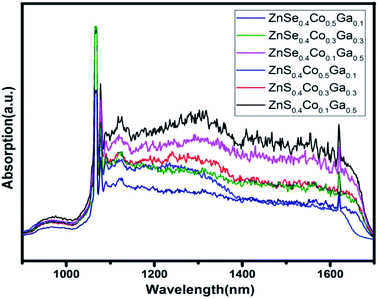
The UV-vis absorption spectra of the (Co)x(Ga2O3)0.6−x(ZnS/Se)0.4 ceramic bulks sintered at 1200 °C are shown in Fig. 6. There is a wide absorption band in the range 450–700 nm. The center of the peak is located in the range 540–570 nm. The absorption intensity is increased with the content of Ga2O3, proving that Ga2O3 and Ga+ have been doped in the ZnS/ZnSe because of its properties in the ultraviolet region.33 The absorption peaks in the range 420–435 nm can be attributed to oxides in the bulks, and the intensity of the peaks shows little change.34 Therefore, information about Ga2O3 and ZnCoGa2O4 is demonstrated in the absorption spectra. In order to verify the substitution of Co in the ceramic bulks, infrared spectroscopy will be used.The infrared absorption spectra of the (Co)x(Ga2O3)0.6−x(ZnS/Se)0.4 ceramic bulks sintered at 1200 °C are shown in Fig. 7. According to current reports, Co2+ has two strong absorption bands at 730 nm and 1600 nm, which are ascribed to 4A2(F) → 4T1(F) and 4A2(F) → 4T1(P).16,35 In the case of co-doped materials, the excited state 4T1(F) may lead to an energy transition between the relevant orbitals of the different doping ions.36 Therefore, the different dopants need to be tested and studied in different substrates. The infrared absorption spectra have two larger peaks approximately at 1080 nm and 1620 nm, which can be attributed to the oxide and d–d electronic transitions of the Co2+ ions. The intensity of the infrared absorption peaks depends on the molecular vibration with the change of dipole moment.37 With Co2+ ion doping, the variation of the dipole moment becomes smaller. However, the infrared absorption band becomes narrow and sharp in the case of Ga2O3 doping.
3.4. The properties of the valence state
The XPS spectra of Co in the (Co)x(Ga2O3)0.6−x(ZnSe)0.4 ceramic bulk are shown in Fig. 8. The C 1s in elemental C and Al targets is selected to revise the charge potential shift and bombardment in testing. The weak XPS signals at 800 °C are difficult to analyse, which indicates the uncertainty of Co doping at low temperatures. The binding energy of Co 2p3/2 is 781.4 eV and Co 2p3/2 is 797.7 eV in the range 1000–1200 °C. Compared with the standard spectrum, the peak information in this area coincides with the peak phase of CoO. Therefore, this situation proves the +2 valence of Co. With the increase of the preparation temperature, the peak position in the range 1200–1400 °C moves slightly in the direction of the 770 eV. The peak position is close to that of Co3O4, according to information from standard spectra. This means that a small amount of Co ions with a +3 valence exist in the material sintered at high temperature.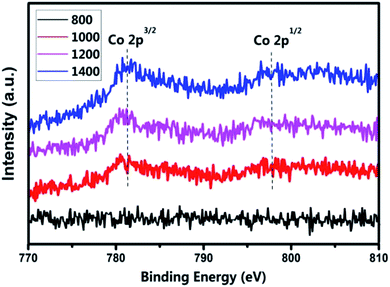 | ||
| Fig. 8 XPS spectra of Co 2p for the (Co)0.5(Ga2O3)0.1(ZnSe)0.4 bulks at temperatures ranging from 800 °C to 1400 °C. | ||
The XPS spectra of Ga in the (Co)x(Ga2O3)0.6−x(ZnSe)0.4 ceramic bulk are shown in Fig. 9. The peak positions of Ga 2p for the materials prepared at different temperatures are almost identical. The binding energy of Ga 2p3/2 is 1117.8 eV and Ga 2p3/2 is 1145.5 eV. This result shows that the influence of the sintering temperature on Ga is smaller than that on Co. In addition, this is also related to the high stability of Ga2O3. According to the bonding energy of the Ga–O bond (1116.6 eV), we can conclude that Ga exists in the +3 oxidation state, and it is consistent with the Ga2O3 we doped. Therefore, the +3 valence of Ga ion is confirmed.
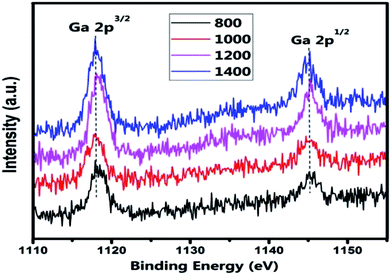 | ||
| Fig. 9 XPS spectra of Ga 2p for the (Co)0.5(Ga2O3)0.1(ZnSe)0.4 bulks at temperatures ranging from 800 °C to 1400 °C. | ||
3.5. The surface morphology of the films
SEM used to visualise the surface morphology of (Co)0.5(Ga2O3)0.1(ZnSe)0.4 films, prepared from the bulk sintered at 800 °C, 1000 °C, 1200 °C and 1400 °C, is shown in Fig. 10. Many incomplete dopant sites are present in the morphology at 800 °C, as shown in Fig. 10(a), which are probably Co sites because Co occupies 50% of the composition ratio at this doping concentration. The large particle size and surface roughness are shown in Fig. 10. However, the surface morphology of the film prepared from the ceramic bulk sintered at 1000 °C has significantly improved, as depicted in Fig. 10(b). The number and size of the surface particles are markedly reduced by the change in temperature. At the same time, the neat surface arrangement and clear texture are depicted in Fig. 10(b). Then, the arrangement of the surface is almost unchanged, but the particle size is slightly increased for the film prepared from the ceramic bulk sintered at 1200 °C, as shown in Fig. 10(c). Although the surface is more smooth and uniform, some flaky dopant appears on the surface of the film sintered at 1400 °C. In summary, excellent surface morphology of the film is obtained in the range 1000–1200 °C. According to the results of this paper, this conclusion can be considered as an influence of the quality of the original material. The effect of the surface morphology of the raw material on the morphology of the film requires further discussion and experiment.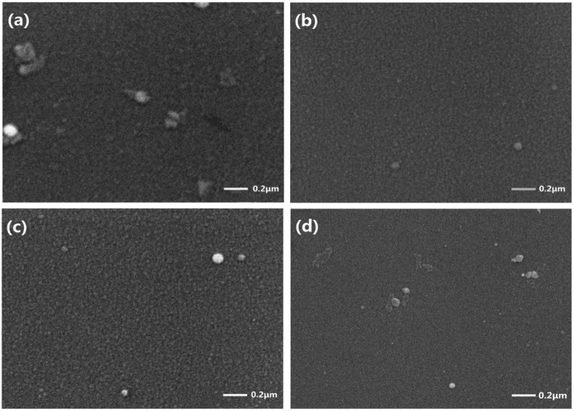 | ||
| Fig. 10 SEM used to visualise the surface morphology of (Co)0.5(Ga2O3)0.1(ZnSe)0.4 films prepared from the bulk sintered at (a) 800 °C, (b) 1000 °C, (c) 1200 °C and (d) 1400 °C. | ||
4. Conclusion
The ceramic bulks (Co)x(Ga2O3)0.6−x(ZnS/Se)0.4 (x = 0.1, 0.3 and 0.5) were fabricated via a solid state reaction in a high temperature pipe boiler, at temperatures ranging from 1000 to 1400 °C. The impressive effect of the sintering temperature on the doping elements was investigated, and the optimum sintering temperature in the range 1000–1200 °C was revealed, by the analysis of the mass loss, molar ratio and shrinkage rate of (Co)x(Ga2O3)0.6−x(ZnS/Se)0.4. The zinc-blende structure of the bulk ceramic and optimum doping ratio of (Co)x(Ga2O3)0.6−x(ZnS/Se)0.4 were confirmed by XRD and Raman spectroscopy. (Co)x(Ga2O3)0.6−x(ZnS/Se)0.4 could be used as an optical material with a broad application range, from the ultraviolet to infrared, according to the absorption spectra. The +2 and +3 valences of Co and Ga in the materials were proved by XPS. The surface morphologies of the films were visualised by SEM and exhibited excellence when sintering temperatures were in the range 1000–1200 °C. In summary, Co and Ga2O3 co-doped ZnS/Se ceramics have diverse properties and a wide range of absorption. What’s more, it is beneficial to research the relationship between the preparation of target or bulk ceramics and the characteristics of the nano-materials. But, there are still some problems with our experiments, such as optimization for the preparation method and impurity in the materials. Therefore, this work is of great practical significance for investigations on bulk ceramics.Conflicts of interest
There are no conflicts to declare.Acknowledgements
This research is supported by the Beijing Municipal Education Commission Science and Technology Program key projects: KZ201610005001.References
- M. Gruning and C. Attaccalite, Phys. Chem. Chem. Phys., 2016, 18, 21179–21189 RSC.
- Q. Mahmood, S. M. Alay-e-Abbas, M. Hassan and N. A. Noor, J. Alloys Compd., 2016, 688, 899–907 CrossRef CAS.
- T. Y. Tsai and M. Birnbaum, J. Appl. Phys., 2000, 87, 25 CrossRef CAS.
- A. S. Hassanien, K. A. Aly and A. A. Akl, J. Alloys Compd., 2016, 685, 733–742 CrossRef CAS.
- K. Pushpendra, J. Singh, M. K. Pandey, C. E. Jeyanthi, R. Siddheswaran, M. Paulraj, K. N. Hui and K. S. Hui, Mater. Res. Bull., 2014, 49, 144–150 CrossRef.
- I. T. Zedan, A. A. Azab and E. M. El-Menyawy, Spectrochim. Acta, Part A, 2016, 154, 171–176 CrossRef CAS PubMed.
- P. S. Hariharan, N. Subhanshini, J. Vasanthalakshmi and S. P. Anthony, J. Lumin., 2016, 26, 703–707 CAS.
- G. C. Xing, W. Ji, Y. G. Zheng and Y. Ying, Opt. Express, 2008, 16, 5715–5720 CrossRef CAS.
- L. Zhang, D. Z. Qin, G. R. Yang and Q. X. Zhang, Chalcogenide Lett., 2012, 9, 93–98 CAS.
- L. Y. Liu, L. Yang, Y. T. Pu, D. Q. Xiao and J. G. Zhu, Mater. Lett., 2012, 66, 121–124 CrossRef CAS.
- M. Jadraque, A. B. Evtushenko, D. Ávila-Brande, M. Lopez-Arias, V. Loriot, Y. G. Shukhov, L. S. Kibis, A. V. Bulgakov and M. Martin, J. Phys. Chem. C, 2013, 117, 5416–5423 CAS.
- M. Lei, X. L. Fu, H. J. Yang, Y. G. Wang, P. G. Li, Q. R. Hu and W. H. Tang, Mater. Chem. Phys., 2012, 133, 823–828 CrossRef CAS.
- Z. Mierczyk, A. Majchrowski, K. Ozga, A. Slezak and I. V. Kityk, Opt. Laser Technol., 2006, 38, 558–564 CrossRef CAS.
- F. Sakurai, K. Suto, J. Nishizawa, Y. Oyama, M. Motozawa and Y. Hara, J. Electrochem. Soc., 2000, 147, 747–750 CrossRef CAS.
- X. C. Liu, Z. Z. Chen, B. Y. Chen, E. W. Shi and D. Q. Liao, J. Cryst. Growth, 2010, 312, 2871–2875 CrossRef CAS.
- N. Myoung, D. V. Martyshkin, V. V. Fedorov and S. B. Mirov, J. Lumin., 2013, 133, 257–261 CrossRef CAS.
- K. P. Wu, S. L. Gu and S. M. Zhu, Semicond. Sci. Technol., 2008, 33, 345–348 Search PubMed.
- J. A. Sans, J. F. Sanchez-Royo, J. Pellicer-Porres, A. Segura, E. Guillotel, G. Martinez-Criado, J. Susini, A. Munoz-Paez and V. Lopez-Flores, Superlattices Microstruct., 2007, 42, 226–230 CrossRef CAS.
- S. J. Luo, C. B. Wang, X. Zhou, Q. Shen and L. M. Zhang, J. Mater. Sci.: Mater. Electron., 2012, 23, 1477–1484 CrossRef CAS.
- M. Jadraque, A. B. Evtushenko, D. A. Brande, M. Lopez-Arias, V. Loriot, Y. G. Shukhov, L. S. Kibis, A. V. Bulgakov and M. Martin, J. Phys. Chem. C, 2013, 117, 5416–5423 CAS.
- S. R. Zandbergen, R. Gibson, B. Amirsolaimani, S. Mehravar, P. Keiffer, A. Azarm and K. Kie, Opt. Mater. Express, 2017, 7, 2102–2110 CrossRef.
- K. S. Kim, H. W. Kim and C. M. Lee, Mater. Sci. Eng., B, 2003, 98, 135–139 CrossRef.
- D. Y. Guo, Z. P. Wu, P. G. Li, Y. H. An, H. Liu, X. C. Guo, H. Yan, G. F. Wang, C. L. Sun and L. H. Li, Opt. Mater. Express, 2014, 4, 1067–1076 CrossRef.
- J. B. Chen, L. Wang, X. Q. Su, L. Kong, G. Q. Liu and X. P. Zhang, Opt. Express, 2010, 18, 1398–1405 CrossRef CAS PubMed.
- T. L. Phan, P. Zhang, D. S. Yang, N. X. Nghia and S. C. Yu, J. Appl. Phys., 2011, 110, 063912 CrossRef.
- H. I. Abdulgafour, Z. Hassan, N. Al-Hardan and F. K. Yam, Phys. B, 2010, 405, 2570–2572 CrossRef CAS.
- C. M. Lin, D. S. Chuu, T. J. Yang, W. C. Chou, J. A. Xu and E. Huang, Phys. Rev. B: Condens. Matter Mater. Phys., 1997, 55, 13641–13646 CrossRef CAS.
- C. S. Yang, C. S. Ro, W. C. Chou, C. M. Lin, D. S. Chuu, J. Hu, E. Huang and J. Xu, J. Appl. Phys., 1999, 85, 8092–8096 CrossRef CAS.
- S. Kumar, G. Sarau, C. Tessarek, M. Y. Bashouti, A. Hahnel, S. Christiansen and R. Singh, J. Phys. D: Appl. Phys., 2014, 47, 1–10 Search PubMed.
- Y. H. Gao, Y. Bando and T. Sato, Appl. Phys. Lett., 2002, 81, 2267–22269 CrossRef CAS.
- R. Rao, A. M. Rao, B. Xu, J. Dong, S. Sharma and M. K. Sunkara, J. Appl. Phys., 2005, 98, 094312 CrossRef.
- D. Dohy, G. Lucazeau and A. Revcolevschi, J. Solid State Chem., 1982, 45, 180–192 CrossRef CAS.
- M. Choi and J. Son, Curr. Appl. Phys., 2017, 17, 713–716 CrossRef.
- J. M. Pawhkowski, Solid State Commun., 1985, 55, 31–33 CrossRef.
- M. Luo, N. C. Giles, U. N. Roy, Y. Cui and A. Burger, J. Appl. Phys., 2005, 98, 08350 CrossRef.
- B. Amin and I. Ahmad, J. Appl. Phys., 2009, 106, 37101–37106 CrossRef.
- X. S. Li, C. H. Li and W. Lin, Phase analysis and research method of inorganic non-metallic materials, China Building Material Industry Publishing House, Beijing, 2008, pp. 203–219 Search PubMed.
| This journal is © The Royal Society of Chemistry 2017 |

