 Open Access Article
Creative Commons Attribution 3.0 Unported Licence
Bimodal counterpropagating-responsive sensing material for the detection of histamine
Zhengzong Wuab,
Enbo Xua,
Aiquan Jiaoa,
Zhengyu Jin *a and
Joseph Irudayaraj*b
aThe State Key Laboratory of Food Science and Technology, School of Food Science and Technology, Jiangnan University, 1800 Lihu Road, Wuxi 214122, China. E-mail: jinlab2008@yahoo.com; Fax: +86-510-85913299; Tel: +86-510-85913299
bDepartment of Bioengineering, College of Engineering, University of Illinois at Urbana-Champaign, Urbana, IL, USA 61820. E-mail: jirudaya@illinois.edu; Fax: +1-217-300-0525; Tel: +1-217-300-0525
First published on 20th September 2017
Abstract
Reliable and ultrasensitive quantification of harmful chemicals is essential to ensure food safety. In this study, a dual mode material for fast extraction and sensitive detection of histamine was developed. The novel sensing material was synthesized by coating a layer of molecularly imprinted polymers (MIPs) doped with silver nanoparticles (AgNPs) on the surface of upconversion particles (UCNPs). The novel material (UCNPs@MIPs–AgNPs) simultaneously possessed a positive surface-enhanced Raman scattering (SERS) response and negative fluorescence response. In the presence of histamine, the fluorescence intensity of UCNPs@MIPs–AgNPs was quenched gradually while the SERS intensity increased gradually. The limit of detection (LOD) and limit of quantitation (LOQ) of histamine were 0.009 mg L−1 and 0.02 mg L−1, and 0.04 mg L−1 and 0.1 mg L−1, respectively, under fluorescence mode and SERS mode. These results revealed that it is feasible to accurately detect histamine content by using the dual responsive material. The developed strategy integrates the advantages of upconverting nanotechnology, molecularly imprinted technology and SERS technology for highly specific enrichment and detection of histamine.
1. Introduction
Histamine, a common biogenic amine produced by bacterial decarboxylation from the amino acid histidine, acts to transmit signals from cell to cell in the skin, gut, and other organs of the immune system.1,2 It has been confirmed that the ingestion of excess histamine can trigger a wide array of symptoms including nausea, headache, diarrhea, oral numbness, palpitations, rashes, asthma and even death3–5 compromising health safety. In this context, histamine as the primary toxic compound existing in wine has attracted significant attention in food quality monitoring. Since conventional processing methods such as cooking and freezing cannot destroy histamine once it has formed,6 the continuous monitoring of trace levels of histamine in food products is essential.Many methods have been developed for the detection of histamine, such as gas chromatography (GC),7 electrochemical sensing,8 capillary zone electrophoresis,9 thin layer chromatography (TLC),10 high-performance liquid chromatography (HPLC)11 and enzyme-linked immunosorbent assay (ELISA).12 Although these conventional methods have the merits of high sensitivity and accuracy, they have several inherent drawbacks. Chromatographic methods are relatively sophisticated, expensive and tedious. ELISA is strongly dependent on the use of unstable enzymes and expensive test kits, which cannot meet the high-throughput and quality control rigor required by the government and food industry. Thus, the exploitation of alternative rapid and accurate approach is of vital importance.
Spectroscopic methods are promising tools for the determination of toxic or harmful substances in food because they are inherently rapid, specific, and partially or completely computerized.13–16 The current fluorescence methods used in detection showed promise in the development of bioassay techniques, owing to its fast, sensitive and reproducible signal. Upconversion nanoparticles (UCNPs) doped with lanthanide have attracted tremendous attention.17–19 UCNPs can emit a high-energy photon at a shorter wavelength under excitation by multiple low-energy near-infrared (NIR) photons, instead of traditional photoexcitation in the UV or visible regions. As autofluorescence originating from coexisting substances in sample matrixes can be greatly minimized by the use of NIR photons, the background light interference and sensitivity of the detection can be improved with UCNPs-labeled optical sensing system with NIR as the excitation source.20 In addition, UCNPs has good photochemical stability, large Stokes shifts, is nonblinking with deep penetration effects in biological samples and relatively low toxicity. All of these appealing advantages makes UCNPs a promising label compared to traditional fluorescent materials.21,22 Another promising spectroscopic technology is surface-enhanced Raman spectroscopy (SERS). SERS has become one of the most versatile quantitative approaches for detection even down to the single-molecule level.23,24 It has been successfully used as a rapid and accurate detection method for determining many kinds of chemical compounds or bacteria in food during the past decade.25–27
Despite the tremendous progress made in the field of fluorescence and SERS detection technologies, challenges exist. In particular, the specific recognition of target molecule (i.e., selectivity) for separation-detection is difficult to achieve using traditional host guest chemistry in the sensor design. This has become a major challenge to the analytical utility. Here, sample pretreatment is essential to eliminate interferences to improve separation and detection and obtain satisfactory results. Molecular imprinting offers a new technique for efficient separation and enrichment of specific analytes from complicated matrices. It is a kind of biomimic technique to synthesize molecularly-imprinted polymers (MIPs) with artificially generated recognition sites that are able to specifically rebind a target molecule in preference to other closely-related compounds.28 MIPs synthesis is relatively cheap and easy, making it an excellent alternative to natural receptors. Because of these advantages, MIPs has attracted considerable attention and has been integrated with HPLC, quantum dots and graphene oxide for the determination of food chemical hazards in recent years.29,30 Feng et al.31 and Hu et al.32 had successfully combined MIPs and SERS for accurate and high-throughput detection of melamine and α-tocopherol in milk and vegetable oils, respectively. To the best of our knowledge, very few attempts have integrated MIPs and SERS or UCNPs in a single sensor system for separation and detection of histamine in food samples.
The current study aims to develop a novel sensor material for dual mode ultrasensitive detection of histamine by integrating the selective recognition ability of MIPs and the high detection sensitivity and accuracy of UCNPs and SERS technologies.
2. Materials and methods
2.1. Chemicals and reagents
Histamine, putrescine, β-phenylethylamine, spermine, spermidine, tryptamine, tyramine, cadaverine, ethylene glycol dimethacrylate (EGDMA), ammonium fluoride, α-methacrylic acid (MAA), 2,2′-azobis(isobutyronitrile) (AIBN) and poly(acrylic acid) (PAA, M.W. 2000) were obtained from Sigma-Aldrich (Saint Louis, MO, USA). Chloroform, ammonium acetate and sodium borohydride were from TCI Co., Ltd. (Portland, OR, USA). Ammonium fluoride (NH4F), ethanol, sodium hydroxide, methanol and sodium chloride were purchased from Fisher Scientific (Waltham, MA, USA). Glutaraldehyde, (3-aminopropyl) triethoxysilane (APTES), 1,6-hexanediamine and octadecene (ODE), tetraethyl orthosilicate (TEOS), oleic acid (OA), ytterbium(III) chloride hexahydrate (YbCl3), yttrium(III) chloride hexahydrate (YCl3) and erbium chloride hexahydrate (ErCl3) were all obtained from Alfa Aesar Co., Inc. (Tewksbury, MA, USA). Rice wine and red wine were purchased from Better World Market (West Lafayette, IN, USA). Canned tuna was purchased from Meijer Market (West Lafayette, IN, USA). All reagents and solvents used were analytical or HPLC grade. Deionized (DI) water (18.2 MΩ cm−1) was prepared by the Millipore system (Billerica, MA, USA).2.2. Reference method for histamine determination
Histamine content was determined by the method of Gao et al.4 Typically, a HPLC system (Agilent 1100 series, Germany) coupled with quaternary pump and a diode array detector was used to determine the concentration of histamine, with the use of a HILIC column (Luna@HILIC, 3 mm, 100 × 2 mm, Phenomenex, Torrance, CA, USA). The flow rate was 0.4 mL min−1 and mobile phase was consisted of ammonium acetate (5 mM) and acetonitrile (1![[thin space (1/6-em)]](https://www.rsc.org/images/entities/char_2009.gif) :
:![[thin space (1/6-em)]](https://www.rsc.org/images/entities/char_2009.gif) 9, v/v).
9, v/v).
2.3. Synthesis of dual signal response material
![[thin space (1/6-em)]](https://www.rsc.org/images/entities/char_2009.gif) :
:![[thin space (1/6-em)]](https://www.rsc.org/images/entities/char_2009.gif) 1 v/v) three times. Finally, the obtained UCNPs were dried overnight in a vacuum oven at 60 °C. OA-UCNPs were thus formed and kept in a desiccator until ready to use.
1 v/v) three times. Finally, the obtained UCNPs were dried overnight in a vacuum oven at 60 °C. OA-UCNPs were thus formed and kept in a desiccator until ready to use.The surface modification of the OA-UCNPs was performed using a ligand exchange with PAA.33 Typically, 30 mg of the OA-capped UCNPs in chloroform (4 mL) were slowly added to a water solution (8 mL) containing 200 mg PAA, and the solution was vigorously stirred for 24 h. After that, the resultant solution was transferred into the upper water layer from the chloroform layer due to the PAA attachment. The nanoparticles were separated by centrifugation and washed three times with ultrapure water to obtain PAA-stabilized UCNPs.
![[thin space (1/6-em)]](https://www.rsc.org/images/entities/char_2009.gif) :
:![[thin space (1/6-em)]](https://www.rsc.org/images/entities/char_2009.gif) 2, v/v) solution until no histamine could be detected using HPLC. UCNPs@MIPs–AgNPs was then vacuum-dried at 60 °C and ground to powder with a mortar and pestle. As a reference, the non-molecular imprinted polymer (UCNPs@NIPs–AgNPs) was prepared using the same protocol without the addition of the template molecule (histamine).
2, v/v) solution until no histamine could be detected using HPLC. UCNPs@MIPs–AgNPs was then vacuum-dried at 60 °C and ground to powder with a mortar and pestle. As a reference, the non-molecular imprinted polymer (UCNPs@NIPs–AgNPs) was prepared using the same protocol without the addition of the template molecule (histamine).2.4. Evaluation of the binding capacities of UCNPs@MIPs–AgNPs and UCNPs@NIPs–AgNPs
For the static adsorption tests, histamine was dissolved in 2 mL of ammonium acetate solution (30 mM) to form standard solutions with different concentrations (10, 25, 50, 75, 100, 150 and 200 mg L−1), which were mixed with 10 mg of UCNPs@MIPs–AgNPs or UCNPs@NIPs–AgNPs. Then, the mixtures were shaken in a thermostatic water bath oscillator at 200 rpm for 45 min (25 °C) and centrifuged at 5000 × g for 15 min. The resulting supernatant was filtered through a membrane filter (pore size: 0.45 μm) and the concentrations of free histamine (i.e., unbounded histamine) were determined by the HPLC method.The adsorption capacity (Q) was calculated by the following formula:
 | (1) |
In addition, the Scatchard model, Freundlich model and Langmuir isotherm model were used to determine the affinity of UCNPs@MIPs–AgNPs and UCNPs@NIPs–AgNPs in the study. These three models were developed according to the equations as follows:
Scatchard model:
 | (2) |
Freundlich model:
lg![[thin space (1/6-em)]](https://www.rsc.org/images/entities/char_2009.gif) Q = m Q = m![[thin space (1/6-em)]](https://www.rsc.org/images/entities/char_2009.gif) lg lg![[thin space (1/6-em)]](https://www.rsc.org/images/entities/char_2009.gif) Ce + lg Ce + lg![[thin space (1/6-em)]](https://www.rsc.org/images/entities/char_2009.gif) a a
| (3) |
Langmuir isotherm model:
 | (4) |
For the study of kinetic adsorption of UCNPs@MIPs–AgNPs (or UCNPs@NIPs–AgNPs) towards histamine, a set of seven samples was incubated at 25 °C for different time points (5, 15, 30, 45, 60, 90 and 150 min). The mixture was treated and determined following the same procedures above mentioned for static adsorption.
The pseudo-first-order kinetic model and pseudo-second-order kinetic model was used to describe the dynamic adsorption process according to eqn (5) and (6), respectively.34
ln(Q − Qt) = ln![[thin space (1/6-em)]](https://www.rsc.org/images/entities/char_2009.gif) Q − k1t Q − k1t
| (5) |
 | (6) |
To evaluate the nature of diffusion process for histamine adsorption, the intra-particle diffusion model was introduced. The intra-particle mass transfer diffusion model proposed by Weber and Morris can be expressed as follows:
| Qt = k3t1/2 + C | (7) |
The selectivity test was performed by comparing the adsorption capacity of UCNPs@MIPs–AgNPs (or UCNPs@NIPs–AgNPs) towards histamine and that of its analogues at 75 mg L−1 after 45 min incubation. Herein, histamine, β-phenylethylamine, putrescine, spermine, spermidine, tryptamine, tyramine and cadaverine were selected as competitive agents to determine histamine selectivity of the UCNPs@MIPs–AgNPs.
The distribution coefficient (Kd), selectivity coefficient (k) and the relative selectivity coefficient (α) of the sorbent obtained in these comparative experiments were also used to evaluate the competitive selective capacity of UCNPs@MIPs–AgNPs and UCNPs@NIPs–AgNPs. These three parameters were calculated following the equations below:
 | (8) |
 | (9) |
 | (10) |
2.5. Fluorescence and SERS measurements
Sample solutions containing various concentrations (0.00 mg L−1, 0.02 mg L−1, 0.1 mg L−1, 1 mg L−1, 5 mg L−1, 10 mg L−1, 50 mg L−1, 100 mg L−1 and 250 mg L−1) of histamine standard were mixed with 10 mg of UCNPs@MIPs–AgNPs (UCNPs@NIPs–AgNPs). After shaking at room temperature for 45 min, the fluorescence signal of the solution was scanned by using a Hitachi F-7000 fluorescence spectrometer equipped with an external 980 nm laser. For the blank (0.00 mg L−1), twenty measurements were performed. For other levels (0.02 mg L−1, 0.1 mg L−1, 1 mg L−1, 5 mg L−1, 10 mg L−1, 50 mg L−1, 100 mg L−1 and 250 mg L−1), five measurements were performed.For SERS detection, sample solutions containing various concentrations (0.00 mg L−1, 0.1 mg L−1, 1 mg L−1, 5 mg L−1, 10 mg L−1, 50 mg L−1 and 100 mg L−1) of histamine standard were mixed with 10 mg of UCNPs@MIPs–AgNPs (UCNPs@NIPs–AgNPs). After shaking at room temperature for 45 min, the mixture then centrifuged at 5000 × g for 5 min. The supernatant was discarded and the pellet was dried before depositing onto the gold-coated microarray chip for SERS spectra collection. The SERS spectra were obtained by averaging the spectra detected at seven random different detection spots.
2.6. Characterization
The surface groups of the synthesized UCNPs and UCNPs@MIPs–AgNPs were measured using a FT-IR spectrophotometer (Nexus 670, Thermo Electron Corp., Madison, WI, USA) in the range of 650–4000 cm−1 with 256 scans at a resolution of 4 cm−1. The sample powders (5 mg) were ground with spectroscopic grade KBr powders (250 mg) and then pressed into 1 mm pellets.35 Morphologies of the synthesized nanoparticles were recorded by a high-resolution FEI Tecnai G2 20 transmission electron microscope equipped with a charge-coupled device (CCD) camera operating at an acceleration voltage of 200 kV. UV-vis absorption spectra were collected with a JASCO V570 UV/visible/NIR spectrophotometer (JASCO, Inc., Easton, MD, USA). A Bruker Senterra confocal Raman system (Billerica, MA, USA) coupled with 50× air objective (NA0.9, infinity and flat field corrected), a motorized microscope and a CCD array detector was employed for SERS spectra acquisition. The excited laser source was provided by a 785 nm air-cooled He–Ne laser at 10 mW and the exposure time for each SERS measurement was set at 10 s. The spot diameter of laser source with our condition is about 12 μm. Upconversion fluorescence spectra were recorded on a Hitachi F-7000 fluorescence spectrophotometer (Hitachi Co., Tokyo, Japan) modified with an external 0–1300 mW adjustable continuous wave 980 nm laser (Beijing Hi-Tech Optoelectronic Co., Beijing, China) instead of the internal excitation source.2.7. Statistical analysis
All data were expressed as mean ± standard deviation (SD) of at least three determinations throughout the study, and spectra drawings were performed using Origin 8.5 (OriginLab Inc., Northampton, MA, USA). Data was analyzed using one-way analysis of variance and means were compared by Duncan's multiple range tests using SPSS 18.0 (SPSS Inc., Chicago, IL, USA). The probability value of p < 0.05 was considered significant. The OMNIC software (v. 8.0, Thermo Electron Corp., Madison, WI, USA), OPUS 6.5 software (Opus Software, Inc., San Francisco, CA, USA) and FL Solutions 2.1 software (Hitachi High-technology Co., Tokyo, Japan) were utilized for FT-IR, Raman and fluorescence spectra acquisition and instrument control, respectively. Principal component analysis (PCA) was implemented in the commercial chemometric software The Unscrambler (v 10.2; CAMO Software AS, Oslo, Norway).3. Results and discussions
3.1. Analytical principle
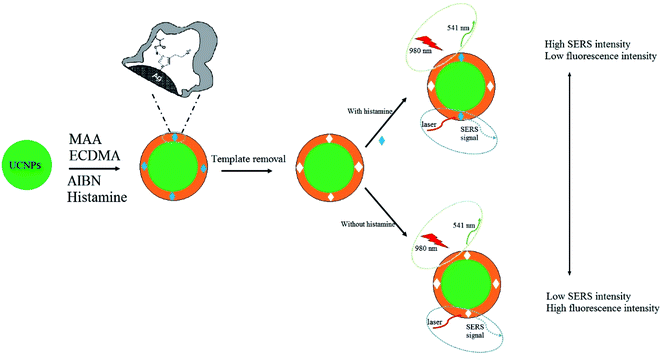
The typical dual-mode system for the detection of histamine based on fluorescence and SERS is illustrated in Scheme 1. The UCNPs@MIPs–AgNPs synthesized combined MIPs with fluorescence and SERS detection modalities. When histamine molecules were bound to the material, strong fluorescence quenching and prominent electromagnetic enhancement effect could occur simultaneously. The fluorescence quenching mechanism might not be through fluorescence resonance energy transfer since no overlap existed between the histamine absorption peak (at ∼210 nm) and the UCNPs emission peak (at 541 nm). The quenching mechanism could be attributed to the photo-induced electron transfer from histamine to UCNPs. The amine groups of histamine interacted with carboxyl groups in UCNPs@MIPs–AgNPs. The lone pair of electrons in oxygen-containing groups was available for photo-induced electron transfer, leading to a decrease in emission. When analytes were absorbed on the shell of MIPs, they (histamine molecules) also located closely to SERS-active substrates (AgNPs), which were incorporated in the outer shell of MIPs during polymerization, resulting in improved reproducibility of the SERS spectra. The methodology was proposed by Liu et al.36 They integrated AgNPs with MIPs by adding silver nitrate as AgNPs precursor that bind to theophylline during bulk polymerization. Hu et al.37 successfully applied this methodology for the detection of melamine by integrating AgNPs with MIPs for melamine. Considering the fact that similar to the structure of theophylline, histamine also contains an imidazole ring, which could interact with AgNPs precursor during polymerization, this methodology was adopted in this study.3.2. Characterization of UCNPs@MIPs–AgNPs and UCNPs@NIPs–AgNPs
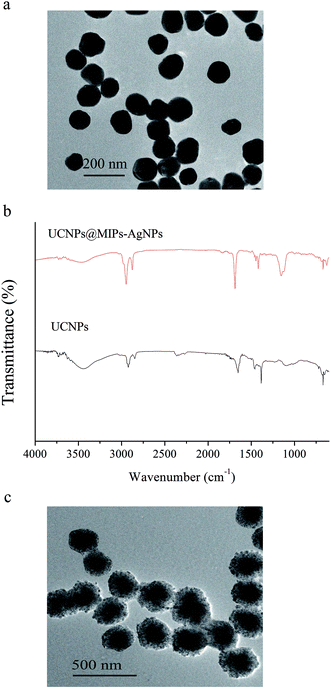
![[double bond, length as m-dash]](https://www.rsc.org/images/entities/char_e001.gif) O). After coating MIPs on the UCNPs, due to the existence of cross-linkers and monomers used to synthesize MIPs, the peak intensities at 2951 cm−1, 2853 cm−1 and 1725 cm−1 were obviously enhanced. At the same time, a new peak at around 1170 cm−1 were observed in the spectrum of UCNPs@MIPs–AgNPs. This band was assigned to the stretching vibration adsorption of ether group (C–O–C).38 In addition, the peaks in the absorption band between 3200 cm−1 and 3800 cm−1 shifted from 3458 cm−1 in the spectrum of UCNPs to 3441 cm−1 in the spectrum for UCNPs@MIPs–AgNPs, which might be due to the interactions between the –NH2 group of the template molecule and the C
O). After coating MIPs on the UCNPs, due to the existence of cross-linkers and monomers used to synthesize MIPs, the peak intensities at 2951 cm−1, 2853 cm−1 and 1725 cm−1 were obviously enhanced. At the same time, a new peak at around 1170 cm−1 were observed in the spectrum of UCNPs@MIPs–AgNPs. This band was assigned to the stretching vibration adsorption of ether group (C–O–C).38 In addition, the peaks in the absorption band between 3200 cm−1 and 3800 cm−1 shifted from 3458 cm−1 in the spectrum of UCNPs to 3441 cm−1 in the spectrum for UCNPs@MIPs–AgNPs, which might be due to the interactions between the –NH2 group of the template molecule and the C![[double bond, length as m-dash]](https://www.rsc.org/images/entities/char_e001.gif) O group of MAA. The spectra for UCNPs and UCNPs@MIPs–AgNPs had similar profiles (similar locations and appearances of the major bonds) indicated that they had same chemical nature. These results demonstrated that the polymerization on the surface of UCNPs particles had been successfully implemented.
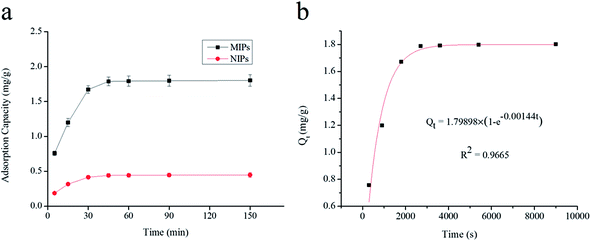
O group of MAA. The spectra for UCNPs and UCNPs@MIPs–AgNPs had similar profiles (similar locations and appearances of the major bonds) indicated that they had same chemical nature. These results demonstrated that the polymerization on the surface of UCNPs particles had been successfully implemented.3.2.3.1. Adsorption kinetics. To evaluate the selective recognition, binding capacity and equilibrium rate of the synthesized UCNPs@MIPs–AgNPs, static and kinetic adsorption tests were performed for both of UCNPs@MIPs–AgNPs and UCNPs@NIPs–AgNPs. The kinetic adsorption curves were shown in Fig. 2a. Here, both the absorption capacities of UCNPs@MIPs–AgNPs and UCNPs@NIPs–AgNPs increased with incubation time, reaching an adsorption equilibrium at around 45 min. Thus, 45 min was chosen as optimal extraction time. Note that at all conditions, the amount of histamine binding to UCNPs@MIPs–AgNPs was remarkably higher than that of UCNPs@NIPs–AgNPs, verifying the superior performance of UCNPs@MIPs–AgNPs versus UCNPs@NIPs–AgNPs with respect to histamine binding. The binding capacity of UCNPs@NIPs–AgNPs was contributed by nonspecific binding, which was hypothesized to be driven by the interruption of the hydrogen-bond interactions by the solvent media. UCNPs@MIPs–AgNPs contained of nonspecific binding sites as well as specific reorganization sites, which was ascribed to the host–guest shape and size recognition and the bond reaction between them. However, the number of non-specific binding sites was limited. That explained why much higher Q value for UCNPs@MIPs–AgNPs was observed compared with that of UCNPs@NIPs–AgNPs.
Three different models, namely pseudo-first-order kinetic model, pseudo-second-order kinetic model and intra-particle diffusion model, were chosen to investigate dynamic adsorption mechanism of histamine. As seen in Fig. 2b and 3, the adsorption reaction of UCNPs@MIPs–AgNPs towards histamine could be well fitted by both of pseudo-first-order kinetic model and pseudo-second-order kinetic model while the fitting performance of intra-particle diffusion model was far worse. In addition, compared with pseudo-first-order kinetic model and intra-particle diffusion model, the pseudo-second-order kinetic model described the adsorption behavior of UCNPs@MIPs–AgNPs on histamine with higher R2 (0.9965). Moreover, the theoretical Qe value calculated from the slope of the pseudo-second-order kinetic model (t/Qt versus t) was 1.85 mg g−1, closed to the Qe value (1.80 mg g−1) obtained from the experiment. These results indicated that instead of intra-particle diffusion, the adsorption process of UCNPs@MIPs–AgNPs towards histamine was controlled by chemical adsorption mechanism by sharing electrons between them.39
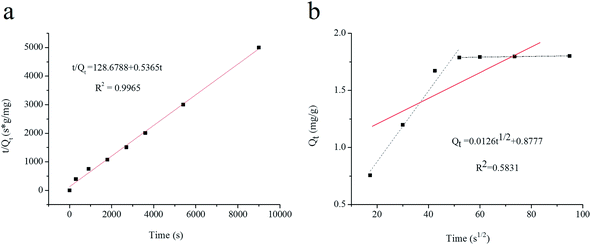 | ||
| Fig. 3 (a) Pseudo-second-order kinetic model for the adsorption of histamine by UCNPs@MIPs–AgNPs; (b) intra-particle diffusion model for the adsorption of histamine by UCNPs@MIPs–AgNPs. | ||
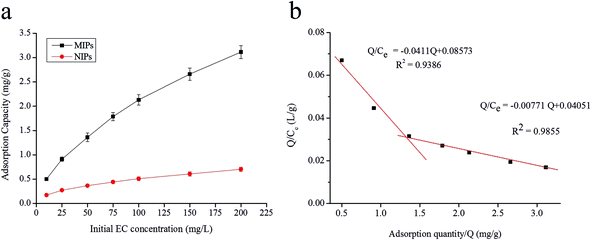
3.2.3.2. Static binding characteristics. The static adsorption capacities of UCNPs@MIPs–AgNPs and UCNPs@NIPs–AgNPs for histamine were determined in the concentration range from 10 mg L−1 to 200 mg L−1, and the relationship of their total adsorption capacities to the concentration of histamine was presented in Fig. 4a.
It can be seen from the static adsorption isotherm curves that the adsorption capacities for both UCNPs@MIPs–AgNPs and UCNPs@NIPs–AgNPs increased along with the increase in the initial concentration of histamine. In addition, the adsorption capacities of UCNPs@MIPs–AgNPs were constantly higher than those of UCNPs@NIPs–AgNPs, which was similar to the results of kinetic adsorption experiments. Specifically, when the concentration was 200 mg L−1, the adsorption capacity of MIPs (3.11 mg g−1) was about 4.5 times that of NIPs (0.70 mg g−1), illustrating that the chemical and physical properties of histamine had been successfully imprinted into UCNPs@MIPs–AgNPs. As a result, UCNPs@MIPs–AgNPs have higher specific recognition ability toward histamine than UCNPs@NIPs–AgNPs and were suitable for further application. Generally, increasing the polarity of the solution reduces the adsorption capacity in both cases.
Scatchard relationship was determined to assess the affinity of UCNPs@MIPs–AgNPs toward histamine. As shown in Fig. 4b, two intersecting straight lines with different slopes corresponding to the high- and low-affinity populations of binding sites were observed in the Scatchard plot. By contrast, UCNPs@NIPs–AgNPs showed nonlinearity, indicating that there was no selective adsorption sites for histamine. To further estimate the binding properties of UCNPs@MIPs–AgNPs, the isotherm absorption data were also processed with the Freundlich and Langmuir adsorption isotherm models and shown in Fig. 5a and b. The results demonstrated that the binding process of histamine with the UCNPs@MIPs–AgNPs could be well fitted by the two isotherm models (R2 = 0.9994 and 0.9754 for Freundlich model and Langmuir model, respectively), indicating that UCNPs@MIPs–AgNPs possessed a heterogeneous binding site distribution.
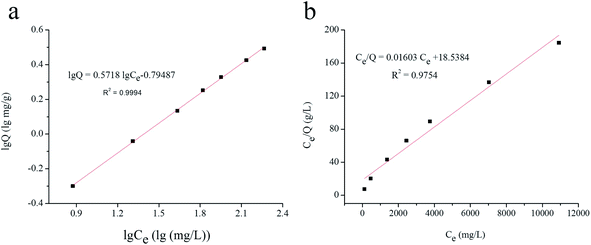 | ||
| Fig. 5 (a) Adsorption isotherms of Freundlich model for UCNPs@MIPs–AgNPs toward histamine; (b) adsorption isotherms of Langmuir model for UCNPs@MIPs–AgNPs toward histamine. | ||
3.2.3.3. Adsorption selectivity. To evaluate the specificity of the UCNPs@MIPs–AgNPs, several analogues of structural features of histamine were selected, including β-phenylethylamine, putrescine, spermidine, spermine, tryptamine, tyramine and cadaverine. The competitive adsorption experiments of these analogues with histamine on the sorbents were carried out with 75 mg L−1 of standard solution. The molecular structures of the analytes and binding amounts of these targets on UCNPs@MIPs–AgNPs and UCNPs@NIPs–AgNPs were shown in Fig. 6. As seen from the figure, histamine owned remarkably higher binding capacity than its analogues, suggesting satisfactory selectivity of the synthesized UCNPs@MIPs–AgNPs for histamine. Table 1 and Table 2 summarized the values of Kd, k and α, which were calculated to evaluate the competitive selective capabilities of UCNPs@MIPs–AgNPs and UCNPs@NIPs–AgNPs. As shown in Table 1, the Kd of histamine was clearly larger than that of the other seven structure analogues of histamine, validating the strong adsorption capacity of UCNPs@NIPs–AgNPs for histamine. In addition, the k value of seven structural analogues for UCNPs@MIPs–AgNPs was several times higher than the corresponding values for UCNPs@NIPs–AgNPs (Table 2), suggesting that the UCNPs@MIPs–AgNPs offering more specific recognition sites for the target molecule (i.e. histamine) than non-target substances. The relatively high α values (>1) of β-phenylethylamine, putrescine, spermidine, spermine, tryptamine, tyramine and cadaverine further confirmed that UCNPs@MIPs–AgNPs for histamine was successfully synthesized and the rebinding occurred specifically and selectively for histamine rather than its structural analogues.
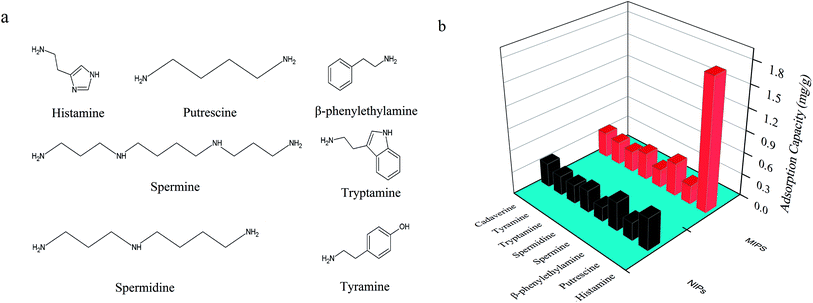 | ||
| Fig. 6 (a) Chemical structures and of histamine and its structural analogues; (b) selective recognition of UCNPs@MIPs–AgNPs and UCNPs@NIPs–AgNPs for histamine and its structural analogues. | ||
| Polymers | Kd (mL g−1) | |||||||
|---|---|---|---|---|---|---|---|---|
| Histamine | β-Phenylethylamine | Putrescine | Spermidine | Spermine | Tryptamine | Tyramine | Cadaverine | |
| UCNPs@MIPs–AgNPs | 27.06 | 6.19 | 3.51 | 5.03 | 3.36 | 3.86 | 4.26 | 4.73 |
| UCNPs@NIPs–AgNPs | 6.06 | 5.39 | 3.32 | 4.11 | 2.62 | 3.45 | 3.57 | 4.49 |
| Polymers | k/α | ||||||
|---|---|---|---|---|---|---|---|
| β-Phenylethylamine | Putrescine | Spermidine | Spermine | Tryptamine | Tyramine | Cadaverine | |
| UCNPs@MIPs–AgNPs | 4.37/3.88 | 7.72/4.23 | 5.38/3.64 | 8.05/3.48 | 7.01/3.99 | 6.35/3.74 | 5.72/4.23 |
| UCNPs@NIPs–AgNPs | 1.13 | 1.83 | 1.48 | 2.32 | 1.76 | 1.70 | 1.35 |
3.3. Analytical performance
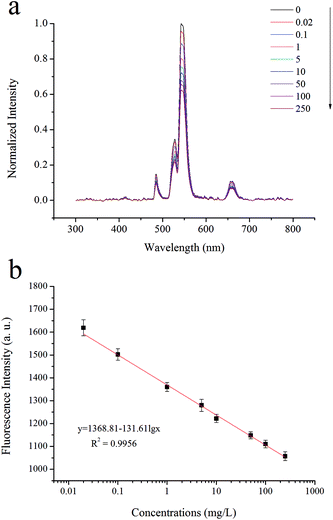
As seen in Fig. 7a, within the histamine concentration range of 0.02–250 mg L−1, the fluorescence intensities of UCNPs@MIPs–AgNPs gradually decreased as the concentration of the target (histamine) increased. Principal component analysis (PCA) was performed to further explain the fluorescence spectra. As shown in Fig. 8a, the explained variation rate for the first two principle components (PCs) was 64% (PC1) and 18% (PC2), respectively, which indicated that the first two PCs could fairly well represent the essential features of the fluorescence spectra. In addition, there was a clear separation tendency between samples containing different levels of histamine, suggesting samples containing different levels of histamine can be well discriminated using fluorescence spectroscopy. There was a good linear relationship (correlation coefficient of 0.9956 for a linear regression fit, y = 1368.81 − 131.61![[thin space (1/6-em)]](https://www.rsc.org/images/entities/char_2009.gif) lg
lg![[thin space (1/6-em)]](https://www.rsc.org/images/entities/char_2009.gif) x (Fig. 7b)) between the fluorescence intensities and the log plot for the concentrations of histamine in samples. Moreover, the detection limit (LOD) and quantitation limit (LOQ) of the sensing system were calculated to be 0.009 mg L−1 and 0.02 mg L−1, respectively.
x (Fig. 7b)) between the fluorescence intensities and the log plot for the concentrations of histamine in samples. Moreover, the detection limit (LOD) and quantitation limit (LOQ) of the sensing system were calculated to be 0.009 mg L−1 and 0.02 mg L−1, respectively.
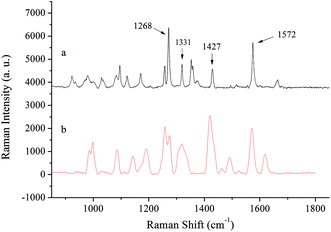 | ||
| Fig. 9 Comparison of (a) normal Raman spectrum of histamine crystal powder and (b) SERS spectrum of histamine solution. | ||
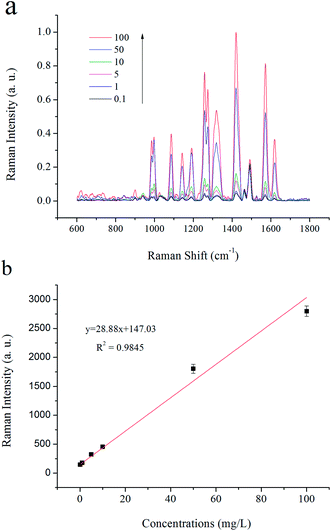 | ||
| Fig. 10 (a) Typical SERS response of UCNPs@MIPs–AgNPs in various histamine concentrations; (b) linear correlation between the SERS Raman intensities and the concentrations of histamine. | ||
For comparison, the analytical performances of some currently used detection methods for histamine reported in the literature are provided in Table 3. As seen from the results, the LOD obtained from the proposed method was significantly lower.
| Methods | Detection range | LODa |
|---|---|---|
| a Limit of detection.b Surface plasmon resonance.c Thin-layer chromatography.d Molecularly imprinted polymers. | ||
| Gas chromatography7 | 100–1000 mg L−1 | 7 mg L−1 |
| Capillary zone electrophoresis9 | 0.0011–0.5550 mg L−1 | 0.0006 mg L−1 |
| High-performance liquid chromatography11 | 2.22–111 mg L−1 | 0.747 mg L−1 |
| Enzyme-linked immunosorbent assay41 | 0.0127–1.8531 mg L−1 | 0.0936 mg mL−1 |
| SPRb-based indirect competitive immunosensor | 0.003–0.01 mg L−1 | 0.003 mg L−1 |
| SPR-based molecularly imprinting42 | 0.025–1 mg L−1 | 0.025 mg L−1 |
| TLCc-based surface enhanced Raman spectroscopy43 | 15–100 mg kg−1 | — |
| MIPsd-based surface enhanced Raman spectroscopy4 | 3–90 mg L−1 | — |
| Electrochemical sensing8 | 40–170 mg L−1 | 38 mg L−1 |
| The developed method | 0.1–100 mg L−1/0.02–250 mg L−1 | 0.04/0.009 mg L−1 |
3.4. Analytical application
The accuracy of the proposed dual mode bioassay for determining histamine levels in real food samples was evaluated by detecting histamine in red wine, rice wine and canned tuna samples spiked with a series of known quantities of histamine (5, 15 and 30 mg L−1). The results of recoveries were summarized in Table 4. All of the three spiking levels in red wine, rice wine and canned tuna samples showed good recoveries. It was worth noting that the recovery results of canned tuna ranged from 85.06% to 117.36%, which were not as good as the results from wine samples (93.30–108.30%). This could be due to the fact that the matrix in canned tuna was more complex than that of red wine and rice wine samples. In addition, food samples spiked with histamine at three levels were analyzed by HPLC-UV to verify the practicability of the developed method. No significant difference (p > 0.05) in the results were observed from the proposed analysis and those obtained with HPLC-UV, indicating that the proposed method had great potential for histamine detection in red wine and rice wine samples.| Sample | Background content (mg kg−1 or mg L−1) | Spiked levels (mg L−1) | Detection results | ||||
|---|---|---|---|---|---|---|---|
| HPLC-UV | Detected by UCNPs@MIPs–AgNPs | ||||||
| Fluorescence mode | Recovery ratio (%) | SERS mode | Recovery ratio (%) | ||||
| Red wine | 0.34 | 5 | 5.48 | 5.78 | 108.30 | 5.46 | 102.23 |
| 0.34 | 15 | 15.66 | 16.12 | 105.09 | 15.13 | 98.64 | |
| 0.34 | 30 | 30.15 | 32.50 | 107.12 | 30.26 | 99.72 | |
| 2.58 | 5 | 7.15 | 7.19 | 94.88 | 7.38 | 97.33 | |
| 2.58 | 15 | 18.05 | 17.26 | 98.17 | 17.86 | 101.61 | |
| 2.58 | 30 | 32.89 | 31.80 | 97.60 | 31.21 | 95.81 | |
| Rice wine | 0.23 | 5 | 5.66 | 5.063 | 96.81 | 4.92 | 94.09 |
| 0.23 | 15 | 15.49 | 14.21 | 93.30 | 15.92 | 104.53 | |
| 0.23 | 30 | 28.97 | 29.91 | 98.94 | 28.35 | 93.78 | |
| 5.76 | 5 | 10.22 | 11.47 | 106.60 | 10.83 | 100.65 | |
| 5.76 | 15 | 20.05 | 19.66 | 94.70 | 21.24 | 102.31 | |
| 5.76 | 30 | 35.90 | 37.16 | 103.91 | 35.28 | 98.66 | |
| Canned tuna | 0.19 | 5 | 5.27 | 4.82 | 92.87 | 5.39 | 103.85 |
| 0.19 | 15 | 15.03 | 16.56 | 109.02 | 17.23 | 113.43 | |
| 0.19 | 30 | 30.32 | 35.43 | 117.36 | 25.68 | 85.06 | |
| 0.87 | 5 | 5.64 | 5.65 | 96.25 | 5.37 | 91.48 | |
| 0.87 | 15 | 16.05 | 13.79 | 86.89 | 15.06 | 94.90 | |
| 0.87 | 30 | 31.31 | 28.17 | 91.25 | 33.34 | 108.00 | |
Compared to the commonly used quantum dots (QDs) and organic dyes, UCNPs has lower autofluorescence background, better photochemical stability, larger Stokes shifts nonblinking property and lower toxicity. These outstanding photo-physical properties make it a potential candidate for further studies. In this study, by integrating fluorescence sensing and SERS, we have established a dual mode counterpropagating-responsive method for the detection of histamine. With this dual-mode system, positive SERS response and negative fluorescence response could be achieved simultaneously, which ensured more reliable and precise quantification of histamine compared with single fluorescence sensing or SERS-based method. We believe that our method shows excellent promise in the quantitation of harmful chemicals in food products.
4. Conclusions
A novel sensor combined the sensitivity of the upconverting and SERS technologies and the specificity of MIPs was developed. Excellent reorganization specificity, wide linear range and a low detection limit were achieved using this sensing system. In addition, the fabricated system was successfully applied to detect histamine in red wine, rice wine and canned tuna samples with good recovery. The novel strategy demonstrated great potential in sensitive and economic detection of histamine in wine samples required by both government laboratories and food industry. This easy-to-operate method could be extended to detect other hazardous substances in food samples.Conflicts of interest
There are no conflicts of interest to declare.Acknowledgements
This research was supported by funds from USDA-ARS (No. 1935-42000-049-00D) in conjunction with the Center for Food Safety Engineering at Purdue University, the Nature Science Foundation of Jiangsu Province (No. BK20160168), the National Key Technology R&D Program for the 12th Five-Year Plan (No. 2016YFD0400304), the independent research project program of the State Key Laboratory of Food Science and Technology of Jiangnan University (No. JUSRP1029), the Nature Science Foundation of China (No. 31601413 and 31501418) and the graduate student innovation project of Jiangsu province (KYLX15_1134). The author Wu Zhengzong is thankful for the funding from Chinese Scholarship Council (CSC).References
- J. Collado, I. Tunon, E. Silla and F. Ramírez, J. Phys. Chem. A, 2000, 104, 2120–2131 CrossRef CAS.
- J. W. Black, W. A. M. Duncan, C. J. Durant, C. R. Ganellin and E. M. Parsons, Nature, 1972, 236, 385–390 CrossRef CAS PubMed.
- J. Dai, Y. Zhang, M. Pan, L. Kong and S. Wang, J. Agric. Food Chem., 2014, 62, 5269–5274 CrossRef CAS PubMed.
- F. Gao, E. Grant and X. Lu, Anal. Chim. Acta, 2015, 901, 68–75 CrossRef CAS PubMed.
- T. Janči, D. Valinger, J. Gajdoš Kljusurić, L. Mikac, S. Vidaček and M. Ivanda, Food Chem., 2017, 224, 48–54 CrossRef PubMed.
- S. Phuvasate and Y.-C. Su, Food Control, 2010, 21, 286–291 CrossRef CAS.
- F. R. Antoine, C.-i. Wei, W. S. Otwell, C. A. Sims, R. C. Littell, A. D. Hogle and M. R. Marshall, J. Agric. Food Chem., 2002, 50, 4754–4759 CrossRef CAS PubMed.
- J. A. Young, X. Jiang and J. R. Kirchhoff, Electroanalysis, 2013, 25, 1589–1593 CrossRef CAS.
- L.-Y. Zhang and M.-X. Sun, J. Chromatogr. A, 2004, 1040, 133–140 CrossRef CAS PubMed.
- D. E. Schutz, G. W. Chang and L. F. Bjeldanes, J. – Assoc. Off. Anal. Chem., 1976, 59, 1224–1225 CAS.
- J. Kirschbaum, I. Busch and H. Brückner, Chromatographia, 1997, 45, 263–268 Search PubMed.
- A. Marcobal, M. C. Polo, P. J. Martín-Álvarez and M. V. Moreno-Arribas, Food Res. Int., 2005, 38, 387–394 CrossRef CAS.
- Z. Wu, E. Xu, J. Li, J. Long, A. Jiao and Z. Jin, RSC Adv., 2016, 6, 109442–109452 RSC.
- D. Cozzolino, Appl. Spectrosc. Rev., 2016, 51, 302–317 CrossRef.
- P. Meksiarun, M. Ishigaki, V. A. Huck-Pezzei, C. W. Huck, K. Wongravee, H. Sato and Y. Ozaki, Sci. Rep., 2017, 7, 44890 CrossRef CAS PubMed.
- B. Zhang, H. Tao, X. Niu, S. Li and H.-Q. Chen, Food Chem., 2017, 227, 137–141 CrossRef CAS PubMed.
- Z. Wu, E. Xu, M. F. J. Chughtai, Z. Jin and J. Irudayaraj, Food Chem., 2017, 230, 673–680 CrossRef CAS PubMed.
- R. Hao, C. Ye, X. Wang, L. Zhu, S. Chen, J. Yang and X.-T. Tao, J. Phys. Chem. C, 2017, 121, 13524–13531 CAS.
- D. Mendez-Gonzalez, M. Laurenti, A. Latorre, A. Somoza, A. Vazquez, A. I. Negredo, E. López-Cabarcos, O. G. Calderón, S. Melle and J. Rubio-Retama, ACS Appl. Mater. Interfaces, 2017, 9, 12272–12281 CAS.
- X. Liu, L. Su, L. Zhu, X. Gao, Y. Wang, F. Bai, Y. Tang and J. Li, Sens. Actuators, B, 2016, 233, 394–401 CrossRef CAS.
- P. Vilela, A. El-Sagheer, T. M. Millar, T. Brown, O. L. Muskens and A. G. Kanaras, ACS Sens., 2016, 2, 52–56 CrossRef PubMed.
- C. Drees, A. N. Raj, R. Kurre, K. B. Busch, M. Haase and J. Piehler, Angew. Chem., Int. Ed., 2016, 55, 11668–11672 CrossRef CAS PubMed.
- Y. Wang, K. Lee and J. Irudayaraj, Chem. Commun., 2010, 46, 613–615 RSC.
- Y. Wang and J. Irudayaraj, Philos. Trans. R. Soc., B, 2013, 368, 20120026 CrossRef PubMed.
- B. Ankamwar, U. K. Sur and P. Das, Anal. Methods, 2016, 8, 2335–2340 RSC.
- Y. Wang, K. Lee and J. Irudayaraj, J. Phys. Chem. C, 2010, 114, 16122–16128 CAS.
- S. P. Ravindranath, K. L. Henne, D. K. Thompson and J. Irudayaraj, ACS Nano, 2011, 5, 4729–4736 CrossRef CAS PubMed.
- A. Martín-Esteban, TrAC, Trends Anal. Chem., 2013, 45, 169–181 CrossRef.
- M. L. Yola, T. Eren and N. Atar, Sens. Actuators, B, 2015, 210, 149–157 CrossRef CAS.
- S. E. Diltemiz, R. Say, S. Büyüktiryaki, D. Hür, A. Denizli and A. Ersöz, Talanta, 2008, 75, 890–896 CrossRef CAS PubMed.
- S. Feng, F. Gao, Z. Chen, E. Grant, D. D. Kitts, S. Wang and X. Lu, J. Agric. Food Chem., 2013, 61, 10467–10475 CrossRef CAS PubMed.
- Y. Hu, S. Feng, F. Gao, E. C. Y. Li-Chan, E. Grant and X. Lu, Food Chem., 2015, 176, 123–129 CrossRef CAS PubMed.
- S. Dai, S. Wu, N. Duan and Z. Wang, Talanta, 2016, 158, 246–253 CrossRef CAS PubMed.
- E. D. Asuquo and A. D. Martin, J. Environ. Chem. Eng., 2016, 4, 4207–4228 CrossRef CAS.
- B. Wei, C. Cai, B. Xu, Z. Jin and Y. Tian, Food Chem., 2018, 240, 165–173 CrossRef CAS.
- P. Liu, R. Liu, G. Guan, C. Jiang, S. Wang and Z. Zhang, Analyst, 2011, 136, 4152–4158 RSC.
- Y. Hu and X. Lu, J. Food Sci., 2016, 81, N1272–N1280 CrossRef CAS PubMed.
- Y. Wang, S. Ren, H. Jiang, Y. Peng, J. Bai, Q. Li, C. Li, Z. Gao and B. Ning, RSC Adv., 2017, 7, 22215–22221 RSC.
- Y. Tang, J. Gao, X. Liu, J. Lan, X. Gao, Y. Ma, M. Li and J. Li, Food Chem., 2016, 201, 72–79 CrossRef CAS PubMed.
- T. Janči, L. Mikac, M. Ivanda, N. Marušić Radovčić, H. Medić and S. Vidaček, J. Raman Spectrosc., 2017, 48, 64–72 CrossRef.
- L. Luo, Z.-L. Xu, J.-Y. Yang, Z.-L. Xiao, Y.-J. Li, R. C. Beier, Y.-M. Sun, H.-T. Lei, H. Wang and Y.-D. Shen, J. Agric. Food Chem., 2014, 62, 12299–12308 CrossRef CAS PubMed.
- S. Jiang, Y. Peng, B. Ning, J. Bai, Y. Liu, N. Zhang and Z. Gao, Sens. Actuators, B, 2015, 221, 15–21 CrossRef CAS.
- Z. Xie, Y. Wang, Y. Chen, X. Xu, Z. Jin, Y. Ding, N. Yang and F. Wu, Food Chem., 2017, 230, 547–552 CrossRef CAS PubMed.
| This journal is © The Royal Society of Chemistry 2017 |

