 Open Access Article
Nonlinear oscillatory dynamics of the hardening of calcium phosphate bone cements
Vuk Uskoković *ab and
Julietta V. Rauc
aAdvanced Materials and Nanobiotechnology Laboratory, Department of Biomedical and Pharmaceutical Sciences, Center for Targeted Drug Delivery, Chapman University School of Pharmacy, Irvine, CA 92618-1908, USA. E-mail: vuk21@yahoo.com
bDepartment of Bioengineering, University of Illinois, Chicago, IL 60607-7052, USA
cIstituto di Struttura della Materia, Consiglio Nazionale delle Ricerche (ISM-CNR), Via del Fosso del Cavaliere, 100-00133 Rome, Italy
First published on 21st August 2017
Abstract
Here we report on the nonlinear, oscillatory dynamics detected in the evolution of phase composition during the setting of different calcium phosphate cements, two of which evolved toward brushite and one toward hydroxyapatite as the final product. Whereas both brushite-forming cements contained ion-doped β-tricalcium phosphate as the initial phase, the zinc-containing one yielded scholzite as an additional phase during setting and the oscillations between these two products were pronounced throughout the entire 80 h setting period, long after the hardening processes was over from the mechanical standpoint. Oscillations in the copper-containing system involved the amount of brushite as the main product of the hardening reaction and they progressed faster toward an equilibrium point than in the zinc-containing system. Initially detected with the use of in situ energy-dispersive X-ray diffractometry, the oscillations were confirmed with a sufficient level of temporal matching in an in situ Fourier transform infrared spectroscopic analysis. The kinetic reaction analysis based on the Johnson–Mehl–Avrami–Kolmogorov model indicated an edge-controlled nucleation mechanism for brushite. The hydroxyapatite-forming cement comprised gelatin as an additional phase with a role of slowing down diffusion and allowing the detection of otherwise rapid oscillations in crystallinity and in the amount of the apatitic phase on the timescale of minutes. A number of possible causes for these dynamic instabilities were discussed. The classical chemical oscillatory model should not apply to these systems unless in combination with less exotic mechanisms of physicochemical nature. One possibility is that the variations in viscosity, directly affecting diffusion and nucleation rates and accompanying growth and transformation from the lower to the higher interfacial energy per the Ostwald–Lussac rule, are responsible for the oscillatory dynamics. The conception of bone replacement materials and tissue engineering constructs capable of engaging in the dynamics of integration with the natural tissues in compliance with this oscillatory nature may open a new avenue for the future of this type of medical devices. To succeed in this goal, the mechanism of these and similar instabilities must be better understood.
1. Introduction
Life is pervaded with nonlinear, far-from-equilibrium dynamics to such an extent that linear phenomena present a comparative rarity.1–3 To promote solvability of physical models and predictability of physical phenomena, naturally nonlinear processes are linearized using specific mathematical and phenomenological approximations, such as the invocation of small and harmonic oscillations, small amplitude waves propagating through homogenous environments, infinitesimal temperature changes, depiction of atoms as ideal, non-compressible spheres, and so on. This habit to linearize the nonlinear is, in fact, so pervasive that the models are frequently confused with the reality and it has become customary to perceive a plethora of inherently nonlinear processes as ostensibly linear.4 It is being neglected that the linearity of quantum mechanics and relativity theory are thanks to the assumption of dimensional infinity and the neglect of the infinite number of terms of the energy–mass relation series, respectively. In contrast to the nonlinear physical reality, synthetic materials and devices have been traditionally built around the concept of equilibrium dynamics. For example, the linear, zero-order kinetics of drug release is still most sought in controlled drug delivery, while the oscillatory response is a nightmare of most sensory device developers. Yet, without embodying nonlinear responses, the memory effect, the hierarchical superstructures, emergence properties and other advanced features cannot be created in materials. From today's perspective, it is doubtful if the methods based on thermodynamic equilibrium can yield some of the most sophisticated features that endow life, from creative intelligence to self-regeneration to autopoiesis. Moreover, to advance the concepts of biomimetics and biomimicry forward, it may be necessary to conceive materials and processes that integrate the principles of nonlinearity therein.Oscillatory behavior under steady state has been traditionally associated with complex chemical reactions in solution,5–7 but is commonly detected at the quantum scale too.8–10 More seldom it has been observed involving gas catalysis on solid surfaces.11–13 Its theoretical descriptions have been relatively rudimentary and there is a consensus that the understanding of the underlying mechanisms is generally poor.14 Oscillatory behavior involving material transport phenomena and phase transitions at the solid/liquid interface is detected even more rarely. Traditionally, chemical reactions are depicted as proceeding linearly from the reactants to the products until a state of equilibrium is reached. This pathway, however, broken down to infinitesimally small steps, is composed of alternations in the reaction direction – from the reactants to the products and from the products to the reactants – that, taken as a whole, still yield to the global direction of the reaction path. Such oscillations often proceed unnoticed, but in the presence of specific inhibitors in networked, multicomponent systems with a sufficient number of intermediaries and significantly slowed diffusion, they can be magnified and detected at timescales on the order of seconds to minutes to even hours, depending on the nature and the conditions of the reaction. Here we report on the detection of such oscillations in the setting reaction of three different self-setting calcium phosphate (CP) cements.
Developed in late 1980s and approved by the FDA in 1996,15 self-setting CP cements remain state-of-the-art inorganic bone fillers. They are typified by excellent osteoconductivity; perfect fit to the bone defect geometry; intimate bone interface and union; and good flow properties and injectability for a pure inorganic material. Given that their viscosity depends on the shear rate and deformation history, self-setting CP cements are non-Newtonian fluids characterized by a nonlinear rheology. Their main downside comes from setting in relatively dense forms in the absence of additives acting as porogens.16,17 These nonporous forms are nowadays being challenged by tissue engineering constructs with precisely designed porosities that allow for cell infiltration and superior integration with the adjacent bone.18 The setting reaction in CP cements follows one out of two possible paths, one ending with brushite as the final product and the other one ending with hydroxyapatite (HAp).19 In this study, we tested variations to both of these cement types.
2. Experimental
Zn2+- and Cu2+-substituted β-tricalcium phosphate (β-TCP, whitlockite) powders were obtained by admixing Cu(NO3)2 or Zn(NO3)2 aqueous solutions conforming to Ca2.917Cu/Zn0.083(PO4)2 stoichiometry to an aqueous solution of Ca(NO3)2 and then adding (NH4)2HPO4, while maintaining the solution at neutral pH conditions during precipitation. Specifically, to prepare Zn/Cu-TCP, 875 ml of 0.5 M Ca(NO3)2 and 125 ml of 0.1 M Cu(NO3)2 or Zn(NO3)2 × 6H2O were mixed and 667 ml of 0.5 M (NH4)2HPO4 was added dropwise over the course of 10 min. The pH of the solution was kept at around 7 throughout the reaction by adding concentrated ammonia solution. This was done to minimize the alkalinity, but ensure the precipitation of apatite and not brushite, thus minimizing the chances for the formation of pyrophosphate as the secondary phase during calcination.20 After 30 min of aging, the precipitate was filtered, washed with distilled water, dried at 80 °C and then calcined at 900 °C to remove the traces of NH4NO3 and to form the partially Zn2+/Cu2+-substituted whitlockite structure.Zn2+- and Cu2+-substituted β-TCP cements were obtained by mixing the given β-TCP powders with monocalcium phosphate monohydrate (Ca(H2PO4)2 × H2O, MCPM) and carbonated HAp at the weight ratio of 1![[thin space (1/6-em)]](https://www.rsc.org/images/entities/char_2009.gif) :
:![[thin space (1/6-em)]](https://www.rsc.org/images/entities/char_2009.gif) 0.764
0.764![[thin space (1/6-em)]](https://www.rsc.org/images/entities/char_2009.gif) :
:![[thin space (1/6-em)]](https://www.rsc.org/images/entities/char_2009.gif) 0.091, and then adding a 0.45 M aqueous solution of citric acid. The powder-to-liquid ratio was 4.08 g ml−1. The main product of both setting reactions was dicalcium phosphate dihydrate (DCPD, brushite) per the following equation:
0.091, and then adding a 0.45 M aqueous solution of citric acid. The powder-to-liquid ratio was 4.08 g ml−1. The main product of both setting reactions was dicalcium phosphate dihydrate (DCPD, brushite) per the following equation:
| Ca3(PO4)2 + Ca(H2PO4)2·H2O + 7H2O → 4CaHPO4·2H2O | (1) |
Gelatin-containing HAp cement was fabricated by mixing 25 ml of 5 wt% porcine-skin-derived type A gelatin (Sigma) containing 500 μl of tetraethylorthosilicate (Sigma) with a HAp suspension prepared by adding 3 ml of 1 M NH4H2PO4 (aq.) (Fisher Scientific) dropwise to 2.5 ml of 2 M Ca(NO3)2 (aq.) (Fisher Scientific) and then adding 9 ml of concentrated, 28% NH4OH (Sigma Aldrich) and 85 ml of deionized, Millipore water and bringing to boil. Right after the boiling point was reached, the two solutions were mixed and stirred at 400 rpm. The colloid was sedimented by centrifugation and washed with deionized water. The resulting precipitate comprising poorly crystalline HAp embedded in a gelatinous matrix was dried overnight in vacuum (−25 mmHg, Savant SPD1010 Speedvac concentrator). The dried powders crushed in a mortar down to fine particle size were mixed with 2 wt% NaH2PO4 (Fisher Scientific) as the liquid phase in 0.33 mg μl−1 powder-to-liquid ratio to yield the cements. Vortex-mixing was performed in almost full Eppendorf tubes to minimize the exposure to air and the dissipation of the paste on the tube walls.
The control, amorphous CP powder was prepared by abruptly adding a solution containing 100 ml 0.5 M Ca(NO3)2 and 7 ml 28% NH4OH into a solution comprising 100 ml 0.2 M NH4H2PO4 and 4 ml 28% NH4OH. The fine precipitate formed upon mixing was aged for 15 s before it was collected, centrifuged, washed with 0.14 w/v% NH4OH, centrifuged again, and dried overnight at low pressure (p = −20 mmHg) and room temperature. The pH of the supernatant following the precipitation reaction was 9.3. The powder was turned into a cement by mixing it with a 2 wt% aqueous solution of Na2HPO4 at the 1.782 g ml−1 solid-to-liquid ratio using a digital vortex mixer (Fisher Scientific) for 5 min at 2000 rpm.
X-ray diffractograms (XRDs) were recorded in situ, at different time points of the setting reaction, either on a Rigaku D/Max-2500 or a Bruker D2 Phaser diffractometer. Time-resolved XRD characterization of the setting and hardening of Zn- and Cu-TCP cements was carried out by means of a homemade energy-dispersive XRD (EDXRD) instrumentation21–23 equipped with a W X-ray tube operating at 50 kV, 30 mA, 200 μm wide apertures and θ° = 5°. After manual mixing with a putty knife, a small quantity of the cement was placed on a low scattering glass sample holder and quickly transferred to the optical center of the diffractometer. The semi-quantitative method based on relative intensity ratios (RIR) compared to the corundum standard24 was applied to estimate the weight ratio between crystalline phases at each time point. The following equation was used to calculate the weight content of phase α (Wα) in a mixture of n phases, with RIR values taken as 1.10 for hydroxyapatite (HAp), 1.42 for brushite (DCPD), 0.71 for monetite (DCPA), 0.45 for α-TCP and 1.20 for β-TCP (PDF, ICDD) for Cu Kα irradiation source, and Iα being the intensity of the most intense reflection of the phase α:
 | (2) |
The degree of crystallinity, Xc, in HAp was calculated in relation to the absolute intensity of the (300) reflection, I300, and the absolute intensity of the hollow between (112) and (300) reflections, V112–300, which disappears in non-crystalline samples.
 | (3) |
XRDs converted to compositional values were analyzed using the Johnson–Mehl–Avrami–Kolmogorov (JMAK) nucleation-growth kinetic model.25 The following relationship was used to derive the Avrami rate constant, k, for crystallization of DCPD and the Avrami exponent, n, related to nucleation mechanism, where the extent of the reaction, α, was determined as the ratio of a selected diffraction peak at time t and at its maximal value during the reaction:
| ln[−ln(1 − α)] = nln(k) + nln(t) | (4) |
Absolute intensities of the diffraction peaks were measured as their maximal height, while integrated intensities were measured by calculating a background function and deconvoluted peak profile using an automated Gaussian-fitting routine (OriginPro 2016). Correlations between the diffraction intensities and compositional variables are semi-quantitative and the pronounced scale and repeatability of the appearance of detected oscillations, significantly minimized in control solid samples and in cements at later stages of the setting reaction, presents the basis for arguments that follow. Fourier transform infrared spectroscopy (FT-IR) was used to additionally follow the setting reaction over time, and the analysis was done on a Bruker Alpha Platinum ATR spectrometer.
Degrees of saturation (DS) for different CP phases were calculated using an algorithm based on Debye–Hückel equation:
| DS = pKsp − pQ | (5) |
| Q = {Ca2+}x{PO43−}y{H+}z{OH−}w | (6) |
Q is the ionic activity product of the solution, and pKsp is the negative logarithm of the solubility product of a given CP phase, equaling 117.3 for HAp, 6.6 for DCPD, 29.5 for β-TCP, and 48.4 for octacalcium phosphate (OCP). Activity coefficients were calculated through log![[thin space (1/6-em)]](https://www.rsc.org/images/entities/char_2009.gif) γ = −Azi2I1/2, where zi is the charge number of ion species i, I is the ionic strength of the solution, and A is the constant depending on the dielectric constant of the solution, temperature and Debye screening length.
γ = −Azi2I1/2, where zi is the charge number of ion species i, I is the ionic strength of the solution, and A is the constant depending on the dielectric constant of the solution, temperature and Debye screening length.
3. Results
3.1. Zn-TCP cement
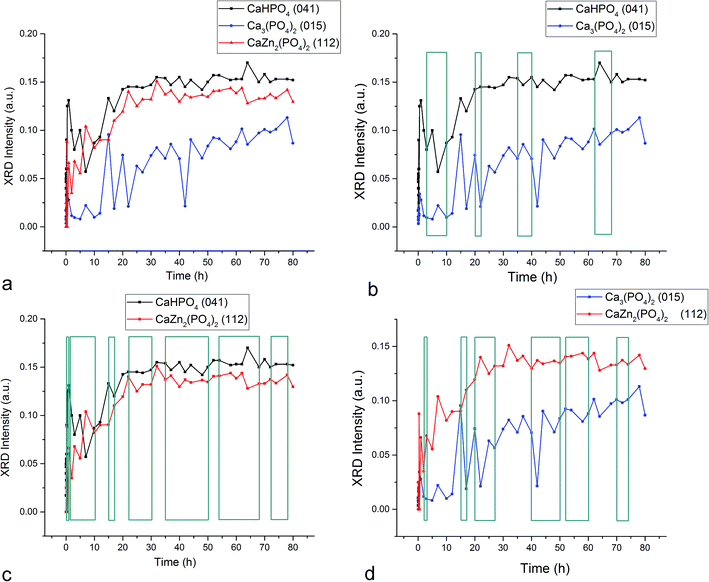
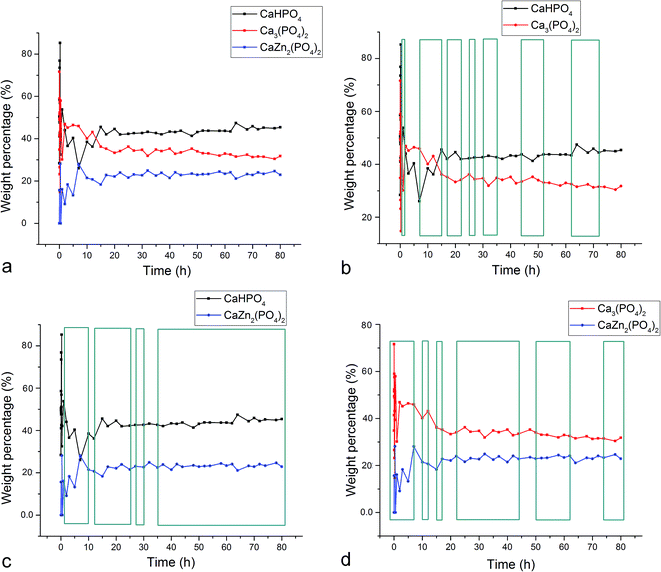
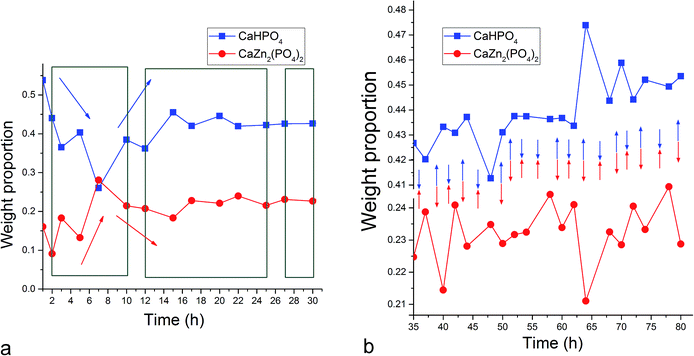
Fig. 1–3 display the diffraction intensity and compositional oscillations between the three different crystalline phases detected during the setting of the Zn-TCP cement: brushite (DCPD, CaHPO4 × 2H2O), partially zinc-substituted β-tricalcium phosphate (β-TCP, Ca3(PO4)2/Ca3−xZnx(PO4)2) and zinc calcium phosphate (ZCP, CaZn2(PO4)2 × 2H2O) a.k.a. scholzite, a dihydrous compound crystallizing in the dipyramidal orthorhombic Pbmm/Pbc21 space group symmetry (mm2 point group). Oscillations between two phases are noted within any given time range whenever the presence of one phase increased on the expense of the diminished presence of another. The most pervasive oscillations of this type were observed between the two major final phases of the setting reaction, absent in the initial composition: DCPD and ZCP. These oscillations were present in 75% of the first 80 h of the reaction for the diffraction intensity (Fig. 1c) and 88% for the calculated composition, including the entire time span from 35 to 80 h (Fig. 2c). Oscillations involving either of the two products, DCPD or ZCP, and the initial phase of the reaction, partially Zn-substituted β-TCP, excluded each other, as can be seen by comparing Fig. 1b and d. Namely, in whatever the time range the oscillations between β-TCP and DCPD were present, they were absent between β-TCP and ZCP. Added to one another, however, they occur in 72% of the total reaction time. This suggests that the two reaction products, DCPD and ZCP, form in separate reaction paths and are connected by the initial and central component, Zn-substituted β-TCP. Per eqn (7), any increase in the amount of DCPD forming from β-TCP would rebalance the reaction per Le Chatelier's principle in such a manner that some of the ZCP, lying on the opposite end of the reaction, would transform back to β-TCP. Similar depletion of DCPD in the product would entail the formation of ZCP per eqn (7). This explains how the oscillations between β-TCP and ZCP exclude those between β-TCP and DCPD, while oscillations between DCPD and ZCP dominate the reaction.| DCPD ⇌ β-TCP ⇌ ZCP | (7) |
The fact that the initial phase, β-TCP, remains in the system (Fig. 1a) and steadies at around 30 wt% of the product mass (Fig. 2a) facilitates the extended duration of oscillations, which would have been shorter had the phase transformation been more complete. As a result, oscillations between the two phases of the product, DCPD and ZCP, were sustained throughout the entire 80 h period following the onset of the setting reaction. Between each of the 19 data points in the 35–80 h time range, the trend was the same: one of these two phases increased in abundance at the expense of another (Fig. 3c). Although the cement set within a minute26 (Fig. 4), as confirmed by the attainment of the right mechanical integrity (ISO9917E), it is apparent that the internal phase transformations extend far beyond the scale of the mechanical setting. On the other hand, oscillations in compressive strength previously observed in a chitosan–DCPD cement similarly extended beyond the end of the minutes-long setting time, into the 10–60 h time range, and correlated well with a change in the intensity of diffraction from the (120) plane,27 suggesting that even the mechanical properties of the bulk, hardened cement are subject to change even after the hardening process is considered over per the standard, Vicat or Gilbert needle tests. As determined by neutron Compton scattering,28 such fluctuations in mechanical properties, specifically fracture toughness, extending over 62 h of the setting of a glass ionomer cement are paralleled by oscillations of atomic events, including hydration, fluorination, calcium binding and aluminium coordination change due to chelation by the polymeric phase, with the significant involvement of the amorphous matrix, whose inherent far-from equilibrium structure due to the trapping of the excess enthalpy during the quenching of the melt may be a possible factor predisposing cements for the displays of such nonlinear dynamics.
3.2. Cu-TCP cement
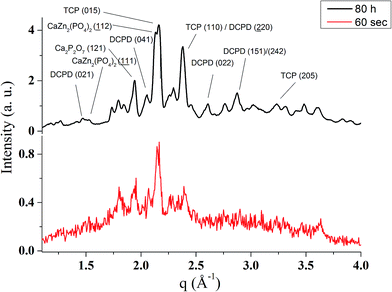
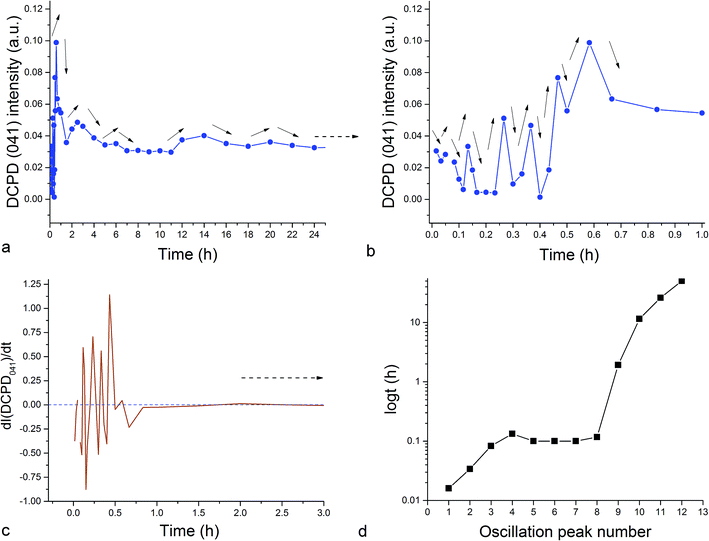
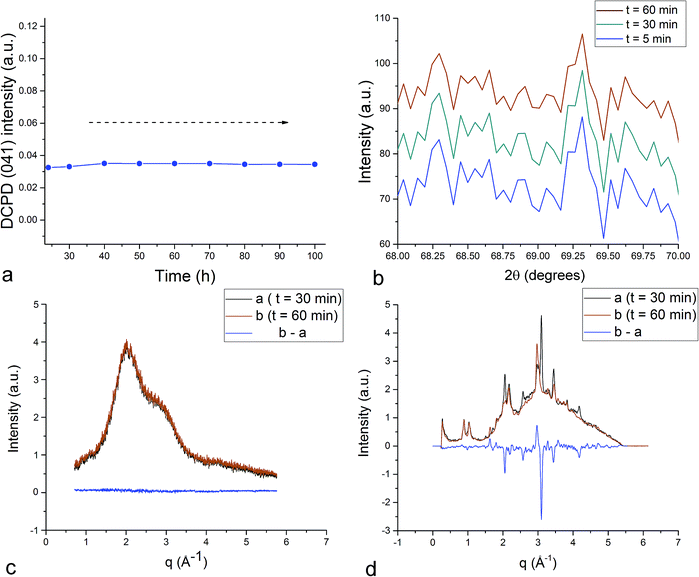
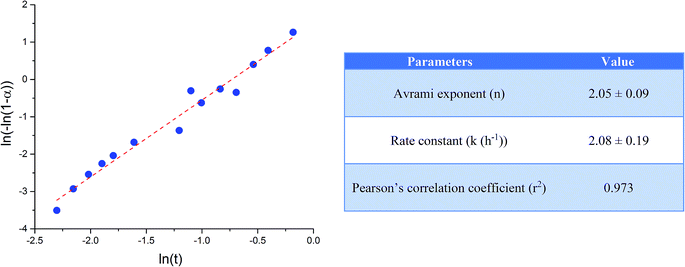
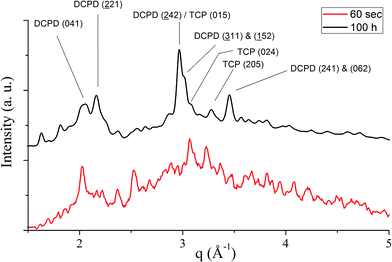
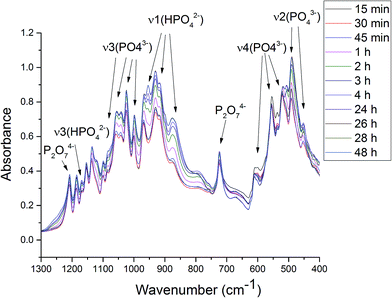
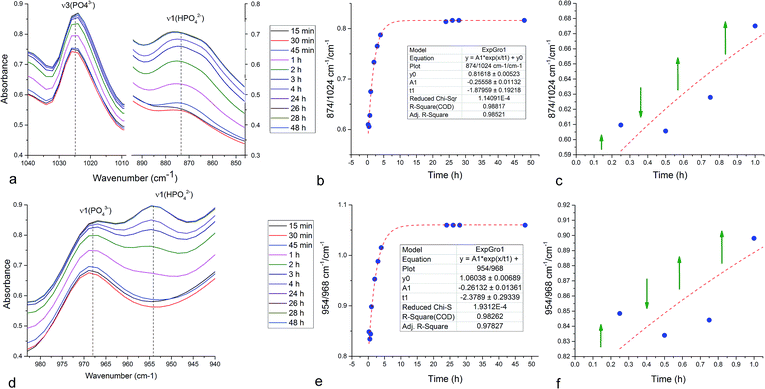
Unlike in the case of the Zn-TCP cement, where the initial reactant produced two different products in opposite paths, yielding an oscillation between the diffraction intensities and weight proportions of the two, in the case of the Cu-TCP cement, the initial reactant yielded a single reaction product. Oscillations were observed, but in a more trivial manner, involving the diffraction intensity and concentration of the main product: DCPD. Fig. 5 thus shows the oscillation in the absolute intensity of the most intense, (041) reflection of the product. This intensity reaches a maximum on the 30th minute of the setting reaction, but then drops and eventually settles, after a series of oscillations, at 35% of this maximal value (Fig. 5a), at which point the oscillations have decreased in the intensity and fallen below the detection limit of the device. Similar oscillations, progressing toward an equilibrium point, were observed for two other major diffraction intensity peaks: (−242) and (241)/(062).29 The magnitude of oscillations of the concentration of the product in the setting cement decreases over time (Fig. 5c), while the periodicity between the peaks in diffraction intensity increases (Fig. 5d). This periodicity increase follows an exponential route in the first 16 min of the setting reaction, before plateauing until the 35th minute, when it began to follow the exponential dependence until the last time point of the reaction (100 h). To exclude the possibility that the detected oscillations are of an instrumental error origin, it should be noted that they were absent in control solid samples (silicon, corundum) and that the absolute intensities varied minimally in the later stages of the setting reaction, e.g., from the 30th to the 100th hour (Fig. 6a), the standard deviation was only 0.80% of the mean, as compared to 81.87% of the mean of the intensities in the first hour of the reaction. Simultaneously, a control cement comprising only an amorphous CP phase displayed a negligible difference between XRD patterns at some of the adjacent timepoints (Fig. 6b) during the 2 h long process of hardening into HAp. The comparison between the flat pattern obtained by subtracting two proximal timepoints (60–30 min) in this control (Fig. 6c) and the fluctuant corresponding pattern (Fig. 6d) in the Cu-TCP cement presents another evidence in favor of the veracity of oscillatory changes detected in the latter material. Following the linear portion of the evolution of the (−242) diffraction peak of DCPD in this early time range allowed for the determination of the Avrami exponent, n, and the reaction rate constant, k (Fig. 7). The more intensely nonlinear, oscillatory evolution of other analyzed reflections, including (041) and (241)/(062), did not give satisfactory correlations. The Avrami exponent value of 2 is indicative of the edge-controlled nucleation mechanism, as opposed to 1 for surface and 3 for point sites, and agrees with the earlier scanning probe microscopy studies demonstrating that step edges, not facets, are the docking sites for ionic growth units and molecular growth modifiers in DCPD.30 The initial and the final XRD patterns of the Cu-TCP cement during the hardening reaction, captured after 60 seconds and 100 hours, respectively, are shown in Fig. 8.In an attempt to detect the phase oscillations in the Cu-TCP cement using a complementary technique, the hardening process was monitored in situ using FT-IR. The overlay of spectra recorded at different timepoints of the setting reaction are shown in Fig. 9. A characteristic HPO42− band, a signature of DCPD,31 was distinguishable at 874 cm−1 and used to estimate the amount of DCPD in the mixture in comparison with the ν3 PO43− doublet at 1024 and 999 cm−1 (Fig. 10a). The PO43− triplet appearing at 914, 932 and 965 cm−1 (ν1) and the band at 450 cm−1 (ν2) are equally indicative of the presence of TCP.32 The same calculation was carried out for two adjacent bands: ν1(P–O) symmetric stretch of PO43− at 970 cm−1 and ν1(P–O(H)) symmetric stretch of HPO42− at 954 cm−1 (Fig. 10d). In both cases, an exponential rate (R2 = 0.98817 and 0.98262, respectively) of the increase in the amount of DCPD, the main reaction product, normalized to the amount of the main reactant, TCP, was derived (Fig. 10b and e). However, in the first hour of the reaction, an oscillation in the concentration of DCPD was observed, marked by a drop in the given band intensity ratio between the 15th and the 45th minute of the reaction (Fig. 10c and f), coinciding with a similar drop observed in the XRD analysis (Fig. 5b).
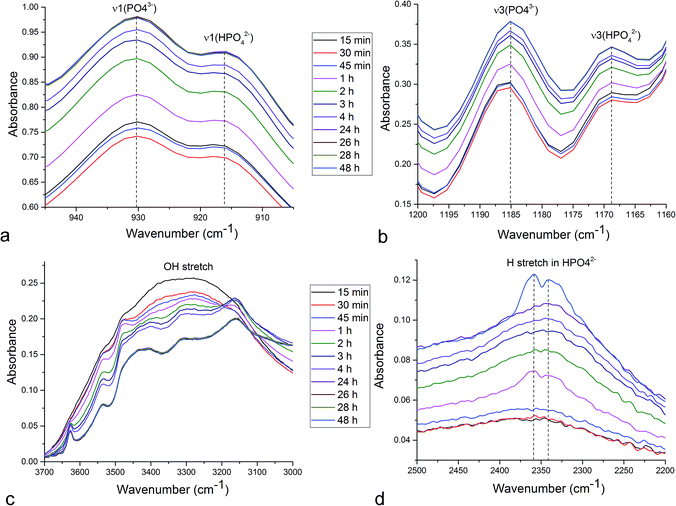
The P–O vibrations of HPO42− are characteristically downshifted compared to those of the PO43− ion due to the addition of a hydrogen atom to the P–O vibrational group. Namely, at 160.8 pm, the P–O(H) bond distance in HPO42− is considerably longer than those of the remaining three P–O groups: 150.6, 151.6, and 153.2 pm.33 Therefore, the appearance of the band at 954 cm−1, originating from ν1(P–O(H)) symmetric stretch of the HPO42−, on the account of the disappearance of the adjacent ν1(P–O) symmetric stretch of PO43− at 970 cm−1 is indicative of the TCP → DCPD transformation (Fig. 10d). The similar, although less pronounced effect can be observed in relation to 916/931 cm−1 ν1 P–O symmetric stretch (Fig. 11a) and 1168/1185 cm−1 ν3 P–O antisymmetric stretch (Fig. 11b). Typifying all these transitions is the spectral reversal in the first 45 minutes of the setting time, suggesting oscillations in this early phase of the reaction, as in agreement with the findings of the XRD analysis.
As indicated by the transition of an initially broad OH− stretch in the 2500–3500 cm−1 region into resolvable multiplets (Fig. 11c), the setting reaction is accompanied by the structuration of water molecules. Given that water is a crystalline component of the DCPD stoichiometry, this effect is expected. However, as also seen from Fig. 11c, this structuration increases at each successive timepoint and does not proceed in a reverse direction between any two timepoints, thus lacking the key signature of oscillatory behavior. The multiplet structure is fully formed by the 24th hour and shows no change with the further increase in the setting time. In contrast, the ν(H) stretch in HPO42− peaking at 2350 cm−1 – albeit being a possible OH− stretch combination band – transitions from a singlet to a doublet (Fig. 11d) in a way that resembles the oscillation in the amount of DCPD observed in the early time points of the setting reaction in the XRD analysis. Namely, the doublet is first seen at 1 h timepoint, after which it becomes noticeably less pronounced at 2 h and completely disappearing at 3 h, before reappearing again after 48 h (Fig. 11d). The relatively early timepoints at which the reaction reversibility is evidenced in FT-IR coincide with the peaking of the DCPD concentration at 0.6 h timepoint before its subsequent drop during the next hour, recovery for the next half an hour and then steadying around an equilibrium point (Fig. 5a and b). The origin of this doublet may be found in the fact that the hydrogen bonding of two water molecules of DCPD (W(1) and W(2) in CaHPO4 × 2H2O) differs in strength and geometry.34 An additional hydrogen bond in the DCPD crystal structure exists within the Ca2+–HPO42− layer and strong hydrogen bonding is expected to be responsible for the downshift of the OH− stretch to below 3300 cm−1. The absence of oscillations in this OH− stretching vibration band suggests that water molecules per se are not central to oscillations, whereas the hydrogen bonded network of HPO42− ions is.
3.3. Gelatin–HAp cement
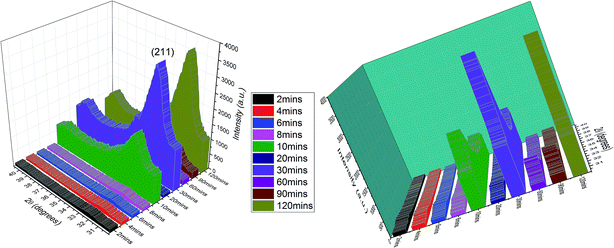
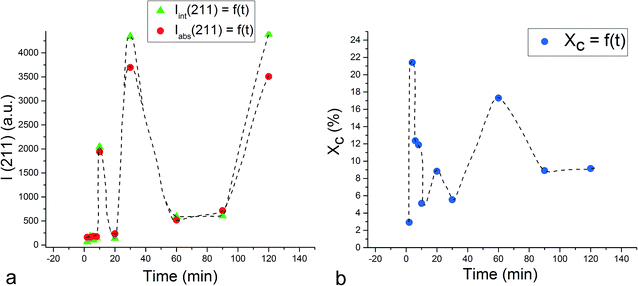
Unlike the Cu- and Zn-TCP cements, which both transform to DCPD upon setting, gelatin-containing HAp cement undergoes a transformation to an amorphous CP phase during gelation and back to poorly crystalline HAp upon hardening (Fig. 12). In this case, gelation partially dissolves and amorphizes the HAp crystals and initiates their setting back into the hardened, solid HAp form. As seen from Fig. 12, beyond the endpoint of the setting reaction, 8 hours after the onset of gelation, the phase composition of the product is identical to that of the solid reactant, comprising HAp only, except for the more prominent presence of the amorphous hump centered at 2θ = 23° in a generally noisier pattern and a lower average crystallite size estimated from the (211) peak halfwidth and the Scherrer equation (7.4 vs. 9.6 nm), suggesting the partially incomplete transition of the reactant back to its original crystalline state and the retention of some of the amorphousness of the gelled phase. The analysis of diffraction patterns measured after the initial setting time was over, i.e., after ∼10th minute of the reaction time, indicated a finite degree of oscillatory changes in crystallinity. Unlike in the case of Zn-TCP, where the oscillations lasted for over 80 h, i.e., for the entire duration of the experiment, or the case of Cu-TCP, where the oscillations wound down after ∼24 h of the reaction time, the oscillations in the gelatin–HAp system were more short-lived and came to standstill in a matter of hours. This may be caused by the lack of aforementioned disparity between the solubility products of the product and the reactants, which allows for the transformation of the product back to the reactant to occur, along with the resulting oscillations in the phase content. Still, the oscillations were intense, particularly between the 10th and the 120th minute of the reaction, as seen in Fig. 13. The same extension of the period between the adjacent peaks in intensity over time as that observed during the setting of Cu-TCP cements (Fig. 5d) was present. Fluctuations in the diffraction peak intensity (Fig. 14a) entailed those in crystallinity (Fig. 14b). No significant difference was observed between absolute and integrated (211) peak intensities (Fig. 14a), justifying the interchangeable use of the two in determining the phase composition. After transiently peaking only 2 minutes into the setting reaction and reaching 20% per eqn (3), crystallinity drops down to 5% on the 10th minute of the reaction, paradoxically coinciding with the first peak in the amount of the solid phase. Crystallinity then increases, but does not exceed 17% before setting, after 90 min, at ∼10%, which is the typical value observed for apatites synthesized by precipitation under ambient conditions.35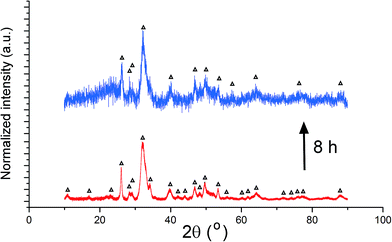 | ||
| Fig. 12 XRD patterns of hardened HAp–gelatin cement (top) and of its powder precursor (bottom). Reflections derived from HAp are marked with Δ. | ||
4. Discussion
In this study, we report on the nonlinear, oscillatory dynamics detected in the evolution of phase composition during the setting of different CP cements, two of which evolved toward DCPD and one of which evolved toward HAp as the final product. Whereas both DCPD-forming cements contained ion-doped β-TCP as the initial phase, the Zn-TCP one yielded ZCP as an additional phase during setting and the oscillations between these two products were pronounced throughout the entire 80 h setting period. The physicochemical cause of the oscillatory dynamics in each of these three distinct cases is difficult to pinpoint. In the case of the oscillations observed between DCPD and ZCP, a first-order reaction model given in eqn (7) cannot oscillate without the addition of a finite number of sub-processes feeding into this global pathway. As a result, no matching with the classical chemical oscillatory models could be found. Although the evolution of the β-TCP systems does resemble the Brusselator dynamics approaching a fixed point in a stable regime, no fit with the model was observed based on the given assumptions. Another argument in disfavor of the “chemical clock” mechanism of oscillation is that such oscillations are limited to intermediary species, whereas in this case the final phases are observed to oscillate. Notwithstanding the possibility that phases more stable per the Ostwald–Lussac rule may present the truer final phases, albeit minorly present and undetectable using XRD, gravitation of oscillations toward an equilibrium point is suggestive of a different, less exotic mechanism.Oscillations between different equilibrium states in a liquid-to-solid phase transition were previously noticed and attributed in origin to diffusive fluxes at the interface between phases.36 However, surface diffusion anisotropy can only modify the existing oscillations, but cannot cause them. To arise, oscillations require two diametrically opposite and competing processes, e.g., dissolution and crystallization. Synchronization enabled by the local variations in the chemical potential37 due to competing crystallization and dissolution reactions may be responsible for sustaining the nonlinear, oscillatory dynamics at the solid/liquid interface and can lead to pattern formation, but, again, cannot be a key thermodynamic driver behind them. Oscillations were also observed at the particle–solution interface during precipitation and dissolution reactions and were correlated with autocatalysis or reaction inhibition by the product formation.38 However, the reaching of the equilibrium state and the absence of autocatalytic behavior are hallmarks of solid-state oscillators compared to the molecular ones. In all three cases reported here, the oscillatory reaction eventually settles in an equilibrium state, suggesting the absence of a constant influx of the driving energy for the phase transitions between reactants, products and possible intermediates.39 Still, the compositional oscillations leading to this equilibrium, caused by the relatively high reverse reaction rates, were pronounced to the point of disallowing any correlations in isothermal kinetic models commonly used to study the crystallization kinetics in cements, e.g., JMAK40 or Šesták–Berggren. The only exception was the evolution of the (−242) DCPD reflection in Cu-TCP cement in the first hour of the reaction time, allowing for the extrapolation of the Avrami exponent and estimation of the DCPD crystallization rate and mechanism (edge-controlled growth). A direct correlation between (i) a gradual decrease in the oscillation intensity and (ii) a gradual drop in the concentration of both the amorphous solid phase and the liquid phase, present only in the initial stages of the reaction, suggests that the amorphous phase, both liquid and solid, must be a key intermediate and that the process is primarily entropically driven. Slowing down of the kinetics of crystallization in an Fe–Co alloy was similarly associated with a reduced presence of the amorphous matrix, which was proven to be necessary for the grain growth.41 The fact that even in the final, hardened form, the materials do not exhibit exceptional crystallinity (∼10%) suggests that the amorphous content plays a crucial role in ensuring these compositional oscillations by providing both a source from which individual phases gain their content and an end to which they lose it.
Numerous kinetic effects can be invoked as candidates for roles in limiting the diffusion and inhibiting the phase transformation reactions. One role of additives – Zn2+, Cu2+ and gelatin – may have been to decelerate the phase transformations and make them detectable under regular measurement conditions. While Zn2+ and Cu2+ exerted this effect by entering the crystal lattice of β-TCP, gelatin did so by coating the CP grains and partially blocking the growth and recrystallization via dissolution/reprecipitation mechanism. A similar blocking effect was previously observed when HAp nanoparticles were interspersed in a chitosan matrix.42 Oscillations at the scale observed in gelatin–HAp system were not observed in pure HAp cements,43 suggesting that either an organic additive in a monophasic CP product system or the complex entwinement of product formation pathways are needed to promote such oscillations. This raises expectations that CP remodeling process and interaction with cells and tissues, naturally interfaced by organic layers, is naturally oscillatory at fine spatiotemporal scales.
Zinc, for one, is a cation that decreases the solubility44 and inhibits the crystal growth45 of CPs. Both of these effects effectively slow down the phase transformations in the system and may extend the timescale of oscillations. The mechanism of structural stabilization caused by doping with Zn2+ may be related to the formation of intracrystalline O–Zn–O bridges.46 However, the role of Zn2+ as a cationic catalyst of phase transformations causative of these oscillations cannot be excluded either. Given that Cu2+ → Ca2+ appears to have the opposite effect on solubility,47 it can be concluded that ionic substitution may enhance, but not cause the oscillatory dynamics. Next, both final phases of the reaction, DCPD and ZCP, are dihydrates, unlike β-TCP, the initial reaction component, which is an effect lowering the entropic barrier that prevents the dissolution of the product and its partial transformation back to the reactant. The solubility products of these two phases are also in the similar range: −log![[thin space (1/6-em)]](https://www.rsc.org/images/entities/char_2009.gif) Ksp = 9.46 for ZCP48 and −log
Ksp = 9.46 for ZCP48 and −log![[thin space (1/6-em)]](https://www.rsc.org/images/entities/char_2009.gif) Ksp = 6.59 (ref. 49) for DCPD. In contrast, the solubility of β-TCP (−log
Ksp = 6.59 (ref. 49) for DCPD. In contrast, the solubility of β-TCP (−log![[thin space (1/6-em)]](https://www.rsc.org/images/entities/char_2009.gif) Ksp = 29.50 (ref. 50)) is lower and this uncommon property of the system (i.e., the products being more soluble than the reactant) may be another factor that favors the oscillatory behavior, which feeds on the ability of the product to transform back to the reactant in relatively copious amounts. The effect of citrates present in the setting mixture on this disparity, which potentially favors oscillatory dynamics, is difficult to assess. Namely, on one hand, based on the ionic and solubility product calculation using the Debye–Hückel limiting law, the acidification effect due to citrates is such that it would make TCP undersaturated at pH < 2.7 and DCPD the only supersaturated CP phase at pH < 2.15. On the other hand, in the viscous cement where protonation is hindered, this effect may be negligible and the citrate may predominantly act as a nucleation inhibitor that slows down the crystallization dynamics and sets off the oscillatory behavior.
Ksp = 29.50 (ref. 50)) is lower and this uncommon property of the system (i.e., the products being more soluble than the reactant) may be another factor that favors the oscillatory behavior, which feeds on the ability of the product to transform back to the reactant in relatively copious amounts. The effect of citrates present in the setting mixture on this disparity, which potentially favors oscillatory dynamics, is difficult to assess. Namely, on one hand, based on the ionic and solubility product calculation using the Debye–Hückel limiting law, the acidification effect due to citrates is such that it would make TCP undersaturated at pH < 2.7 and DCPD the only supersaturated CP phase at pH < 2.15. On the other hand, in the viscous cement where protonation is hindered, this effect may be negligible and the citrate may predominantly act as a nucleation inhibitor that slows down the crystallization dynamics and sets off the oscillatory behavior.
The interfacial energy fluctuation argument offers another teleological perspective at the origin of these dynamic instabilities. Variations in the surface tension previously paralleled the periodic movement of ionic species across the biphasic interface consisting of an amphiphilic, cetyltrimethylammonium bromide monolayer and the resulting oscillations in electrical potential51 and pH,52 but their underlying cause was still atomistic in nature. Interfacial tension has also been associated with the Marangoni instability, but again being caused by local compositional fluctuations.53 Phases with high interfacial energies tend to be more unstable and more prone to dissolution than the low energy surfaces, whose tendency is to grow. Although amorphous CP and HAp may be compositionally highly similar or even identical, the former phase will have a lower interfacial energy than HAp because of the higher degree of entropic similarity with the liquid phase, and its growth potential can be assumed to be higher than the dissolution potential when compared against HAp. These interfacial energy propensities are at odds with the thermodynamic bulk propensities, which dictate that HAp would be less soluble than amorphous CP because of the lower solubility product: −log![[thin space (1/6-em)]](https://www.rsc.org/images/entities/char_2009.gif) Ksp = 114.7 for HAp and ∼25 for amorphous CP. This argument is, however, not specific to this system and applies to every crystallization system, requiring the addition of kinetic effects thereto. It should be noted that similar oscillations involving an alternate dominance of dissolution over precipitation and the other way around were noticed during the regular immersion of CP powders in aqueous solutions. For example, during the first 100 h, Ca2+ levels in the supernatant fluctuated between 80 and 30 ppm.54 Hence, aside from these thermodynamic potential causes of oscillations, kinetic factors must be crucial in terms of enabling their temporal extension and detection.
Ksp = 114.7 for HAp and ∼25 for amorphous CP. This argument is, however, not specific to this system and applies to every crystallization system, requiring the addition of kinetic effects thereto. It should be noted that similar oscillations involving an alternate dominance of dissolution over precipitation and the other way around were noticed during the regular immersion of CP powders in aqueous solutions. For example, during the first 100 h, Ca2+ levels in the supernatant fluctuated between 80 and 30 ppm.54 Hence, aside from these thermodynamic potential causes of oscillations, kinetic factors must be crucial in terms of enabling their temporal extension and detection.
Unlike in the case of ion-doped cements, oscillations in the gelatin–HAp system occur between (i) dissolution of HAp into growth units solidifying as amorphous CP and (ii) ripening of amorphous CP into HAp. Ripening may involve the martensitic transformations of the crystal lattice in the solid state, but may also have dissolution/reprecipitation as the dominant mechanism of phase transformation. The interrelation between the three aspects of the process – dissolution, reprecipitation of the amorphous phase, and recrystallization – must be precisely tuned for the oscillations to be observed under ordinary conditions. Usually, in oscillatory processes, one of the three interrelated effects is delayed compared to the other two, which often proceed simultaneously. Even with this assumption, however, it would still not be clear which feedback effect synchronizes these oscillations and ensures than they are not averaged over the entire volume of the material. For, although ensembles of atoms forming surface islands of nuclei fluctuate in size and the chemisorption energy and reactivity oscillate as a function of size,55 the total surface area of each chemisorbed phase remains constant over time.56 Still, the same effects governing these local fluctuations can be considered as potential candidates for the causes of oscillations at more global scales. Thermal feedback effects have been causative of oscillatory behavior in Ti–Zr alloys, but during oxidation at elevated temperatures.57 At the same time, hydration of CP cements is an exothermic process, liberating heat estimated at ∼200 J g−1 and being inversely proportional to Ca/P molar ratio of the CP phase.58 In general, hydrolysis of CPs is an exothermic process and the crystallization, conversely, endothermic when solute speciation is taken into account, the reason for which boiling is often added to ambient CP precipitation protocols to send the solution over – not below as for most other salts – the saturation level and precipitate ions that will block the particle surface and increase stability. In one such scenario, the transformation of amorphous to crystalline CP would, thanks to its endothermic effect, transiently undersaturate the system and promote the dissolution of the material and/or its transformation back to the amorphous state, thus potentially causing oscillations of this kind in the system. However, even though precipitation of HAp, being an endothermic process, would consume the heat and lower the cement temperature, thus increasing its solubility and causing the destabilization of the precipitate, it is not certain whether this thermal effect is large enough at room temperature to trigger and sustain the oscillations in the phase composition and crystallinity.
The selective transfer of ions as growth units is another possible factor affecting oscillations. Namely, Ca2+ ions are more mobile than HxPO4x−3 ions, which tend to reside on surfaces longer and present the starting points for nucleation of CPs.59,60 Per the Ostwald–Lussac rule, the growth of a most stable phase proceeds through successive growth and dissolution of less stable ones in the direction spanning from the least to the most stable. At the same time, the solubility of CPs is mostly inversely related to Ca/P molar ratio, with solubility decreasing in the following order: Ca(H2PO4)2 (MCP) > CaHPO4 (DCP) > Ca3(PO4)2 (TCP) > Ca10(PO4)6(OH)2 (HAp). With Ca2+ ions dominating the first wave of growth species arriving at the growing surface, its Ca/P molar ratio is shifted to higher values, which counteracts dissolution and favors stability. However, the high interfacial energy of this layer with respect to both the bulk region of the particle and the environment is unsustainable and favors the opposite effect, namely that of dissolution and destabilization, potentially causing alternate waves in solidification of a new phase and its dissolution. This propensity of the high interfacial energy phase, in this case HAp, to dissolve is additionally intensified by its naturally nanoparticulate form initially, given that HAp has a natural tendency to solidify as nanocrystals, which only subsequently aggregate and ripen into larger units. Because of their high surface-to-volume ratios and corresponding reactivities, nanomaterials should be intrinsically predisposed to exhibit dynamic instabilities in their formation pathways.
The most plausible argument, however, may be that pertaining to the viscosity of the liquid phase surrounding the growing grains. As the viscosity of the liquid and semisolid pockets within the setting cement increases as the setting time progresses, so does the diffusion rate drop and the oscillations become less pronounced. Therefore, it can be concluded that the nonlinear behavior is viscosity-controlled and diffusion-limited, and a possible mechanism, at least in the case of Cu-TCP and gelatin–HAp cements, would be such that the decrease in viscosity associated with the crystallization of DCPD and HAp, respectively, slows down diffusion and growth and promotes homogeneous nucleation of the low-energy phase in the liquid portion of the cement. The alternate dissolution and recrystallization of this low-energy phase, in this case amorphous CP, accompanied by the initially intense and subsequently subtle waves of viscosity, may give rise to oscillations in the composition. In addition to the bulk diffusion, however, which must have a role in controlling the intensity of fluctuations, surface diffusion, being more prone to exhibition of kinetic effects, is another possible source of oscillatory behavior. Speciation of growth units near the surface, including Ca2+, HxPO4x−3, OH− and Na+ coming from the liquid phase of the cement, could also play a role. Oscillations of ionic fluxes and electrical potential in Martin's oscillator61 – involving a hypodermic syringe filled with a physiological solution, having a plunger removed and being immersed vertically in pure water – cannot be due to interfacial tension or diffusion potential, and are thought to be due to periodic changes in charge separation in the electrical double layer caused by the mobility of its diffusive outer portion.62 However, this explanation was derived for glass capillaries, a material that is relatively smooth compared to the uneven surface of CP grains and that carries a significantly higher surface charge than CP under physiological conditions: ζ < −20 mV (ref. 63 and 64) vs. −10 < ζ < 10 mV,65 respectively. Finally, profiles of the liquid order, including hydrogen bond and dipole ordering, forming in response to the electronic and geometric features of the solid surface, are typified by fluctuations at very short, pico- and femto-second timescales. Although they are finely localized and transient, it is conceivable that their superimposition can yield periodicities at more robust scales. Notwithstanding the same limitations applying to the double layer argument, the probing of one such interfacial order at the ionic and molecular scales typified by fine localization and low free energies may be the basis for a more comprehensive model of the solid/liquid interface and the route to explaining these effects from a more quantitative and more sophisticatedly empirical perspective.
Finally, a number of possible effects causing or contributing to the oscillatory dynamics have been listed, but it is possible that, in analogy with oscillatory chemical reactions, where no less than three interrelated intermediates in a feedback-looped network must be present, a sufficient number of thermodynamic drives and kinetic variables, each affecting the oscillations while being related to all the other variables, is needed to properly explain these effects. Attempts to explain oscillations at the interface were similarly based on invoking three distinct but interrelated types of flow: the flow of fluid, the flow of solutes and the flow of current.66 In all scenarios, however, for the oscillations to be detected at the timescales of minutes to hours, inhibitory effects through the use of right chemical additives and physical conditions that impair diffusion must be imposed. Phase transformations in CPs, in general, are known to be comparatively slow,67 while the setting reaction itself is a relatively slow transformation, taking place over minutes and hours. Given the comparatively slow chemical reactions being a hallmark of living systems, CP are a convenient building block for biomineralization and this may be one of the reasons why CPs coevolved with the vertebrates into a major biomineral on Earth. In addition, oscillations in the composition lasting for the entire 80–100 h of the setting reaction, well over the time at which the cement visually appears to have fully hardened and gained a sufficient mechanical integrity, agree with the idea that CPs are “living” materials, exhibiting internal changes perhaps more pronouncedly than most other solids. One could hypothesize that it was for this reason that CP was evolutionarily selected as the major mineral component of vertebrate bones and teeth. Intrinsic preference for the nonlinear dynamics may indirectly explain the coevolution of CP and the higher organisms. For, there may be no better material to endow with the attribute of “living” than the one that exhibits nonlinear, oscillatory behavior, which emerges as more dominant with every higher level of complexity of living systems. If oscillatory reactions are primitive prototypes of self-organization phenomena, thanks to which inanimate matter spontaneously transformed to living matter before the evolution even began, then, observed in a material, they might be perceived as a gateway to a new generation of biomaterials, capable of engaging in a more intimate relationship with the biological milieus.
5. Conclusion
Oscillations present more of a rule than an exception in the biological domain. This is understandable in view of the fact that oscillations are, ultimately, a form of collective dynamic behavior that marks the transition from the potentiation of an entity to the potentiation of a relationship and represents the first step in the animation of an otherwise inanimate matter. To be thermodynamically open and autopoietic, the biological system must be built around the concept of causal chains, meaning that the nonlinear, oscillatory dynamics cannot be foreign to it. The very fact that feedback loops must be present in a cell, the basic unit of biological systems, to enable its sensing functions and the ability to respond to environmental stimuli in an intelligent manner implies that cyclical causalities, including oscillatory behavior, are an integral trait of the cell and of the more complex biological wholes that it constitutes. Spatiotemporal oscillations regularly figure in intracellular processes that include the dynamics of axonemes, dynein motors, microtubules and other aspects of cytoskeletal motility; signal transduction pathways involving mechanosensitive ion channels; transmembrane potential regulation; spatial structuration of mitotic cells; gene expression; energy metabolism; and others.68 They also govern cell aggregate and organism behavior, where they range from cardiac electrical activity to ventricular pressure to optokinetic nystagmus and multiple other features of sensory perception to circadian rhythm to fertility to population dynamics and beyond.Here we report on the detection of oscillatory behavior in three different calcium phosphate cements, each involving a mechanistically distinct pathway. Specifically, during the setting of the zinc-doped whitlockite cement, this initial phase transformed into brushite and scholzite along two different reaction paths and created an 80 hour long “seesaw” effect where the two products, brushite and scholzite, oscillated in concentration in the solid phase. Oscillations in the copper-containing whitlockite cement were more simplistic in nature and involved the sinusoidal variations in the concentration of brushite, the main product of the hardening reaction, as it gradually progressed toward an equilibrium point. Finally, the hydroxyapatite-forming cement exhibited oscillations in crystallinity on the timescale of minutes within the timeframe between the onset of gelation and the endpoint of the setting reaction. It is conceivable that the same oscillatory character of phase transitions occurs as a part of apatite biomineralization and bone remodeling processes, in which case the systems presented here may be decent models for the study of the biological and perhaps medical benefits of such oscillations. The conception of bone replacement materials and tissue engineering constructs capable of engaging in the dynamics of integration with the natural tissues in compliance with this oscillatory nature may open a new avenue for the future of this type of medical devices. It may also be an impetus for the greater involvement of complexity science, systems biology and cybernetics in the design of biomaterials. Albeit parlous, one such exotic research direction will lead to biomaterials far more describable with the epithet of “living” and worthy of the prefix “bio-” than their current generation. Such a subtle animation of matter may bring about groundbreaking medical benefits.
Conflicts of interest
There are no conflicts to declare.Acknowledgements
Acknowledged for funding is the NIH grant R00-DE021416. The authors thank Vladimir Marković from the Faculty of Physical Chemistry of the University of Belgrade for comparison with the oscillatory chemical reaction models, Victoria M. Wu from the Uskokovic Lab at Chapman University for assistance with FT-IR measurements, Shreya Ghosh from the Uskokovic Lab at the University of Illinois in Chicago for the synthesis and XRD measurement of the gelatin–HAp cement, Inna Fadeeva and Vladimir Komlev from the Baikov Institute of Metallurgy and Materials Science from the Russian Academy of Sciences in Moscow for the synthesis of Cu- and Zn-TCP cements, and Valerio Graziani from the Institute of the Structure of Matter, Italian National Research Council for performing the EDXRD measurements.References
- G. Nicolis and I. Prigogine, Self-organization in nonequilibrium systems, Wiley-Interscience, New York, 1977 Search PubMed.
- J. M. Lehn, Perspectives in Chemistry – Steps towards Complex Matter, Angew. Chem., Int. Ed., 2013, 52, 2836–2850 CrossRef CAS PubMed.
- E. Nakouzi and O. Steinbock, Self-organization in precipitation reactions far from the equilibrium, Sci. Adv., 2016, 2, e1601144 Search PubMed.
- B. Kosko, Fuzzy Thinking: The New Science of Fuzzy Logic, Flamingo, London, 1993 Search PubMed.
- H. G. Othmer, On the temporal characteristics of a model for the Zhabotinskii-Belousov reaction, Math. Biosci., 1975, 24, 205–238 CrossRef.
- Y. Kuramoto and T. Yamada, Pattern formation in oscillatory chemical reactions, Progr. Theor. Phys., 1976, 56, 724–740 CrossRef CAS.
- Y. Li, H. Qian and Y. Yi, Nonlinear oscillation and multiscale dynamics in a closed chemical reaction system, J. Dynam. Differ. Equat., 2010, 22, 491–507 CrossRef.
- T. Chen, J. Han, Z. Li, F. Song, B. Zhao, X. Wang, B. Wang, J. Wan, M. Han, R. Zhang and G. Wang, Shubnikov de Haas quantum oscillation of the surface states in the metallic Bismuth Telluride sheets, Eur. Phys. J. D, 2013, 67, 1–5 CrossRef.
- V. M. Silkin, I. A. Nechaev, E. V. Chulkov and P. M. Echenique, Charge-density oscillations at (111) noble metal surfaces, Surf. Sci., 2006, 600(18), 3875–3878 CrossRef CAS.
- N. A. Zimbovskaya, Local Flattening of the Fermi Surface and Quantum Oscillations in the Magnetoacoustic Response of a Metal, Solid State Commun., 2006, 138, 559–562 CrossRef CAS.
- G. Ertl, Oscillatory kinetics and nonlinear dynamics in reactions at solid surfaces, John Wiley & Sons, Hoboken, 2009 Search PubMed.
- J. M. Salazar and M. Lallemant, Periodic behavior in heterogeneous chemical reactions, Solid State Ionics, 1992, 50, 233–240 CrossRef CAS.
- R. Imbihl, Oscillatory reactions on single crystal surfaces, Prog. Surf. Sci., 1993, 44, 185–343 CrossRef CAS.
- J. Janek, Oscillatory kinetics at solid/solid phase boundaries in ionic crystals, Solid State Ionics, 2000, 131, 129–142 CrossRef CAS.
- L. C. Chow, Next generation calcium phosphate-based biomaterials, Dent. Mater. J., 2009, 28, 1–10 CrossRef CAS.
- S. Takagi and L. C. Chow, Formation of macropores in calcium phosphate cement implants, J. Mater. Sci.: Mater. Med., 2001, 12, 135–139 CrossRef CAS PubMed.
- M. Markovic, S. Takagi and L. C. Chow, Formation of macropores in calcium phosphate cement through the use of mannitol crystals, Key Eng. Mater., 2001, 192–195, 773–776 CrossRef CAS.
- A. R. Amini, C. T. Laurencin and S. P. Nukavarapu, Bone tissue engineering: recent advances and challenges, Crit. Rev. Bioeng., 2012, 40, 363–408 Search PubMed.
- S. V. Dorozhkin, Self-Setting Calcium Orthophosphate Formulations, J. Funct. Biomater., 2013, 4(4), 209–311 CrossRef PubMed.
- S. V. Dorozhkin, Calcium Orthophosphates in Nature, Biology and Medicine, Materials, 2009, 2, 399–498 CrossRef CAS.
- R. Caminiti, C. Sadun, V. Rossi, F. Cilloco and R. Felici, Italian Patent No. 01261484, 23 June 1993.
- M. Fosca, V. S. Komlev, A. Y. Fedotov, R. Caminiti and J. V. Rau, Structural study of octacalciumphosphate bone cement conversion in vitro, ACS Appl. Mater. Interfaces, 2012, 4, 6202–6210 CAS.
- J. V. Rau, M. Fosca, V. Graziani, A. A. Egorov, V. Y. Zobkov, A. Y. Fedotov, M. Ortenzi, R. Caminiti, A. E. Baranchikov and V. S. Komlev, Silver-doped calciumphosphate bone cements with antibacterial properties, J. Funct. Biomater., 2016, 7, 10 CrossRef PubMed.
- F. H. Chung, Quantitative Interpretation of X-Ray Diffraction Patterns of Mixtures. I. Matrix-Flushing Method for Quantitative Multicomponent Analysis, J. Appl. Crystallogr., 1974, 7, 519–525 CrossRef.
- O. Borkiewicz, J. Rakovan and C. L. Cahill, Time-resolved in situ studies of apatite formation in aqueous solutions, Am. Mineral., 2010, 95, 1224–1236 CrossRef CAS.
- V. Graziani, M. Fosca, A. A. Egorov, Y. V. Zobkov, A. Y. Fedotov, A. E. Baranchikov, M. Ortenzi, R. Caminiti, V. S. Komlev and J. V. Rau, Zinc-Releasing Calcium Phosphate Cements for Bone Substitute Materials, Ceram. Int., 2016, 42, 17310–17316 CrossRef CAS.
- A. Generosi, J. V. Rau, V. S. Komlev, V. R. Albertini, A. Y. Fedotov and S. M. Barinov, Anomalous Hardening Behavior of a Calcium Phosphate Bone Cement, J. Phys. Chem. B, 2010, 114, 973–979 CrossRef CAS PubMed.
- K. V. Tian, B. Yang, Y. Yue, D. T. Bowron, J. Mayers, R. S. Donnan, C. Dobo-Nagy, J. W. Nicholson, D. C. Fang, A. Lindsay Greer, G. A. Chass and G. Neville Greaves, Atomic and vibrational origins of mechanical toughness in bioactive cement during setting, Nat. Commun., 2015, 6, 8631 CrossRef CAS PubMed.
- J. V. Rau, V. M. Wu, V. Graziani, I. V. Fadeeva, A. S. Fomin, M. Fosca and V. Uskoković, The Bone Building Blues: Self-Hardening Copper-Doped Calcium Phosphate Cement and Its in vitro Assessment against Mammalian Cells and Bacteria, Mater. Sci. Eng., C, 2017, 79(1), 270–279 CrossRef CAS PubMed.
- J. L. Giocondi, B. S. El-Dasher, G. H. Nacollas and C. A. Orme, Molecular mechanism of crystallization impacting calcium phosphate cements, Philos. Trans. R. Soc., A, 2010, 368, 1937–1961 CrossRef CAS PubMed.
- M. Kumar, J. Xie, K. Chittur and C. Riley, Transformation of modified brushite to hydroxyapatite in aqueous solution: effects of potassium substitution, Biomaterials, 1999, 20, 1389–1399 CrossRef CAS PubMed.
- L. Berzina-Cimdina and N. Borodajenko, Research of Calcium Phosphates using Fourier Transform Infrared Spectroscopy, in Infrared Spectroscopy – Materials Science, Engineering and Technology, ed. Theophile Theophanides, Rijeka: InTech, 2012 Search PubMed.
- M. Trpkovska, B. Šoptrajanov and P. Malkov, FTIR reinvestigation of the spectra of synthetic brushite and its partially deuterated analogues, J. Mol. Struct., 1999, 480–481, 661–666 CrossRef CAS.
- A. Hirsch, I. Azuri, L. Addadi, A. Weiner, K. Yang, S. Curtarolo and L. Kronik, Infrared absorption spectrum of brushite from first principles, Chem. Mater., 2014, 26, 2934–2942 CrossRef CAS.
- E. Landi, A. Tampieri, G. Celotti and S. Sprio, Densification behaviour and mechanisms of synthetic hydroxyapatites, J. Eur. Ceram. Soc., 2000, 20, 2377–2387 CrossRef CAS.
- V. B. Fedoseev and M. V. Maksimov, Solution-Crystal-Solution Oscillatory Phase Transitions in the KCl-NaCl-H2O System, JETP Lett., 2015, 101, 390–393 CrossRef CAS.
- K. W. Kolasinski, Surface Science: Foundations of Catalysis and Nanoscience, Wiley, Chichester, 3rd edn, 2012, p. 293 Search PubMed.
- I. G. Kovzun and N. V. Pertsov, Colloid Chemical Processes of Contact Self-Organization in Alkaline Silicate Composites and Their Relation to Formation of Nanosized Surface Structures, in Nanoscience: Colloidal and Interfacial Aspects, ed. V. M. Starov, Surface Science Series 147, CRC Press, Boca Raton, 2010, p. 527 Search PubMed.
- P. Ball, Forging Patterns and Making Waves from Biology to Geology: A Commentary on Turing (1952) The Chemical Basis of Morphogenesis, Philos. Trans. R. Soc., B, 2015, 370, 1–10 CrossRef PubMed.
- E. M. Gartner, J. F. Young, D. A. Damidot and I. Jawed, Hydration of Portland Cement, in Structure and Performance of Cements, ed. J. Bensted and P. Barnes, Spon Press, London, 2nd edn, 2002, pp. 87–113 Search PubMed.
- J. S. Blazquez, C. F. Conde and A. Conde, Kinetics of nanocrystallization in FeCoNbB(Cu) alloys, Appl. Phys. A, 2003, 76, 571–575 CrossRef CAS.
- V. Uskoković and T. A. Desai, In vitro Analysis of Nanoparticulate Hydroxyapatite/Chitosan Composites as Potential Drug Delivery Platforms for the Sustained Release of Antibiotics in the Treatment of Osteomyelitis, J. Pharm. Sci., 2014, 103(2), 567–579 CrossRef PubMed.
- S. Ghosh, V. M. Wu, S. Pernal and V. Uskoković, Self-Setting Calcium Phosphate Cements with Tunable Antibiotic Release Rates for Advanced Bone Graft Applications, ACS Appl. Mater. Interfaces, 2016, 8(12), 7691–7708 CAS.
- A. Ito, K. Ojima, H. Naito, N. Ichinose and T. Tateishi, Preparation, solubility, and cytocompatibility of zinc-releasing calcium phosphate ceramics, J. Biomed. Mater. Res., 2000, 50(2), 178–183 CrossRef CAS PubMed.
- Y. Tang, H. F. Chappell, M. T. Dove, R. J. Reeder and Y. J. Lee, Zinc incorporation into hydroxylapatite, Biomaterials, 2009, 30, 2864–2872 CrossRef CAS PubMed.
- S. Gomes, J. M. Nedelec and G. Renaudin, On the effect of temperature on the insertion of zinc into hydroxyapatite, Acta Biomater., 2012, 8, 1180–1189 CrossRef CAS PubMed.
- B. Sutter, L. R. Hossner and D. W. Ming, Dissolution kinetics of iron-, manganese-, and copper-containing synthetic hydroxyapatites, Soil Sci. Soc. Am. J., 2005, 69, 362–370 CrossRef CAS PubMed.
- N. Milani, G. M. Hettiarachchi, J. K. Kirby, D. G. Beak, S. P. Stacey and M. J. McLaughlin, Fate of zinc oxide nanoparticles coated onto macronutrient fertilizers in an alkaline calcareous soil, PLoS One, 2015, 10, e0126275 Search PubMed.
- S. Mandel and A. C. Tas, Brushite (CaHPO4 x 2H2O) to octacalcium phosphate (Ca8(HPO4)2(PO4)4x5H2O) transformation in DMEM solutions at 36.5 oC, Mater. Sci. Eng., C, 2010, 30, 245–254 CrossRef CAS.
- S. Dorozhkin, Calcium orthophosphates (CaPO4): occurrence and properties, Prog. Biomater., 2016, 5, 9–70 CrossRef PubMed.
- K. Yoshikawa and Y. Matsubara, Spontaneous Oscillation of Electrical Potential across Organic Liquid Membranes, Biophys. J., 1983, 17, 183–185 CAS.
- K. Yoshikawa and Y. Matsubara, Spontaneous Oscillation of pH and Electrical Potential in an Oil-Water System, J. Am. Chem. Soc., 1983, 105, 5967–5969 CrossRef CAS.
- R. P. Rastogi and R. C. Srivastava, Interface-mediated oscillatory phenomena, Adv. Colloid Interface Sci., 2001, 93, 1–75 CrossRef CAS PubMed.
- M. M. Monteiro, N. C. Campos de Rocha, A. M. Rossi and G. de Almeida Soares, Dissolution properties of calcium phosphate granules with different compositions in simulated body fluid, J. Biomed. Mater. Res., Part A, 2003, 65(2), 299–305 CrossRef PubMed.
- I. Panas and P. E. M. Siegbahn, The nature of the surface chemical bond – a comparison between the molecular and solid-state pictures, J. Chem. Phys., 1990, 92(7), 4625–4627 CrossRef CAS.
- J. C. Védrine, Revisiting active sites in heterogeneous catalysis: Their structure and their dynamic behavior, Appl. Catal., A, 2014, 474, 40–50 CrossRef.
- M. Lallemant, G. Bertrand, J. C. Cannot, J. P. Larpin, N. Roudergues and M. Assire, Chemical bistability with thermal feedback in the oxidation of titanium-43 wt.-% zirconium alloy, React. Solids, 1987, 3, 227–239 CrossRef CAS.
- C. Liu, W. Gai, S. Pan and Z. Liu, The exothermal behavior in the hydration process of calcium phosphate cement, Biomaterials, 2003, 24, 2995–3003 CrossRef CAS PubMed.
- C. A. Orme and J. L. Giocondi, The Use of Scanning Probe Microscopy to Investigate Crystal-Fluid Interfaces, in Perspectives on Inorganic, Organic, and Biological Crystal Growth: From Fundamentals to Applications, ed. M. Skowronski, J. J. DeYoreo and C. A. Wang, American Institute of Physics, Melville, 2007 Search PubMed.
- V. Uskoković, W. Li and S. Habelitz, Amelogenin as a Promoter of Nucleation and Crystal Growth of Apatite, J. Cryst. Growth, 2011, 316, 106–117 CrossRef.
- S. Martin, A hydrodynamic curiosity: the salt oscillator, Geophys. Fluid Dyn., 1970, 1, 143–160 CrossRef.
- S. Upadhyay, A. K. Das, V. Agarwala and R. C. Srivastava, Oscillations of electrical potential differences in the salt-water oscillator, Langmuir, 1992, 8, 2567–2571 CrossRef CAS.
- D. P. J. Barz, M. J. Vogel and P. H. Steen, Determination of the Zeta Potential of Porous Substrates by Droplet Deflection. I. The Influence of Ionic Strength and pH Value of an Aqueous Electrolyte in Contact with a Borosilicate Surface, Langmuir, 2009, 25, 1842–1850 CrossRef CAS PubMed.
- W. J. Lokar and W. A. Ducker, Proximal Adsorption at Glass Surfaces: Ionic Strength, pH, Chain Length Effects, Langmuir, 2004, 20, 378–388 CrossRef CAS PubMed.
- V. Uskoković, R. Odsinada, S. Djordjevic and S. Habelitz, Dynamic Light Scattering and Zeta Potential of Colloidal Mixtures of Amelogenin and Hydroxyapatite in Calcium and Phosphate Rich Ionic Milieus, Arch. Oral Biol., 2011, 56, 521–532 CrossRef PubMed.
- R. P. Rastogi and R. C. Srivastava, Oscillatory transport phenomena mediated by interfaces, Proc. Indian Natl. Sci. Acad., 2002, 68, 73–97 CAS.
- V. Uskoković, The Role of Hydroxyl Channel in Defining Selected Physicochemical Peculiarities Exhibited by Hydroxyapatite, RSC Adv., 2015, 5, 36614–36633 RSC.
- K. Kruse and F. Jülicher, Oscillations in cell biology, Curr. Opin. Cell Biol., 2005, 17, 20–26 CrossRef CAS PubMed.
| This journal is © The Royal Society of Chemistry 2017 |

