 Open Access Article
Factors influencing fast ion transport in glyme-based electrolytes for rechargeable lithium–air batteries†
Morihiro Saito *a,
Shinya Yamadaa,
Taro Ishikawaa,
Hiromi Otsukab,
Kimihiko Itob and
Yoshimi Kubo
 b
b
aDepartment of Applied Chemistry, Faculty of Engineering, Tokyo University of Agriculture & Technology, 2-24-16 Naka-cho, Koganei-shi, Tokyo 184-8588, Japan. E-mail: mosaito@cc.tuat.ac.jp; Fax: +81-42-388-7095; Tel: +81-42-388-7095
bGREEN, National Institute for Materials Science (NIMS), 1-1 Namiki, Tsukuba 305-044, Japan
First published on 18th October 2017
Abstract
To elucidate the determination factors affecting Li-ion transport in glyme-based electrolytes, six kinds of 1.0 M tetraglyme (G4) electrolytes were prepared containing a Li salt (LiSO3CF3, LiN(SO2CF3)2, or LiN(SO2F)2) or different concentrations (0.5, 2.0, or 2.7 M) of LiN(SO2CF3)2. In addition to conventional bulk parameters such as ionic conductivity (σ), viscosity (η), and density, self-diffusion coefficients of Li+, anions, and G4 were measured by pulsed-gradient spin-echo nuclear magnetic resonance method. Interaction energies (ΔE) were determined by density functional theory calculations based on the supermolecule method for Li+–anion (salt dissociation) and G4–Li+ (Li+ solvation) interactions. The ΔE values corresponded to ion diffusion radii formed by solvation and/or ion pairs. The order of dissociation energies ΔE was LiSO3CF3 > LiN(SO2CF3)2 > LiN(SO2F)2, which agreed well with the dissociation degree of these salts in the electrolytes. From the obtained knowledge, we also demonstrated that increasing the mobility and number of carrier ions are effective ways to enhance σ of glyme-based electrolytes by using 1,2-dimethoxyethane with lower η and similar dielectric constant to those of G4.
Introduction
In recent years, lithium–air batteries (LABs) with non-aqueous electrolytes have attracted much attention as large-scale energy storage devices for electric vehicles and stationary energy storage systems because of their high theoretical specific energy of 3505 Wh kg−1, which is ca. nine times larger than that of conventional lithium-ion batteries (LIBs) (387 Wh kg−1).1 The first LAB system was reported by Abraham and co-workers, and recently many researchers have devoted intense effort to improving LAB cell performance.2 Initially, organic carbonate solvents such as propylene carbonate (PC), ethylene carbonate (EC), and diethyl carbonate (DEC) were used in LABs because of their low volatility, compatibility with lithium (Li) metal and high oxidation stability over 4.5 V vs. Li/Li+. However, these organic carbonate-based electrolytes were found to be readily decomposed by the superoxide (O2−) radicals formed during the discharge process,3–6 and C3H8(OCO2Li2), Li2CO3, HCO2Li, CH3CO2Li, CO2, and H2O were generated as by-products of Li2O2 formation.7 Recently, ether-based electrolytes using 1,2 dimethoxyethane (DME or G1), diglyme (G2), triglyme (G3), or tetraglyme (G4) as a solvent have been widely investigated for non-aqueous LAB systems.8 These ethers have high oxygen solubility and relatively low electric constants, resulting in lower reactivity toward O2− radicals compared with that of carbonate-based electrolytes.9 Also, Li2O2 formation was confirmed after discharge. However, G1 and G2 are not suitable for practical use because of their high vapor pressure at room temperature. Instead, G4-based electrolytes containing Li salts such as LiSO3CF3 (LiOTf) and LiN(SO2CF3)2 (LiTFSI) are commonly used in LAB research. Recent studies have revealed that the glyme-based electrolytes are decomposed by O2− radicals, especially in the charge process, and form Li2CO3, HCO2Li, and CH3CO2Li in a similar manner to organic carbonate-based electrolytes.10,11 As a result, the round-trip efficiency of O2 for LABs is still low (ca. 60%), so glymes are not optimal electrolytes for non-aqueous LAB systems.1,12 However, glyme-based electrolytes are still one of the better candidates for LAB systems because most other electrolytes decompose under the severe operating conditions. If the overpotential for electrochemical oxidation of Li2O2 could be lowered, it may be possible to use glyme-based electrolytes. For this purpose, some mediators such as LiI and LiBr have recently been applied to glyme-based electrolytes to promote Li2O2 oxidation at the air electrode.13–16 Meanwhile, to suppress Li dendrite growth at the Li metal negative electrode (NE), a new inorganic Li salt, i.e., LiNO3, has been applied to glyme-based electrolytes to stabilize the surface by oxidation.17,18 Therefore, glyme-based electrolytes are still important materials for LAB systems.Watanabe et al.19,20 developed concentrated Li salt glyme-based electrolytes, called solvate ionic liquids, for LAB and Li–S battery systems. These electrolytes displayed interesting properties such as quite low solubility of polysulfide lithium and high electrochemical stability derived from the strong interaction between Li+ and glyme (G3, G4) solvents. Both battery systems containing the solvate ionic liquids demonstrated stable cell performance. Concerning such concentrated Li salt electrolyte systems, Qian and colleagues reported that concentrated LiN(SO2F3)2 (LiFSI) salt DME-based electrolytes exhibited a highly efficient Li dissolution/deposition reaction at a Li metal NE without Li dendrite growth.21 This also suggests a new possibility for glyme-based electrolytes. Therefore, to develop new electrolytes and the next-generation battery systems, further research on glyme-based electrolytes is also important to help realize fast ion transport.
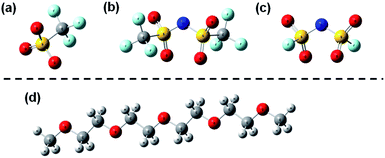
In this study, we prepared six glyme-based electrolytes with different Li salts (LiOTf, LiTFSI, and LiFSI) and a common salt LiTFSI with different concentrations for recent LABs. Fig. 1 shows the chemical structures of anions and G4 used in this study. We measured the individual self-diffusion coefficients D of the ions and G4 solvent in the glyme-based electrolytes by pulsed-gradient spin-echo nuclear magnetic resonance (PGSE-NMR) method, together with conventional physical properties, i.e., ionic conductivity σ, viscosity η and density d, of the electrolytes to clarify their Li+ transport behavior. The relationships between D and the other conventional properties are analyzed and discussed especially from the viewpoint of the mobility μ and number n of carrier ions in the electrolytes. To elucidate the relationship between the interactions between the chemical species and Li+ transport behavior in the electrolytes, we also estimated the interaction energies between Li+–anion and G4–Li+ by density functional theory (DFT) calculations based on the supermolecule method22,23 for each electrolyte system. Moreover, from the obtained knowledge, we proposed two strategies for glyme-based electrolytes to enhance ionic conductivity through increasing μ and n by using G1 as a solvent, and demonstrated the concepts to improve Li+ transport in the electrolytes for LAB systems.
Experimental
To prepare glyme-based electrolytes for LABs, LiOTf (99.0%, Kishida) and LiTFSI (99.9%, Kishida) and LiFSI (99.0%, Kishida) were used as supporting salts, dissolved in G4 (Japan Advanced Chemicals, H2O content: <30 ppm) as a solvent overnight in an Ar-filled dry box (GBJF100E805, Glovebox Japan Inc.), and aged for a few days.σ of the electrolytes was measured by a conductivity meter (S230 SevenCompact, Mettler Toledo) in the temperature range of 303 to 333 K at 10 K intervals. The electrolytes were thermally equilibrated at each temperature for at least 1 h prior to measurement.
The D values of the Li+ (7Li), anion (19F), and solvent G4 (1H) in the electrolytes were measured by PGSE-NMR using a JEOL tunable pulsed-field gradient (PFG) probe (1H resonance: 400 MHz) between 303 and 333 K.24–28 Each sample was prepared in an NMR microtube (BMS-005J, Shigemi, Tokyo) to a height less than 5 mm to prevent convection effects. The PFG was calibrated using H2O (1H resonance). Measurements were performed by setting the same PFG strength for each nuclear species with different irradiation times δ. The accuracy of D values was confirmed by obtaining the same values at different δ.
Measurements of η and ρ were carried out using a Falling ball-type viscometer (Lovis2000ME, Anton Paar). The temperature was controlled in the range of 303 to 333 K at 10 K intervals while heating the samples.
The Li+–anion and G4–Li+ interactions were quantitatively investigated by DFT calculations performed using Gaussian 09 software.29 The geometries of anions, G4, and their complexes were optimized by DFT using the B3LYP form for the exchange–correlation function and the 6-311+G** basis set. From results of the total electron energy of the ions, solvent, and complexes by the same basis set, the Li+–anion and G4–Li+ interaction energies ΔE were calculated by the supermolecule method.22,23 The basis set superposition error (BSSE)30 was corrected for all the interaction energy calculations using the counterpoise method.31
Results
Fig. 2(a) and (b) show the temperature dependences of σ for 1.0 M G4-based electrolytes with three kinds of Li salts with different anions (OTf−, TFSI−, and FSI−) and the common Li salt LiTFSI at different concentrations (0.5, 1.0, 2.0, and 2.7 M), respectively. All plots veered slightly towards higher values, but approximately followed Arrhenius-type behavior. For the different anions, σ decreased with the order of LiFSI ≥ LiTFSI ≫ LiOTf across the entire temperature range from 303 to 333 K. σ of the LiOTf-based electrolyte was almost one order of magnitude lower than those of the other Li salt-based ones. On the other hand, focusing on the Li salt concentration, σ changed with the order of 1.0 M > 2.0 M > 2.7 M > 0.5 M at 60 °C, and σ of the higher concentration electrolytes (2.0 and 2.7 M) decreased relatively rapidly as the temperature lowered. These differences will be discussed later.σ was defined by eqn (1),
 | (1) |
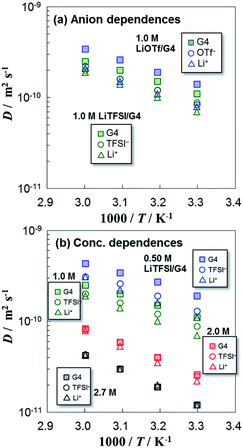
From the slopes of the plots of the temperature dependences of D, the activation energies Ea were estimated for the electrolyte systems, as shown in Table 1. For all electrolytes, Ea values were from 0.23 to 0.37 eV. Ea of the glyme electrolytes were relatively high compared with those of LIB electrolytes but on a similar scale, as same as those for a G3-based electrolyte.33 This means that all chemical species transport in a similar manner in these electrolytes.
| Electrolyte solution | DG4 Ea/eV | DLi+ Ea/eV | Danion Ea/eV | tLi+ |
|---|---|---|---|---|
| 1.0 M LiOTf/G4 | 0.23 | 0.26 | 0.30 | 0.49 |
| 1.0 M LiTFSI/G4 | 0.24 | 0.24 | 0.29 | 0.44 |
| 1.0 M LiFSI/G4 | 0.24 | 0.29 | 0.27 | 0.43 |
| 0.50 M LiTFSI/G4 | 0.23 | 0.26 | 0.30 | 0.46 |
| 2.0 M LiTFSI/G4 | 0.34 | 0.34 | 0.37 | 0.47 |
| 2.7 M LiTFSI/G4 | 0.37 | 0.37 | 0.37 | 0.50 |
From the D values of Li+ and anions, the apparent transference numbers of Li+ tLi+ were calculated using eqn (2):
| tLi+ = DLi+/(DLi+ + Danion). | (2) |
The results at 303 K are shown in Table 1 (tLi+ at each temperature are summarized in S1†). All tLi+ values were between 0.41 and 0.51, which are relatively high compared with those reported for organic carbonate electrolytes used in LIBs.24
In general, σ and D values are strongly related to the viscosity of the electrolyte. D of electrolyte solutions is known to increase with decreasing viscosity. Fig. 4(a) and (b) display the temperature dependences of inverse viscosity η−1 for 1.0 M G4-based electrolyte solutions containing different Li salts and different concentrations of LiTFSI salt, respectively. The η−1 values for all electrolytes followed the trends of temperature dependences: LiOTf > LiFSI > LiTFSI and 0.50 M > 1.0 M > 2.0 M > 2.7 M. Because we used G4 as a solvent in all the samples, η−1 was mainly affected by the dissolved salt. The η−1 values showed good correspondence with those of D.
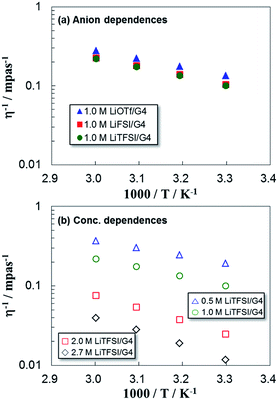 | ||
| Fig. 4 Temperature dependences of inverse viscosity η−1 for 1.0 M G4-based electrolytes containing (a) three kinds of Li salts with different anions and (b) LiTFSI salt at different concentrations. | ||
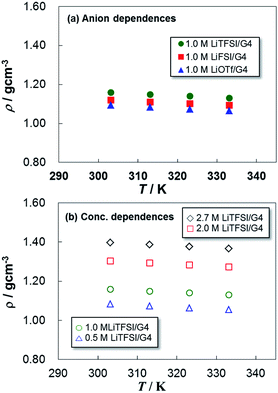
Fig. 5 shows ρ of the electrolytes as a function of temperature. The ρ values decreased linearly with rising temperature: LiTFSI > LiFSI > LiOTf and 2.7 M > 2.0 M > 1.0 M > 0.5 M. This is also in good agreement with the trend of η, implying that an electrolyte with smaller ρ exhibits lower η and higher D. These parameters are usually reflected by the mutual interactions between ions and solvent in the electrolytes. In the following section, we analyze the ion transport mechanism from the viewpoints of both μ and n in the glyme electrolytes, including the mutual interactions between the ions and G4 solvent.
Discussion
To observe the effect of μ of the carrier ions on σ, the σ values are plotted against the sum of (DLi+ + Danion) in Fig. 6(a) and (b) for different Li salts and different concentrations of LiTFSI, respectively. The σ values increased with (DLi+ + Danion) for all the electrolytes. Except for the LiOTf electrolyte, the Li+ and anion diffusion constants clearly influenced σ. The σ values depended on the counteranions with the order FSI− > TFSI− ≫ OTf−. For the LiOTf electrolyte, σ values were small compared with those of the other Li salts and the change was quite small even when the temperature increased. This indicates that the degree of dissociation was low and decreased with rising temperature. Regarding the dependence on Li salt concentration, (DLi+ + Danion) drastically decreased with increasing concentration. However, σ did not decrease; instead, it was almost constant over a similar range. This suggests that the dissociation degree α was basically enhanced by increasing the Li salt concentration, as reported by Watanabe's group.19,20,32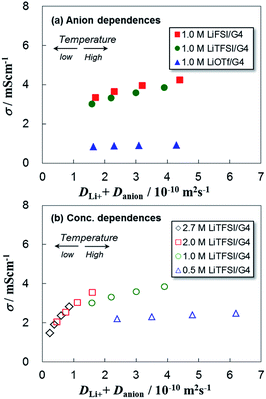 | ||
| Fig. 6 Plots of ionic conductivity σ against the sum of (Dcation + Danion) for (a) three kinds of Li salts with different anions and (b) LiTFSI salt at different concentrations. | ||
As mentioned above, ion transport in glyme electrolytes occurs via a vehicle mechanism. The relationship between D and η can therefore be defined by the Stokes–Einstein equation24,28 as follows:
| D = kT/cπηrion, | (3) |
In eqn (3), c and η are assumed to be the same for the ions and G4, so rion/rG4 is simply defined as eqn (4):26
| rion/rG4 = DG4/Dion. | (4) |
The rion/rG4 value represents the effective radius of the diffusing ion in the electrolyte because the PGSE-NMR method gives average values of D of the ions and G4. Table 2 shows the ion radius relative to that of G4 (rion/rG4) for the six electrolytes. All the rion/rG4 values were larger than those determined from the van der Waals radii of the ions. This implies that either Li+ strongly interacts with G4 to form a solvated Li+(G4)x species or counteranions contribute to the formation of ion pairs. As a result, Li+ diffuses more slowly than the anions in the electrolytes. In addition, the rLi/rG4 and ranion/rG4 values for the LiOTf electrolyte were relatively larger than those of the electrolytes with other salts. This indicates that Li+ forms a larger amount of ion pairs and larger solvated ion structures in the presence of both G4 and OTf−. Also, the rion/rG4 values decreased with increasing Li salt concentration. This indicates that the dissociation degree increased with rising concentration. In the glyme electrolytes, the mutual interactions between ions and solvent are relatively strong and influence the ion transport behavior by changing the solvation structures. As shown by eqn (1), σ of solution electrolytes is also influenced by n. In the following section, we conducted analyses using Walden plots and the Nernst–Einstein equation to elucidate the effect of n on σ.28
| Species | LiOTf (1.0 M) | LiTFSI (1.0 M) | LiFSI (1.0 M) | LiTFSI (0.50 M) | LiTFSI (2.0 M) | LiTFSI (2.7 M) |
|---|---|---|---|---|---|---|
| Anion | 1.7 | 1.3 | 1.2 | 1.5 | 1.0 | 1.0 |
| Li+ | 1.8 | 1.6 | 1.6 | 1.7 | 1.2 | 1.0 |
Fig. 8(a) and (b) illustrate the Walden plots for electrolytes with different Li salts and LiTFSI at different concentrations, respectively. Here, σ was converted to molar conductivity Λimp using the ρ values in Fig. 5. The Walden plots deviated downward from the ideal line. For the Li salts, the deviation became much larger with the order of LiOTf ≫ LiTFSI ≥ LiFSI. All the Li salts exhibited larger deviation with increasing temperature, indicating a decrease in the degree of dissociation of the salts. As for the concentration dependence of LiTFSI, a higher Li salt concentration gave a smaller deviation than those of lower ones. This means that the glyme-based electrolytes form more stable Li+ solvation structures at high concentration, such as a 1![[thin space (1/6-em)]](https://www.rsc.org/images/entities/char_2009.gif) :
:![[thin space (1/6-em)]](https://www.rsc.org/images/entities/char_2009.gif) 1 ratio of glyme to Li+ (corresponding to 2.7 M).19,20,32 Therefore, the contribution of n to σ increases with rising concentration especially at lower temperatures. In contrast, lower Li salt concentration and higher temperature are considered to increase the contribution of μ to σ.
1 ratio of glyme to Li+ (corresponding to 2.7 M).19,20,32 Therefore, the contribution of n to σ increases with rising concentration especially at lower temperatures. In contrast, lower Li salt concentration and higher temperature are considered to increase the contribution of μ to σ.
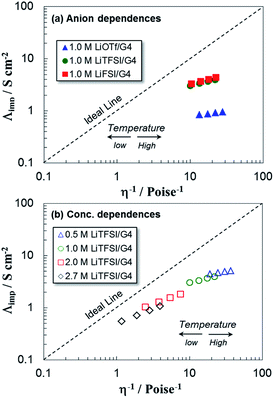 | ||
| Fig. 8 Walden plots for G4-based electrolytes with (a) three kinds of Li salts with different anions and (b) LiTFSI salt at different concentrations. | ||
Molar ionic conductivity ΛNMR can be calculated from the self-diffusion coefficients (D+, D−) by the Nernst–Einstein equation as follows:
| ΛNMR = Ne2(D+ + D−)/kT, | (5) |
| αapp = Λimp/ΛNMR. | (6) |
Fig. 9 shows the temperature dependences of the αapp values for the lithium salts. At 303 K, αapp is the largest for LiFSI, with the order LiFSI ≥ LiTFSI ≫ LiOTf. Generally, αapp values are insensitive to temperature for solution electrolytes. However, the glyme-based electrolytes exhibited a gradual decrease in αapp with increasing temperature. This is in good agreement with the results of the Walden plots and is attributed to the increase of ligand exchange rate caused by raising the temperature. In fact, the higher concentration of LiTFSI electrolyte exhibited higher αapp over the whole temperature range than αapp of the lower concentration of LiTFSI.
 | ||
| Fig. 9 Plots of the degree of dissociation αapp for glyme-based electrolytes with (a) three kinds of Li salts with different anions and (b) LiTFSI at different concentrations. | ||
The Walden plots and αapp values indicate that ion dissociation is higher for LiFSI and LiTFSI salts than for LiOTf. The magnitude of deviation in the Walden plots agrees well with the order of ion dissociation αapp: LiFSI ≥ LiTFSI ≫ LiOTf. This trend is similar to those estimated from Λimp and the limiting molar conductivity Λ0 for the solvate ionic liquids of [Li(G3)]X and [Li(G4)]X (X: anions) reported by Watanabe and co-workers.32 The changes in Li salt concentration and temperature revealed the interaction strength of G4 with Li+, which is not strong compared with those of organic carbonate solvents such as PC and EC. However, an increase in n enhanced the interaction in the [Li+(G4)]X complexes. By increasing n, this order also agreed well with that of σ. Namely, σ of the glyme electrolytes is more closely related to n than μ.
The μ and n of the carrier ions are strongly related to the physical parameters η, ρ, and D, so it is necessary to understand the mutual interactions between Li+–anion and G4–Li+. Here, we calculated these two interaction energies ΔE using a DFT calculation based on supermolecule method.22,23 When an interaction occurs, for example, between M1 and M2, the intermolecular interaction energy, ΔE, is calculated as the difference between the total energy of the dimer [E(M1 − M2)] and the sum of the total energies of monomers [E(M1) and E(M2)] as shown in eqn (7):
| ΔE = E(M1 − M2) − [E(M1) + E(M2)]. | (7) |
The optimized geometries calculated for the Li+–anion and G4–Li+ complexes are shown in Fig. 1 in ESI.† The total energies, E(M1), E(M2), and E(M1 − M2), and the calculated ΔE values between Li+–anion and G4–Li+ are summarized in Table 3. The order of magnitude of ΔE is LiOTf > LiTFSI > LiFSI even if the geometry of TFSI− and FSI− anions is changed between cis and trans structures, which means that FSI− is the mostly likely to dissociate from Li+ among the supporting salts.
| Interaction | E(Li+)/au | E(anion, G4)/au | E(Li+–anion, G4–Li+)/au | ΔE/eV |
|---|---|---|---|---|
| a The basis set superposition error (BSSE) for ΔE is corrected by the counterpoise method. | ||||
| Li+–OTf− | −7.28491780 | −961.730421 | −969.241731 | −6.10 |
| Li+–TFSI− (cis) | −7.28491780 | −1827.61042 | −1835.11844 | −5.97 |
| Li+–TFSI− (trans) | −7.28491780 | −1827.61042 | −1835.12077 | −6.04 |
| Li+–FSI− (cis) | −7.28491780 | −1351.90295 | −1359.40749 | −5.88 |
| Li+–FSI− (trans) | −7.28491780 | −1351.90295 | −1359.40583 | −5.83 |
| G4–Li+ | −7.28491780 | −770.586715 | −778.038815 | −4.39 |
Considering the solvation energy of Li+ by G4, ΔE for the G4–Li+ interaction is also summarized in Table 3. In general, ΔE of G4–Li+ is relatively large (−4.39 eV), which stabilizes the solvation structure. The ΔE value (solvation energy) is at a similar level to those of Li+−anion interactions, but it is not high enough for full dissociation of the salts, even if considering the G4–anion interaction. Therefore, the Li salts were not fully dissociated in the glyme electrolytes. However, the FSI− and TFSI− anions exhibited a tendency for higher dissociation, which led to enhanced σ: this is in good agreement with the results of Walden plots and αapp of the electrolytes. Consequently, the LiFSI electrolyte exhibited the highest σ of those investigated. We therefore have to find Li salts with smaller dissociation energies to improve salt dissociation, which will increase n of the glyme electrolytes. The ionic radii of the solvated Li+ and anions are also important for glyme electrolytes because they affect μ in a similar manner to that in conventional Li salt electrolytes, such as 1.0 M LiPF6/EC + DEC for LIBs.27 Therefore, FSI− also has an advantage from the viewpoint of diffusion radius because of its smaller ion size and higher dissociation degree than those of the other anions.
The above results indicate that σ of glyme-based electrolytes depends on both μ and n. In particular, improvement of the dissociation degree of Li salts is quite important because of the lower solvation energy of glyme than those of other carbonate-type solvents for LIBs. In addition, the dissociation degree increases with Li salt concentration. Next, we tried to design new electrolyte systems using DME (G1) as the solvent. G1 has similar a dielectric constant (7.2) and lower η (0.455 mPas) compared with those of G4 (7.9 and 4.05 mPas, respectively). Therefore, keeping a similar dissociation degree and lowering η for the glyme electrolyte are expected. Here, 1.0 M LiFSI/G4 + G1 (9![[thin space (1/6-em)]](https://www.rsc.org/images/entities/char_2009.gif) :
:![[thin space (1/6-em)]](https://www.rsc.org/images/entities/char_2009.gif) 1 or 7
1 or 7![[thin space (1/6-em)]](https://www.rsc.org/images/entities/char_2009.gif) :
:![[thin space (1/6-em)]](https://www.rsc.org/images/entities/char_2009.gif) 3 molar ratio) and concentrated (conc.) LiFSI/G1 (3.5 or 5.0 M) systems were examined. Fig. 10(a) and (b) show the temperature dependences of σ and η for 1.0 M LiFSI/G4 + G1, respectively. The σ values increased with the content of G1 in the electrolytes. This is attributed to the decrease of η. To consider μ and n, D and αapp values are plotted against temperature in Fig. 11. The D values of ions drastically increased with rising G1 content in the electrolyte, while αapp decreased slightly with increasing G1 content. As a result, σ increased to 6.5 mS cm−1, which is ca. twice that of the pristine electrolyte (3.3 mS cm−1); i.e., 1.0 M LiFSI/G4. The activation energies of ions estimated from D values also decreased and relatively high tLi+ were maintained (Table 4), indicating increases of μ. Therefore, lowering η using the G1 solvent with a similar dielectric constant and lower η to those of G4 is one way to effectively improve σ of glyme electrolyte systems.
3 molar ratio) and concentrated (conc.) LiFSI/G1 (3.5 or 5.0 M) systems were examined. Fig. 10(a) and (b) show the temperature dependences of σ and η for 1.0 M LiFSI/G4 + G1, respectively. The σ values increased with the content of G1 in the electrolytes. This is attributed to the decrease of η. To consider μ and n, D and αapp values are plotted against temperature in Fig. 11. The D values of ions drastically increased with rising G1 content in the electrolyte, while αapp decreased slightly with increasing G1 content. As a result, σ increased to 6.5 mS cm−1, which is ca. twice that of the pristine electrolyte (3.3 mS cm−1); i.e., 1.0 M LiFSI/G4. The activation energies of ions estimated from D values also decreased and relatively high tLi+ were maintained (Table 4), indicating increases of μ. Therefore, lowering η using the G1 solvent with a similar dielectric constant and lower η to those of G4 is one way to effectively improve σ of glyme electrolyte systems.
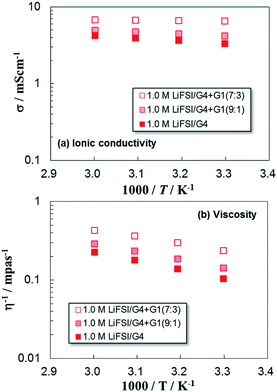 | ||
Fig. 10 Plots of (a) ionic conductivity σ and (b) viscosity η for 1.0 M LiFSI/G4 + G1 (9![[thin space (1/6-em)]](https://www.rsc.org/images/entities/char_2009.gif) : :![[thin space (1/6-em)]](https://www.rsc.org/images/entities/char_2009.gif) 1, 7 1, 7![[thin space (1/6-em)]](https://www.rsc.org/images/entities/char_2009.gif) : :![[thin space (1/6-em)]](https://www.rsc.org/images/entities/char_2009.gif) 3) together with those of 1.0 M LiFSI/G4. 3) together with those of 1.0 M LiFSI/G4. | ||
 | ||
Fig. 11 Plots of self-diffusion coefficients D and dissociation degree αapp for 1.0 M LiFSI/G4 + G1 (9![[thin space (1/6-em)]](https://www.rsc.org/images/entities/char_2009.gif) : :![[thin space (1/6-em)]](https://www.rsc.org/images/entities/char_2009.gif) 1, 7 1, 7![[thin space (1/6-em)]](https://www.rsc.org/images/entities/char_2009.gif) : :![[thin space (1/6-em)]](https://www.rsc.org/images/entities/char_2009.gif) 3) together with those of 1.0 M LiFSI/G4. 3) together with those of 1.0 M LiFSI/G4. | ||
| Electrolyte solution | DG1 Ea/eV | DLi+ Ea/eV | Danion Ea/eV | tLi+ |
|---|---|---|---|---|
1.0 M LiFSI/G4 + G1 (9![[thin space (1/6-em)]](https://www.rsc.org/images/entities/char_2009.gif) : :![[thin space (1/6-em)]](https://www.rsc.org/images/entities/char_2009.gif) 1) 1) |
— | 0.26 | 0.27 | 0.43 |
1.0 M LiFSI/G4 + G1 (7![[thin space (1/6-em)]](https://www.rsc.org/images/entities/char_2009.gif) : :![[thin space (1/6-em)]](https://www.rsc.org/images/entities/char_2009.gif) 3) 3) |
— | 0.23 | 0.22 | 0.43 |
Fig. 12 depicts σ and η for the conc. LiFSI/G1 (3.5 or 5.0 M) system. Both conc. G1-based electrolytes exhibited higher σ values than that of 1.0 M LiFSI/G4 electrolyte despite the lower η−1 values. This suggests that n increases with Li salt concentration. In particular, σ of 3.5 M LiFSI/G1 was 3.3 mS cm−1, which is twice that of 1.0 M LiFSI/G4, as well as 1.0 M LiFSI/G4 + G1 (7![[thin space (1/6-em)]](https://www.rsc.org/images/entities/char_2009.gif) :
:![[thin space (1/6-em)]](https://www.rsc.org/images/entities/char_2009.gif) 3) mentioned above. Considering the μ and n values, both 3.5 and 5.0 M LiFSI/G1 electrolytes exhibited lower D values because of their higher η compared with those of 1.0 M LiFSI/G4 (Fig. 13), but similar or higher αapp values were obtained for the conc. G1-based electrolytes, indicating the enhancement of n. Therefore, σ of conc. glyme electrolytes was strongly controlled by n. Because of the intrinsic low η of G1, the η−1 and D values were relatively high compared with those of the G4-based electrolytes. This concept is connected to the recent conc. Li salt electrolytes with low viscosity.35 The transference number of Li+, tLi+, also became high upon increasing Li salt concentration and the rLi+/rG1 value was close to 1.0 (Table 5). This implies that LiFSI dissociates well in the conc. electrolytes and each Li+ is solvated by one or two G1 molecules. In fact, the Li salt concentrations of 3.5 and 5.0 M correspond to the molar ratios of Li+ to G1 of 1
3) mentioned above. Considering the μ and n values, both 3.5 and 5.0 M LiFSI/G1 electrolytes exhibited lower D values because of their higher η compared with those of 1.0 M LiFSI/G4 (Fig. 13), but similar or higher αapp values were obtained for the conc. G1-based electrolytes, indicating the enhancement of n. Therefore, σ of conc. glyme electrolytes was strongly controlled by n. Because of the intrinsic low η of G1, the η−1 and D values were relatively high compared with those of the G4-based electrolytes. This concept is connected to the recent conc. Li salt electrolytes with low viscosity.35 The transference number of Li+, tLi+, also became high upon increasing Li salt concentration and the rLi+/rG1 value was close to 1.0 (Table 5). This implies that LiFSI dissociates well in the conc. electrolytes and each Li+ is solvated by one or two G1 molecules. In fact, the Li salt concentrations of 3.5 and 5.0 M correspond to the molar ratios of Li+ to G1 of 1![[thin space (1/6-em)]](https://www.rsc.org/images/entities/char_2009.gif) :
:![[thin space (1/6-em)]](https://www.rsc.org/images/entities/char_2009.gif) 2 and 1
2 and 1![[thin space (1/6-em)]](https://www.rsc.org/images/entities/char_2009.gif) :
:![[thin space (1/6-em)]](https://www.rsc.org/images/entities/char_2009.gif) 1, respectively. Further investigation is needed to elucidate the properties of conc. electrolytes including the other solvents.
1, respectively. Further investigation is needed to elucidate the properties of conc. electrolytes including the other solvents.
 | ||
| Fig. 12 Plots of (a) ionic conductivity σ and (b) viscosity η for concentrated LiFSI/G1 (3.5, 5.0 M) together with those of 1.0 M LiFSI/G4. | ||
 | ||
| Fig. 13 Plots of self-diffusion coefficients D and dissociation degree αapp for conc. LiFSI/G1 (3.5, 5.0 M) together with 1.0 M LiFSI/G4. | ||
| Electrolyte solution | DG1 Ea/eV | DLi+ Ea/eV | DFSI− Ea/eV | tLi+ | rLi+/rG1 |
|---|---|---|---|---|---|
| 3.5 M LiFSI/G1 | 0.31 | 0.31 | 0.30 | 0.44 | 1.2 |
| 5.0 M LiFSI/G1 | 0.36 | 0.35 | 0.35 | 0.50 | 1.1 |
Conclusions
In this study, we discussed ion transport in glyme-based electrolytes obtained using three Li salts (LiOTf, LiTFSI, and LiFSI) and two glyme solvents (G4, G1). The μ values were clearly dominated by the kind of Li salt. Namely, the Lewis basicity and hardness of anions influenced the interaction strength between Li+ and anions (Li salt dissociation), Li+ and glymes (Li+ solvation), and determined η of electrolytes related to D. ΔE were estimated by DFT calculations based on the supermolecule method and provided useful information to design new electrolyte systems. As a result, one of the most effective determination factors for high σ was n for the glyme-based electrolytes with low dielectric constant. Using a smaller ether solvent with similar dielectric constant such as G1 was demonstrated to be quite effective to enhance σ while keeping η relatively low. From the obtained knowledge, we demonstrated two methods, i.e., improvement of μ and n by using 1.0 M LiFSI/G4 + G1 (9![[thin space (1/6-em)]](https://www.rsc.org/images/entities/char_2009.gif) :
:![[thin space (1/6-em)]](https://www.rsc.org/images/entities/char_2009.gif) 1 and 7
1 and 7![[thin space (1/6-em)]](https://www.rsc.org/images/entities/char_2009.gif) :
:![[thin space (1/6-em)]](https://www.rsc.org/images/entities/char_2009.gif) 3 molar ratio) and conc. LiFSI/G1 (3.5 and 5.0 M) electrolyte systems. As expected, both electrolytes successfully exhibited improved σ values (3.3 S cm−2) that were twice that of 1.0 M LiFSI/G4. In addition, the conc. Li salt electrolytes are expected to widen the electrochemical window; i.e., improve electrochemical stability.19–21,32 This is also attractive as an electrolyte property for use in next-generation batteries such as LABs that need a relatively high potential (over 4.2 V) at the air electrode for the charge process. However, conc. glyme electrolytes are expensive because of their high content of Li salts. To realize industrial production, we need to further investigate the use of other solvents with low η and wide electrochemical windows, which effectively enhance σ of glyme-based electrolytes by raising μ and n. Such research is in progress.
3 molar ratio) and conc. LiFSI/G1 (3.5 and 5.0 M) electrolyte systems. As expected, both electrolytes successfully exhibited improved σ values (3.3 S cm−2) that were twice that of 1.0 M LiFSI/G4. In addition, the conc. Li salt electrolytes are expected to widen the electrochemical window; i.e., improve electrochemical stability.19–21,32 This is also attractive as an electrolyte property for use in next-generation batteries such as LABs that need a relatively high potential (over 4.2 V) at the air electrode for the charge process. However, conc. glyme electrolytes are expensive because of their high content of Li salts. To realize industrial production, we need to further investigate the use of other solvents with low η and wide electrochemical windows, which effectively enhance σ of glyme-based electrolytes by raising μ and n. Such research is in progress.
Conflicts of interest
There are no conflicts to declare.Acknowledgements
This work was partly supported by each of JST Project for the ALCA-SPRING and MEXT Programs for the Development of Environmental Technology using Nanotechnology and the scientific technology human resource development grant, Japan. We thank Dr K. Hayamizu from the University of Tsukuba for fruitful advice.References
- P. G. Bruce, S. A. Freunberger, L. J. Hardwick and J. M. Tarascon, Nat. Mater., 2011, 11, 19 CrossRef PubMed.
- K. M. Abraham and Z. A. Jiang, J. Electrochem. Soc., 1996, 143, 1 CrossRef CAS.
- F. Mizuno, S. Nakanishi, Y. Kotani, S. Yokoishi and H. Iba, Electrochemistry, 2010, 78, 403 CrossRef CAS.
- B. D. McCloskey, D. S. Bethune, R. M. Shelby, G. Girishkumar and A. C. Luntz, J. Phys. Chem. Lett., 2011, 2, 1161 CrossRef CAS PubMed.
- W. Xu, K. Xu, V. V. Viswanathan, S. A. Towne, J. S. Hardy, J. Xiao, Z. Nie, D. Hu, D. Wang and J.-G. Zhang, J. Power Sources, 2011, 196, 9631 CrossRef CAS.
- V. S. Bryantsev, V. Giordani, W. Walker, M. Blanco, S. Zecevic, K. Sasaki, J. Uddin, D. Addison and G. V. Chase, J. Phys. Chem. A, 2011, 115, 12399 CrossRef CAS PubMed.
- S. A. Freunberger, J. Am. Chem. Soc., 2011, 133, 8040 CrossRef CAS PubMed.
- D. Aurbach, M. Daroux, P. Faguy and E. Yeager, J. Electroanal. Chem., 1991, 297, 225 CrossRef CAS.
- I. Gunasekara, S. Mukerjee, E. J. Plichta, M. A. Hendrickson and K. M. Abraham, J. Electrochem. Soc., 2015, 162(6), A1055 CrossRef CAS.
- S. A. Freunberger, Angew. Chem., Int. Ed., 2011, 50, 8609 CrossRef CAS PubMed.
- B. D. McCloskey, D. S. Bethune, R. M. Shelby, G. Grishkumar and A. C. S. Luntz, J. Phys. Chem. Lett., 2011, 2, 1161 CrossRef CAS PubMed.
- W. Xu, J. Xiao, D. Wang, J. Zhang and J.-G. Zhang, Electrochem. Solid-State Lett., 2010, 13, A48 CrossRef CAS.
- Y. Chen, S. A. Freunberger, Z. Peng, O. Fontaine and P. G. Bruce, Nat. Chem., 2013, 5, 489 CrossRef CAS PubMed.
- H.-D. Lim, H. Song, J. Kim, H. Gwon, Y. Bae, K.-Y. Park, J. Hong, H. Kim, T. Kim, Y. H. Kim, X. Lepró, R. Ovalle-Robles, R. H. Baughman and K. Kang, Angew. Chem., Int. Ed., 2014, 53, 3926 CrossRef CAS PubMed.
- W.-J. Kwak, D. Hirshberg, D. Sharon, H.-J. Shin, M. Afri, J.-B. Park, A. Garsuch, F. F. Chesneau, A. A. Frimer, D. Aurbach and Y.-K. Sun, J. Mater. Chem. A, 2015, 3, 8855 CAS.
- C. M. Burke, R. Black, I. R. Kochetkov, V. Giordani, D. Addison, L. F. Nazar and B. D. McCloskey, ACS Energy Lett., 2016, 1(4), 747 CrossRef CAS.
- J. Uddin, V. S. Bryantsev, V. Giordani, W. Walker, G. V. Chase and D. Addison, J. Phys. Chem. Lett., 2013, 4, 3760 CrossRef CAS.
- L. Carbone, M. Gobet, J. Peng, M. Devany, B. Scrosati, S. Greenbaum and J. Hassoun, J. Power Sources, 2015, 299, 460 CrossRef CAS.
- H. Moon, T. Mandai, R. Tatara, K. Ueno, A. Yamazaki, K. Yoshida, S. Seki, K. Dokko and M. Watanabe, J. Phys. Chem. C, 2015, 119(8), 3957 CAS.
- H.-M. Kwon, M. L. Thomas, R. Tatara, Y. Oda, Y. Kobayashi, A. Nakanishi, K. Ueno, K. Dokko and M. Watanabe, ACS Appl. Mater. Interfaces, 2017, 9(7), 6014 CAS.
- J. Qain, W. A. Henderson, W. Xu, P. Bhattacharya, M. Engelhard, O. Borodin and J. G. Zhang, Nat. Commun., 2015, 6, 6362 CrossRef PubMed.
- C. Møller and M. S. Plesset, Phys. Rev., 1934, 46, 618 CrossRef.
- M. Head-Gordon, J. A. Pople and M. J. Frisch, Chem. Phys. Lett., 1988, 153, 503 CrossRef CAS.
- K. Hayamizu, Y. Aihara, S. Arai and C. G. Martinez, J. Phys. Chem. B, 1999, 103, 519 CrossRef CAS PubMed.
- Y. Aihara, K. Sugimoto, W. S. Price and K. Hayamizu, J. Chem. Phys., 2000, 113, 1981 CrossRef CAS.
- K. Hayamizu, E. Akiba, T. Banno and Y. Aihara, J. Chem. Phys., 2002, 117, 5929 CrossRef CAS.
- K. Hayamizu, J. Chem. Eng. Data, 2012, 57, 2012 CrossRef CAS.
- M. Saito, S. Kawaharasaki, K. Ito, S. Yamada, K. Hayamizu and S. Seki, RSC Adv., 2017, 7, 14528 RSC.
- M. J. Frisch, G. W. Trucks, H. B. Schlegel, G. E. Scuseria, M. A. Robb, J. R. Cheeseman, G. Scalmani, V. Barone, B. Mennucci, G. A. Petersson, H. Nakatsuji, M. Caricato, X. Li, H. P. Hratchian, A. F. Izmaylov, J. Bloino, G. Zheng, J. L. Sonnenberg, M. Hada, M. Ehara, K. Toyota, R. Fukuda, J. Hasegawa, M. Ishida, T. Nakajima, Y. Honda, O. Kitao, H. Nakai, T. Vreven, J. A. Montgomery Jr, J. E. Peralta, F. Ogliaro, M. Bearpark, J. J. Heyd, E. Brothers, K. N. Kudin, V. N. Staroverov, R. Kobayashi, J. Normand, K. Raghavachari, A. Rendell, J. C. Burant, S. S. Iyengar, J. Tomasi, M. Cossi, N. Rega, J. M. Millam, M. Klene, J. E. Knox, J. B. Cross, V. Bakken, C. Adamo, J. Jaramillo, R. Gomperts, R. E. Stratmann, O. Yazyev, A. J. Austin, R. Cammi, C. Pomelli, J. W. Ochterski, R. L. Martin, K. Morokuma, V. G. Zakrzewski, G. A. Voth, P. Salvador, J. J. Dannenberg, S. Dapprich, A. D. Daniels, Ö. Farkas, J. B. Foresman, J. V. Ortiz, J. Cioslowski and D. J. Fox, Gaussian 09, Revision B.01, Gaussian, Inc., Wallingford CT, 2009 Search PubMed.
- B. J. Ransil, J. Chem. Phys., 1961, 34, 2109 CrossRef CAS.
- S. Boys and F. Bernardi, Mol. Phys., 1970, 19, 553 CrossRef CAS.
- K. Ueno, K. Yoshida, M. Tsuchida, N. Tachikawa, K. Dokko and M. Watanabe, J. Phys. Chem. B, 2012, 116, 11323 CrossRef CAS PubMed.
- L. Carbone, D. D. Lecce, M. Gobet, S. Munoz, M. Devany, S. Greenbaum and J. Hassoun, ACS Appl. Mater. Interfaces, 2017, 9, 17085 CAS.
- H. Evey, A. G. Bishop, M. Forsyth and D. R. MacFarlane, Electrochim. Acta, 2000, 45, 1279 CrossRef.
- Y. Yamada and A. Yamada, J. Electrochem. Soc., 2015, 162(14), A2406 CrossRef CAS.
Footnote |
| † Electronic supplementary information (ESI) available. See DOI: 10.1039/c7ra07501d |
| This journal is © The Royal Society of Chemistry 2017 |

