 Open Access Article
Creative Commons Attribution 3.0 Unported Licence
Heterogeneous Fenton-like catalysis of Fe-MOF derived magnetic carbon nanocomposites for degradation of 4-nitrophenol†
Dezhi Chen *a,
Shasha Chena,
Yijie Jianga,
Shasha Xiea,
Hongying Quanb,
Li Huaa,
Xubiao Luo
 *a and
Lin Guoac
aKey Laboratory of Jiangxi Province for Persistent Pollutants Control and Resources Recycle, School of Environmental and Chemical Engineering, Nanchang Hangkong University, No. 696, Fenghe South Avenue, Nanchang, 330063, China. E-mail: chendz@nchu.edu.cn; luoxubiao@nchu.edu.cn
bSchool of Materials Science and Engineering, Nanchang Hangkong University, No. 696, Fenghe South Avenue, Nanchang 330063, China
cKey Laboratory of Bio-Inspired Smart Interfacial Science and Technology of Ministry of Education, School of Chemistry and Environment, Beihang University, No. 37 Xueyuan Road, Haidian District, Beijing 100191, China
First published on 18th October 2017
Abstract
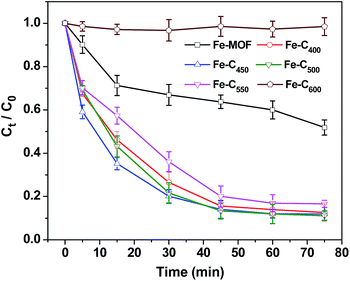
Magnetic carbon nanocomposites (Fe–Cx) as heterogeneous Fenton-like catalysts were synthesized by the pyrolysis of iron based metal-organic frameworks (Fe-MOF), and the degradation removal of 4-nitrophenol (4-NP) in aqueous solution was used to evaluate the catalytic activity of Fe–Cx. The results showed that 4-NP could be effectively degraded by Fe–Cx in the presence of hydrogen peroxide. Pyrolysis temperature significantly affected the component, structures and performances of the catalysts, and the as-prepared Fe–C500 exhibited the best catalytic performance. Furthermore, the effects of several reaction conditions, such as catalyst loading, H2O2 dosage, reaction temperature, and initial pH, on the catalytic degradation of 4-NP were extensively analyzed for the practical applications of Fe–C500. At an initial circumneutral pH of 6.21, 89.0% of 0.36 mM 250 mL of 4-NP solution could be degradated after 75 min by the heterogeneous Fenton-like oxidation on the 0.08 g L−1 of Fe–C500 in the presence of 7.8 mM H2O2. The results of activation energy and the reaction kinetics showed Fe–C500 possessed a high catalytic activity in the heterogeneous Fenton reaction of 4-NP. Moreover, the prepared Fe–C500 could be reused by an external magnet, and still retained good catalytic activity with 52.4% degradation of 4-NP at the fourth cycle.
1. Introduction
With the wide use of pesticides, drugs, dyes, and other organic matter, increasingly detrimental pollutants are discharging into environment, which will cause great damage to the health of humans and other creatures.1,2 Therefore, it is significant to take effective measures to dispose of these contaminants. Various methods, including adsorption,3 flocculation,4 membrane filtration,5 microorganism degradation,6 have been investigated and developed to remove organic pollutants from effluent. However, some of these processes suffer from drawbacks such as partial degradation of the effluent, toxic by-products and excessive sludge production, energy consumption, and secondary phase generation that imposes extra cost in the process.7–9 Therefore, it is necessary to improve the treatment efficiency of conventional wastewater treatment methods. Advanced oxidation processes (AOPs), such as Fenton oxidation consisting of catalyst (Fe2+/Fe3+) and hydrogen peroxide (H2O2), have been found to be effective at degrading recalcitrant and chemically complicated organics contaminants.10,11 However, there are still certain limitations regarding the application of Fenton oxidation processes. The homogeneous type operates in a narrow range of pH (2–4), and large quantities of acid are required and a neutralization step is required afterward.11–15 Furthermore, the stoichiometric amounts of iron are required, and very hard to remove after the reaction. Therefore, this process can also generate secondary pollution (e.g. acid or metal ions) as well as metal hydroxide sludge. To overcome these problems, heterogeneous Fenton-like catalysts based on iron-containing solids have been intensively investigated.13,14,16–21 Among iron-containing solids, magnetic recoverable nanoparticles (Fe3O4, γ-Fe2O3, and Fe0) show effective heterogeneous Fenton catalyst because of their highly acceptable reusability and stability, low toxicity, and easy separation.22–24 However, these magnetic iron-based nanoparticles have a strong tendency to agglomerate, resulting in the reduce of their catalytic activity.25,26 To circumvent the obstacle, carbonaceous materials with high conduct electricity, specific surface area and porosity, have been widely chosen as matrices for loading of magnetic nanoparticles, which not only can enhance electron transfer and increase the active sites for the degradation of pollutants in water but also facilitate the separation of catalyst from water system.14,25,27–29Recently, the pyrolysis of metal–organic frameworks (MOFs) has been considered an effective and simple way to construct magnetic recoverable iron-containing nanoparticles/porous carbon composites using in Fenton-like reaction for the degradation of organic pollution in aqueous system.17,30–32 For example, MIL-53(Fe)-derived magnetic γ-Fe2O3/C showed high catalytic activity for the degradation of malachite green under sunlight in the presence of H2O2.30 Magnetic iron/carbon nanorods derived from MIL-88A could activate peroxide for the decolorization of rhodamine B in water.17 During the pyrolysis process, these Fe-MOFs were gradually decomposed to magnetic iron-containing nanoparticles/porous carbon composites with the increase of temperature under inert atmosphere. Therefore, the pyrolysis temperature is key factor for the morphology, structure, and activity of product. However, until now there has been a lack of such information to the best of our knowledge. Herein, porous magnetic carbon composites with iron-based nanoparticles were prepared by the thermal decomposition of Fe-MOF at different temperature in N2 atmosphere. The catalytic activity of obtained magnetic products for the heterogeneous Fenton-like degradation of 4-nitrophenol (4-NP) in aqueous solution was studied in detail.
2. Experimental section
2.1 Materials
Iron(III) chloride hexahydrate (FeCI3·6H2O), p-phthalic acid (PTA), N,N-dimethylformamide (DMF), hydrogen peroxide (H2O2), ethanol, n-butyl alcohol was analytical reagent grade and used directly without further purification.2.2 Preparation of Fe-MOF and magnetic carbon nanocomposites
Fe-MOF was synthesized by the previous report with some modifications.33 In a typical preparation, 15.5 g FeCI3·6H2O and 10.6 g PTA was mixed in 640 mL DMF solution by magnetic stirring until complete dissolution, and then the above mixture was transferred into a three-neck round bottom flask connected to condenser and heated at 100 °C for 12 hours in an oil bath with magnetic stirring. After naturally cooled to room temperature, the supernatant was centrifuged to obtain orange-yellow product. The product was washed using ethanol for several times and dried in vacuum at 80 °C for 24 hours. Finally, the solid Fe-MOF powder was annealed in a tube furnace at different temperature (400 °C, 450 °C, 500 °C, 550 °C, 600 °C) (ramp rate, 1 °C min−1) for 1 hour in a N2 atmosphere to prepare the magnetic carbon nanocomposites. The obtained magnetic carbon materials were labelled as Fe–Cx, where x denoted the heating temperature.2.3 Characterization
Thermogravimetric analysis (TGA) was used to measure the thermal stability of the Fe-MOF. X-ray diffractometer (XRD, D8 Advanced, Bruker, at 40 kV and 40 mA, Cu Kα radiation, λ = 1.5406 Å) and scanning electron microscope (FEI Quanta 450) with an acceleration voltage of 10 kV was used to characterize the phase and morphology of Fe-MOF and magnetic Fe–Cx nanocomposites, respectively. X-ray photoelectron spectroscopy (XPS, Thermo Scientific ESCALAB 250, A1 Kα radiation) was used to analyse the elemental composition and corresponding chemical state in the surface of Fe-MOF and magnetic Fe–Cx nanocomposites. TriStar II 3020 surface area and pore size analyser (Micromeritics) was used to obtain the nitrogen adsorption–desorption isotherms of magnetic Fe–Cx nanocomposites. The specific surface area, total pore volume and pore-size distribution of the Fe–Cx nanocomposites was determined by the Brunauer–Emmett–Teller (BET) and Barrett–Joyner–Halenda (BJH) method, respectively. Magnetic properties were tested using a physical properties measurement system (PPMS-DynaCool, Quantum Design, USA) equipped with a 9T vibrating sample magnetometer (VSM).2.4 Heterogeneous Fenton-like catalytic activity measurement
The target contaminate was 4-nitrophenol (4-NP). In a typical experiment, 250 mL of 4-NP aqueous solution (0.36 mM) and a certain amount of catalysts were mixed and magnetically stirred for 30 min to ensure the establishment of an adsorption/desorption equilibrium. Then, a certain amount of H2O2 aqueous solution was added into the reactor. The heterogeneous Fenton-like degradation was carried on during 75 min as soon as the H2O2 aqueous solution was added. At the intervals of given time, 2 mL of the suspension was collected and the degradation reaction was stopped by adding n-butyl alcohol. Then, the suspension was filtered using 0.22 μm membrane filter to remove the catalysts and the 4-NP concentration was determined by using a UV spectrophotometer. The reusability of the catalyst was evaluated by washing and drying the catalyst in air oven at 120 °C for overnight and using it for dye degradation under similar experimental conditions. Each experiment was repeated three times.3. Results and discussion
3.1 Thermal stability of Fe-MOF
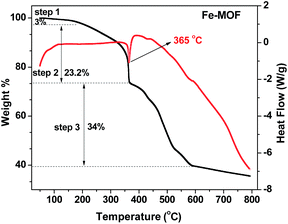
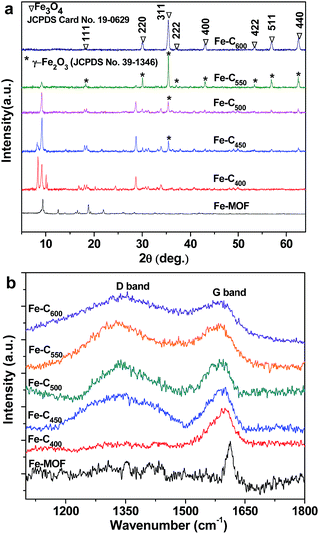
To prepare magnetic Fe–Cx nanocomposites, the thermal stability of Fe-MOF is important and characterized by TGA in N2 atmosphere at a heating rate of 1 °C min−1. The obtained TGA curve, shown in Fig. 1, suggests that it has three steps for mass loss of as-prepared Fe-MOF sample with increasing temperature. The first mass loss is about 3% below 200 °C, which can be attributed to the removal of adsorbed water and DMF. The second mass loss between 200 and 365 °C is 23.2% mainly resulting from the decomposition of oxygen-containing groups in the organic ligands of PTA and DMF of Fe-MOF, and a narrow endothermic peak at 365 °C can be found during the second weight loss process. With the increasing temperature, the mass loss of step 3 from 365 °C to 586 °C may be attributed to the loss of chlorine, the decomposition of aromatic rings, the conformation of iron oxides and the conversion between iron oxides.34 The conversion could be attributed to the incomplete calcined products as evidenced by thermal stability. After 600 °C, the mass of material was relatively stable. Therefore, the pyrolysis products of Fe-MOF sample from 400 to 600 °C were used as catalyst for the Fenton-like degradation of organic pollution.The phase of the as-prepared samples under different pyrolysis temperature was demonstrated by powder X-ray diffraction, and depicted in Fig. 2a. From Fig. 2a, we can see six well-defined diffraction peaks at 9.4, 12.6, 16.6, 18.8, 21.9 and 28.4°, which is in accordance with that of MIL-101(Fe) (Fe3(O)Cl[C6H4(CO2)2]3(C3H7NO)) in previous reported literatures.35,36 After heat treatment at 400 °C, the as-obtained Fe–C400 exhibits that the main diffraction peaks appear in three areas between 8 to 10°, 15 to 20° and 28 to 35°, which is different with that of the bare Fe-MOF. It indicates that the phase of Fe-MOF was completely changed at 400 °C because of loss of part of oxygen-containing groups. However, no any diffraction peaks belong to iron oxides, which suggests that the temperature of 400 °C was not enough for the decomposition of the Fe-MOF to iron oxide and carbon, and the Fe–C400 was intermediate product between the Fe-MOF and iron oxide/carbon composites. The typical pattern of Fe–C400 implies that the Fe–C400 may still be metal–organic complexes. When the temperature was increased to 450 °C, part of peaks between 8 and 10° disappear, and new peak raises at 2θ = 35.5°, which may be assigned to (311) planes of γ-Fe2O3 (JCPDS no. 39-1346). With the temperature to 500 °C, new diffraction peaks at about 18.6, 30.3, 35.5, 37.3, 43.3, 53.7, 57.2 and 62.7° appear and old diffraction peaks such as 8.2, 9.2, 10, 28 and 35° fall off. The intensity of these new diffraction peaks gradually increases and those pristine diffraction peaks gradually disappear until the temperature was increased to 600 °C. The mainly diffraction peaks of Fe–C600, present in Fig. 2a at 2θ values about 18.6, 30.3, 35.4, 37.3, 43.31, 53.7, 57.2 and 62.7° correspond to (111), (220), (311), (222), (400), (422), (511) and (440), respectively, which are readily indexed to a pure phase of Fe3O4 (JCPDS card no. 19-0629). Meanwhile, it indicates that the Fe–Cx (450, 500, 550) are multicomponent.
Fig. 2b shows the Raman spectra of Fe-MOF and Fe–Cx. For the Fe-MOF, an apparent characteristic peak at 1612 cm−1, as presented in Fig. 2b, is assigned to the vibration of C–C in benzene ring.37 After heat treatment at 400 °C, we still only observe a characteristic peak at 1599 cm−1 for the as-prepared Fe–Cx. When the treatment temperature was increased to 450 °C and more, two characteristic peaks at about 1333 cm−1 and 1590 cm−1 are attributed to the D band (sp3-C) and G band (sp2-C) of carbon, respectively, in addition, the intensity ratio of D band and G band (ID/IG) increase with the increase of temperature. It indicates that the sp2-C in benzene ring could be decomposed at the temperature up to 450 °C, and the organic ligands of PTA in Fe-MOF were gradually converted to amorphous carbon with the increase of temperature to 600 °C, which are consistent with the XRD results. These amorphous carbon is favour of the dispersion of iron oxides nanoparticles.
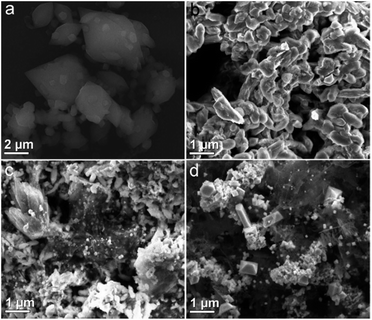
SEM image, shown in Fig. 3a, reveals that the Fe-MOF crystals are spindle-like shape with a nonuniform size and smooth surface. After treatment of the Fe-MOF crystals at 400 °C, we can observe that the spindle-like Fe-MOF crystals were transformed into homogeneous Fe–C400 particles that are gathered together with single morphology and rough surface (Fig. 3b). When the temperature was increased to 500 °C, it can be seen some graphene-like carbon sheets (Fig. 3c) from the pyrolysis of organic ligands. Moreover, lots of inorganic particles can be observed around these carbon sheets for Fe–C500. After the temperature was further increased to 600 °C, the as-prepared Fe–C600 (Fig. 3d) exhibit more carbon sheets than that of Fe–C500, and many octahedral nanocrystals were formed on the surface of carbon sheets. SEM analyses reveal that different annealing temperatures have a noticeable effect on the morphology of the as-synthesized products.
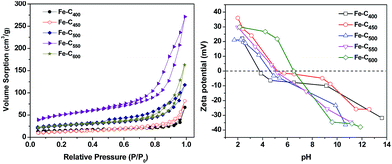
To study the porosity of all samples, N2 adsorption–desorption isotherms were measured, as depicted in Fig. 4. All of the isotherms present typical type IV profiles and H3 hysteresis loop on the basis of IUPAC classical-cation, indicating the similar pore structures of Fe–Cx and the predominance of the mesopore.38 The H3 hysteresis are typically given by aggregates of plate-shaped particles or adsorbents containing slit-shaped pores,39,40 implying the presence of carbon sheets in as-prepared Fe–Cx samples. Furthermore, the parameters of the porous structure and textural properties are listed in Table S1.† The BET specific surface area of Fe–C400, Fe–C450, Fe–C500, Fe–C550, Fe–C600 are 49.1094, 42.9603, 86.6838, 171.2443 and 88.9648 m2 g−1 respectively. Besides, the average pore size of these materials is range from 8.3 to 11.8 nm.
Fig. 4b shows the zeta-potential diagrams of Fe–Cx. The point of zero charge (pHpzc) of various Fe–Cx (x = 400, 450, 500, 550, 600 °C) was 3.7, 5.9, 4.9, 5.3 and 6.7, respectively. As we known, when pH > pHpzc, the surface charge of the materials is negative, and will be positive at pH < pHpzc. Therefore, the surface charges of Fe–C400, Fe–C450, Fe–C500, Fe–C550 were negative in Fenton-like reaction system at circumneutral pH = 6.21, in contrast, the Fe–C600 was positive.
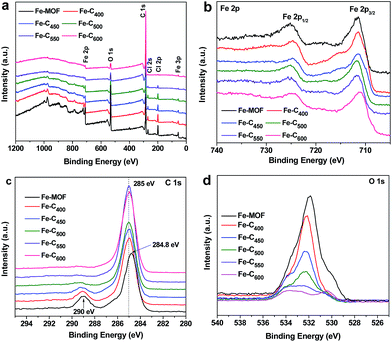
Fig. 5 show the XPS spectra in the surface of Fe–Cx composites. Full-view (Fig. 5a) of XPS spectra indicates that composites have iron, carbon, oxygen, chlorine, and nitrogen elements, which contained in the pristine Fe-MOF (Fe3(O)Cl[C6H4(CO2)2]3(C3H7NO)) (Table S2†). Besides, the gradually decreasing of mass ratios of chlorine and oxygen in the as-prepared Fe–Cx composites indicates that the chlorine and oxygen escaped during the production of iron oxides/carbon. Fig. 5b shows the XPS spectra of Fe 2p for Fe-MOF and Fe–Cx composites. For the pristine Fe-MOF, we can see two main peaks at 711.5 and 725 eV and a satellite peak at 718.5 eV, which matches well with the MOF of MIL-Fe41,42 The spectra of Fe 2p for Fe–C400 and Fe–C450 show three peaks at 711.5, 715.8 and 724.6 eV, indicating that the chemical environment of Fe(III) had changed but possibly still bonded with benzene rings in as-prepared Fe–C400 and Fe–C450. The spectra of Fe 2p for Fe–C500 and Fe–C550 show two main peaks at 711.6 and 724.8 eV, and a satellite peak of 718.5 eV, which are in good agreement with the reported values for Fe2O3.43 It indicates that the most of Fe-MOFs had been converted into iron oxides at the pyrolysis temperature of 500 and 550 °C. For Fe–C600, the peak positions of Fe 2p3/2 and Fe 2p1/2 are, respectively, 711.1 and 724.6 eV, and no obviously satellite peak presents, which is well consistent with the results of reported Fe3O4.43,44 In addition, a peak at 711.1 eV for Fe–C550 indicates that there have Fe3O4 particles. The C 1s spectra of Fe-MOF and Fe–Cx are presented in Fig. 2c. As we can see that the main peak at 284. 8 eV for Fe-MOF gradually shifted to 285 eV for Fe–C600, which confirms the loss of COO groups and pyrolysis of benzene ring. The C 1s spectra of Fe-MOF and Fe–Cx can be deconvoluted to three peaks at about 285, 286, and 289.5 eV (Fig. S1†), corresponding to C–C, C–O, and O–C![[double bond, length as m-dash]](https://www.rsc.org/images/entities/char_e001.gif) O groups, respectively. With the increase of temperature, the peak at 289.5 eV gradually disappears (Fig. 5c), indicating that the carbonyl groups were decomposed to CO or CO2 gas gradually. Fig. 5d shows the O 1s spectra of Fe-MOF and Fe–Cx composites. Obviously, the content of oxygen-containing groups was reduced with the increase of temperature. As shown in Fig. S2a,† the O 1s spectra of Fe-MOF can be fitted to three peaks at 530.1, 531.9 and 533.5 eV, corresponding to Fe–O, C–O, and C
O groups, respectively. With the increase of temperature, the peak at 289.5 eV gradually disappears (Fig. 5c), indicating that the carbonyl groups were decomposed to CO or CO2 gas gradually. Fig. 5d shows the O 1s spectra of Fe-MOF and Fe–Cx composites. Obviously, the content of oxygen-containing groups was reduced with the increase of temperature. As shown in Fig. S2a,† the O 1s spectra of Fe-MOF can be fitted to three peaks at 530.1, 531.9 and 533.5 eV, corresponding to Fe–O, C–O, and C![[double bond, length as m-dash]](https://www.rsc.org/images/entities/char_e001.gif) O groups. After heat treatment, all the three peaks shifted to about 530.8, 532.5 and 533.9 eV (Fig. S2†), indicating the change of chemical environment of oxygen in Fe-MOF and Fe–Cx. According to the above characterization, the speculated main components of Fe–Cx at different pyrolysis temperature are listed in Table S3.†
O groups. After heat treatment, all the three peaks shifted to about 530.8, 532.5 and 533.9 eV (Fig. S2†), indicating the change of chemical environment of oxygen in Fe-MOF and Fe–Cx. According to the above characterization, the speculated main components of Fe–Cx at different pyrolysis temperature are listed in Table S3.†
3.2 Heterogeneous Fenton-like degradation of 4-NP by Fe–Cx
Ct = C0![[thin space (1/6-em)]](https://www.rsc.org/images/entities/char_2009.gif) exp exp![[thin space (1/6-em)]](https://www.rsc.org/images/entities/char_2009.gif) (−kt) (−kt)
| (1) |
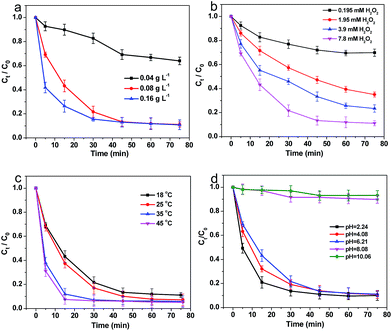 | ||
| Fig. 7 Effects of reaction conditions on the degradation 4-NP by Fe–C500. (a) Catalyst loading, (b) H2O2 dosage, (c) reaction temperature, and (d) initial pH. | ||
| Fe–C500 (mg L−1) | H2O2 (mM) | T (°C) | k (h−1) | R |
|---|---|---|---|---|
| 0.04 | 7.8 | 18 | 0.35 | 0.90948 |
| 0.08 | 7.8 | 18 | 2.98 | 0.98997 |
| 0.16 | 7.8 | 18 | 3.37 | 0.81872 |
| 0.08 | 7.8 | 25 | 3.48 | 0.99255 |
| 0.08 | 7.8 | 35 | 8.29 | 0.95969 |
| 0.08 | 7.8 | 45 | 10.1 | 0.96416 |
| 0.08 | 0.195 | 18 | 0.35 | 0.90013 |
| 0.08 | 1.95 | 18 | 0.83 | 0.97503 |
| 0.08 | 3.9 | 18 | 1.28 | 0.96035 |
As the k value increased at higher temperatures, the Arrhenius equation was adopted to calculate the activation energy as the following equation:
 | (2) |
![[thin space (1/6-em)]](https://www.rsc.org/images/entities/char_2009.gif) k against 1/T and was 38.5 kJ mol−1. This value is higher than the activation energy of the diffusion-controlled reactions, which usually ranges in 10–13 kJ mol−1.45 It indicates that the Fenton reaction rate is dominated by the rate of intrinsic chemical reactions on the Fe–C500 surface rather than the rate of mass transfer. The value of Ea in our study is between 20.7 and 56.1 kJ mol−1 of the activation energy of Fenton reactions using different heterogeneous catalysts from literature data,46 indicating that Fe–C500 composite showed a high catalytic activity in heterogeneous Fenton reaction of 4-NP.
k against 1/T and was 38.5 kJ mol−1. This value is higher than the activation energy of the diffusion-controlled reactions, which usually ranges in 10–13 kJ mol−1.45 It indicates that the Fenton reaction rate is dominated by the rate of intrinsic chemical reactions on the Fe–C500 surface rather than the rate of mass transfer. The value of Ea in our study is between 20.7 and 56.1 kJ mol−1 of the activation energy of Fenton reactions using different heterogeneous catalysts from literature data,46 indicating that Fe–C500 composite showed a high catalytic activity in heterogeneous Fenton reaction of 4-NP.
3.3 Recyclability of Fe–C500
The potential to reuse Fe–C500 for degradation of 4-NP was tested and shown in Fig. 8a. At the 1st cycle, 89.0 wt% of 4-NP can be degraded, and reduced to 61.1 wt% at the 2nd cycle. It is mainly attributed to that part of iron in Fe–C500 was dissolved during the 1st cycle. After two cycles, the Fenton-like catalytic activity of Fe–C500 was stable, 54.2 and 52.4 wt% 4-NP was removed at the 3rd and 4th cycle, respectively. Fig. 8b shows the hysteresis loop of Fe–C500 before catalysis and after 4 cycles. A typical “S”-like shape of the hysteresis loop was observed, indicating the paramagnetic properties of the samples, and the magnetic Fe–C500 can be easily recovered by using a magnet after 4 cycles (Fig. S4†). In addition, the saturation magnetization of Fe–C500 after 4 cycles is higher than that of the catalyst before the catalytic reaction, which imply that the loss of iron from Fe–C500 mainly come from the iron-organic ligands but not the iron oxides.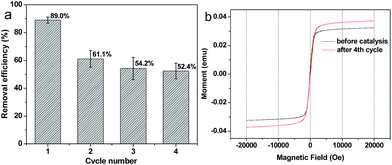 | ||
| Fig. 8 (a) Reusable degradation activity for Fe–C500 up to 4 cycles and (b) hysteresis loop of Fe–C500 before catalysis and after 4 cycles. | ||
4. Conclusions
In summary, various Fe–Cx nanocomposites could be prepared using Fe-MOF as precursors under N2 protection. The pyrolysis temperature could affect the component, structure and morphology of as-prepared Fe–Cx nanocomposites. Furthermore, the reaction condition, such as the catalyst loading, H2O2 dosage, reaction temperature, and initial pH could significantly affect the catalytic degradation of 4-NP on the surface of Fe–Cx nanocomposites. The oxidation degradation of 4-NP indicated that the Fe–C500 showed the best heterogeneous Fenton-like catalytic activity with 89.0 wt% removal efficiency of 250 mL 0.36 mM of 4-NP within 75 min by using 0.08 g L−1 of catalyst loading and 7.8 mM H2O2 at 18 °C. Furthermore, the magnetic Fe–C500 can be easily recycled by using a magnet. The impressive results showed that the preparation of magnetic carbon nanocomposites derived from Fe-MOFs at suitable pyrolysis temperature is an effective route to fabricate high performance Fenton-like catalyst for degradation of organic pollutants in aqueous solution.Conflicts of interest
There are no conflicts to declare.Acknowledgements
This work was supported by the National Natural Science Foundation of China (51402146), the National Science Foundation for Excellent Young Scholars (51422807), the Natural Science Foundation (20171BAB206046) of Jiangxi Province, and the Science and Technology Planning Project (20151BBG70019) of Jiangxi Province.Notes and references
- A. Myridakis, G. Chalkiadaki, M. Fotou, M. Kogevinas, L. Chatzi and E. G. Stephanou, Environ. Sci. Technol., 2016, 50, 932–941 CrossRef CAS PubMed.
- Y. Z. Gong, K. Baylis, R. Kozak and G. Bull, Agr. Econ., 2016, 47, 411–421 CrossRef.
- F. Zietzschmann, C. Stuetzer and M. Jekel, Water Res., 2016, 92, 180–187 CrossRef CAS PubMed.
- S. Y. Jia, Z. Yang, W. B. Yang, T. T. Zhang, S. P. Zhang, X. Z. Yang, Y. Y. Dong, J. Q. Wu and Y. P. Wang, Chem. Eng. J., 2016, 283, 495–503 CrossRef CAS.
- J. Li, R. Kang, X. Tang, H. She, Y. Yang and F. Zha, Nanoscale, 2016, 8, 7638–7645 RSC.
- T. T. More, J. S. Yadav, S. Yan, R. D. Tyagi and R. Y. Surampalli, J. Environ. Manage., 2014, 144, 1–25 CrossRef CAS PubMed.
- O. G. Apul and T. Karanfil, Water Res., 2015, 68, 34–55 CrossRef CAS PubMed.
- S. Hokkanen, A. Bhatnagar and M. Sillanpaa, Water Res., 2016, 91, 156–173 CrossRef CAS PubMed.
- D. Chen, W. Shen, S. Wu, C. Chen, X. Luo and L. Guo, Nanoscale, 2016, 8, 172–179 RSC.
- S. Giannakis, F. A. G. Vives, D. Grandjean, A. Magnet, L. F. De Alencastro and C. Pulgarin, Water Res., 2015, 84, 295–306 CrossRef CAS PubMed.
- S. G. Ardo, S. Nelieu, G. Ona-Nguema, G. Delarue, J. Brest, E. Pironin and G. Morin, Environ. Sci. Technol., 2015, 49, 4506–4514 CrossRef CAS PubMed.
- X. Li, Z. Wang, B. Zhang, A. I. Rykov, M. A. Ahmed and J. Wang, Appl. Catal., B, 2016, 181, 788–799 CrossRef CAS.
- S. H. Yoo, D. Jang, H.-I. Joh and S. Lee, J. Mater. Chem. A, 2017, 5, 748–755 CAS.
- Y. Yao, H. Chen, J. Qin, G. Wu, C. Lian, J. Zhang and S. Wang, Water Res., 2016, 101, 281–291 CrossRef CAS PubMed.
- M. Munoz, Z. M. de Pedro, J. A. Casas and J. J. Rodriguez, Appl. Catal., B, 2015, 176–177, 249–265 CrossRef CAS.
- H. Lv, H. Zhao, T. Cao, L. Qian, Y. Wang and G. Zhao, J. Mol. Catal. A: Chem., 2015, 400, 81–89 CrossRef CAS.
- K.-Y. A. Lin and F.-K. Hsu, RSC Adv., 2015, 5, 50790–50800 RSC.
- X.-J. Yang, X.-m. Xu, J. Xu and Y.-F. Han, J. Am. Chem. Soc., 2013, 135, 16058–16061 CrossRef CAS PubMed.
- H. Chen, Z. L. Zhang, Z. L. Yang, Q. Yang, B. Li and Z. Y. Bai, Chem. Eng. J., 2015, 273, 481–489 CrossRef CAS.
- J. H. Deng, J. Y. Jiang, Y. Y. Zhang, X. P. Lin, C. M. Du and Y. Xiong, Appl. Catal., B, 2008, 84, 468–473 CrossRef CAS.
- I. S. X. Pinto, P. Pacheco, J. V. Coelho, E. Lorencon, J. D. Ardisson, J. D. Fabris, P. P. de Souza, K. W. H. Krambrock, L. C. A. Oliveira and M. C. Pereira, Appl. Catal., B, 2012, 119, 175–182 CrossRef.
- L. Xu and J. Wang, Appl. Catal., B, 2012, 123–124, 117–126 CrossRef CAS.
- M. J. Jin, M. C. Long, H. R. Su, Y. Pan, Q. Z. Zhang, J. Wang, B. X. Zhou and Y. W. Zhang, Environ. Sci. Pollut. Res., 2017, 24, 1926–1937 CrossRef CAS PubMed.
- Y. Pan, M. Zhou, X. Li, L. Xu, Z. Tang and M. Liu, Sep. Purif. Technol., 2016, 169, 83–92 CrossRef CAS.
- L. Yu, X. Yang, Y. Ye and D. Wang, RSC Adv., 2015, 5, 46059–46066 RSC.
- V. Cleveland, J.-P. Bingham and E. Kan, Sep. Purif. Technol., 2014, 133, 388–395 CrossRef CAS.
- M. Goncalves, M. C. Guerreiro, L. C. de Oliveira and C. S. de Castro, J. Environ. Manage., 2013, 127, 206–211 CrossRef CAS PubMed.
- M. R. Carrasco-Diaz, E. Castillejos-Lopez, A. Cerpa-Naranjo and M. L. Rojas-Cervantes, Microporous Mesoporous Mater., 2017, 237, 282–293 CrossRef CAS.
- Y. Yao, H. Chen, C. Lian, F. Wei, D. Zhang, G. Wu, B. Chen and S. Wang, J. Hazard. Mater., 2016, 314, 129–139 CrossRef CAS PubMed.
- C. Zhang, F. Ye, S. Shen, Y. Xiong, L. Su and S. Zhao, RSC Adv., 2015, 5, 8228 RSC.
- X. Li, A. I. Rykov, B. Zhang, Y. Zhang and J. Wang, Catal. Sci. Technol., 2016, 6, 7486–7494 CAS.
- K. A. Lin and B. J. Chen, Chemosphere, 2017, 166, 146–156 CrossRef CAS PubMed.
- X. Cao, B. Zheng, X. Rui, W. Shi, Q. Yan and H. Zhang, Angew. Chem., Int. Ed., 2013 DOI:10.1002/anie.201308013.
- L. Wang, Y. Zhang, X. Li, Y. Xie, J. He, J. Yu and Y. Song, Sci. Rep., 2015, 5, 14341 CrossRef CAS PubMed.
- X. Cai, J. Lin and M. Pang, Cryst. Growth Des., 2016, 16, 3565–3568 CAS.
- T. Yamada, K. Shiraishi, H. Kitagawa and N. Kimizuka, Chem. Commun., 2017, 53, 8215–8218 RSC.
- G.-T. Vuong, M.-H. Pham and T.-O. Do, CrystEngComm, 2013, 15, 9694 RSC.
- Y. Li, Q. Zhang, J. Zhang, L. Jin, X. Zhao and T. Xu, Sci. Rep., 2015, 5, 14155 CrossRef CAS PubMed.
- K. S. W. Sing and R. T. Williams, Adsorpt. Sci. Technol., 2004, 22, 773–782 CrossRef CAS.
- M. Díaz Ramos, G. I. Giraldo Gómez and N. Sanabria González, J. Mol. Catal. B: Enzym., 2014, 99, 79–84 CrossRef.
- S.-H. Huo and X.-P. Yan, J. Mater. Chem., 2012, 22, 7449 RSC.
- W. Cho, S. Park and M. Oh, Chem. Commun., 2011, 47, 4138–4140 RSC.
- T. Yamashita and P. Hayes, Appl. Surf. Sci., 2008, 254, 2441–2449 CrossRef CAS.
- J. A. Cuenca, K. Bugler, S. Taylor, D. Morgan, P. Williams, J. Bauer and A. Porch, J. Phys.: Condens. Matter, 2016, 28, 106002 CrossRef PubMed.
- S.-S. Lin and M. D. Gurol, Environ. Sci. Technol., 1998, 32, 1417–1423 CrossRef CAS.
- L. Xu and J. Wang, Environ. Sci. Technol., 2012, 46, 10145–10153 CrossRef CAS PubMed.
Footnote |
| † Electronic supplementary information (ESI) available. See DOI: 10.1039/c7ra09234b |
| This journal is © The Royal Society of Chemistry 2017 |

