 Open Access Article
Creative Commons Attribution 3.0 Unported Licence
Microstructure and photocatalytic properties of polyimide/heterostructured NiO–Fe2O3–ZnO nanocomposite films via an ion-exchange technique
Yonglin Lei *,
Jichuan Huo and
Huiwei Liao
Engineering Research Center of Biomass Materials, Ministry of Education, School of Materials Science and Engineering, Southwest University of Science and Technology, Mianyang 621010, China. E-mail: leiyonglin@163.com; Tel: +86-816-2419209
First published on 21st August 2017
Abstract
A series of NiO–Fe2O3–ZnO layers on double surfaces of polyimide (PI) film have been fabricated by alkaline-induced chemical modification and ion-exchange reaction. The X-ray diffraction (XRD), X-ray photoelectron spectroscopy (XPS) and Fourier transform infrared spectroscopy (FT-IR) analyses confirmed the successful formation of the heterostructured NiO–Fe2O3–ZnO layers on PI surfaces. Scanning electron microscopy (SEM) and atomic force microscopy (AFM) showed that the NiO–Fe2O3–ZnO nanoparticles were dispersed uniformly on the PI surface and exhibited an interesting mesh-shaped morphology. The UV-vis absorption results demonstrated that the PI/heterostructured NiO–Fe2O3–ZnO nanocomposite exhibited wide visible-light photo absorption in the 400–740 nm range. Moreover, the PI/heterostructured NiO–Fe2O3–ZnO nanocomposite films possessed excellent mechanical properties and acceptable adhesion, and they exhibited superior photocatalytic activity compared with PI/ZnO nanocomposite film toward the degradation of dyes under solar irradiation. The degradation rate of methyl orange over PZNF-3 after 240 min simulated solar light irradiation reached an optimum value 96.2%. The improved photocatalytic activity of the PI/heterostructured NiO–Fe2O3–ZnO could be mainly attributed to the efficient separation of photoinduced electrons and holes of the photocatalysts, caused by the vectorial transfer of electrons and holes among ZnO, NiO and Fe2O3. This study introduces a new class of promising sunlight-driven photocatalytic nanocomposites with outstanding comprehensive performance.
1. Introduction
Organic pollutants in wastewater have become a world-wide problem, along with industrial development. Semiconductor photocatalysis has been considered as one of the most foreground technologies for utilization of natural solar energy to degrade organic pollutants in wastewater.1 Among various semiconductor photocatalysts, ZnO, as a promising semiconductor material, has been used for removing the toxic organic pollutants due to its unique properties such as non-toxicity, abundance in nature, easy fabrication, low cost, low resistivity, suitable band gap (3.37 eV), high chemical stability under reducing atmosphere, high photosensitivity and high catalytic activity.2–6 However, the low optical response of ZnO over the entire solar spectrum and the rapid recombination of photo induced electrons and holes weaken its photocatalytic efficiency. To improve its photocatalytic efficiency, various techniques such as doping,7–11 modifying by organics,12 fabricating heterostructured metal oxides13–21 and reducing particle size have been performed.22 The single method of these approaches has resulted in the improvements of catalytic properties but only to a limited extent. For example, combining a p-type semi-conductor with a suitable n-type semiconductor can drive the photogenerated electrons and holes to the opposite directions,21 thereby minimizing their recombination, while the enhancement of its visible light response is limited. Combining multiple ways of above these approaches to improve the photocatalytic efficiency of ZnO may be possible to compensate for the limitations of each method and achieve the maximum synergies. Therefore, it is necessary to find novel ways how to combine multiple ways of above these approaches to improve the photocatalytic efficiency of ZnO. On the other hand, due to the sophisticated filtration of the suspended photoactive ZnO nanoparticles from the reaction medium after treatment period, its practical and economical application appear to be so difficult. Immobilization of ZnO on a surface is an effective route to overcome disadvantages. Different immobilization techniques and support materials are used to produce these types of materials.23,24 Polymeric materials are especially preferred due to excellent flexibility and easy machining according to the specific application shape.Over recent years, aromatic polyimide (PI) has been considered to be one of the most important substrates of composite materials, because of its excellent mechanical properties, thermal stability and chemical resistance.25,26 Meanwhile, the hybrid PI/ZnO composite material has been demonstrated for enhancing photocatalytic efficiency,27 as a result of ZnO modifying by large conjugated aromatic structure of PI. More importantly, the fabrication of ZnO nanoparticles onto polyimide surfaces can decrease the tendency of nanoparticle aggregation and improve the dispersity of ZnO nanoparticles. Thus the technique of incorporating ZnO in PI can at least combine two ways including modifying by organics and reducing particle size to improve the photocatalytic efficiency of ZnO.
Conventional methods for fabricating PI/metal oxide nanocomposites mainly focused on external deposition process, such as directly depositing metal phase onto PI substrate,28–31 directly incorporating an appropriate metal salt into the PI precursor and further oxidizing the metal salt to generate metal oxide nanoparticles in situ in the PI matrix.32,33 However, these processes often lead to inhomogeneous agglomeration of the ZnO nanoparticles in polymer matrix and usually cannot make full use of the functional properties of metal oxide particles remained in the matrix. Recently, ion-exchange technique to prepare PI/metal oxide nanocomposites has been developed.34–38 This method comprises the surface hydrolysis of PI film in alkali solution resulting in the cleavage of the imide rings and the formation of carboxylic acid groups, subsequent loading of metal ions through the ion exchange of the carboxyl group with the metal cations in the inorganic metal salt solution, and final oxidization of metal cations to metal oxide particles in the surface of the PI matrix. The major advantage of ion-exchange technique lies in that the nano-layer metal oxide is easy to fabricate by the controlling of the size, thickness and distribution of the metal oxide nanoparticle. Another advantage is that altering distribution of the mixed metal ion in vertical and horizontal PI matrix via ion exchange reaction can easily obtain heterostructured metal oxides on the surface of PI. So, in a way, this ion-exchange technique can be extended to synthesizing heterostructured nano-ZnO dispersed in PI surface layers, which combined aforementioned three approaches to modify ZnO.
NiO is a p-type semiconductor (Eg = 3.5 eV) with rock salt or cubic structure, which can form p–n heterojunctions with ZnO and thereby minimize e/h+ recombination.39 Fe2O3 is a narrow band gap (1.9–2.2 eV) semiconductor which is suitable to be coupled with ZnO to enhance the separation of photo-generated electron–hole pairs in ZnO.40 Combined with the different band gap of NiO and Fe2O3, we expected to obtain heterostructured NiO–Fe2O3–ZnO with better photocatalytic activity, especially in visible light region. To our best knowledge, there are few reports on heterostructured NiO–Fe2O3–ZnO materials, specially, on PI/heterostructured NiO–Fe2O3–ZnO nanocomposites. Herein, we report the fabrication of heterostructured NiO–Fe2O3–ZnO layers on double surfaces of polyimide film via ion-exchange technique. Subsequently, the effects of initial Ni, Fe and Zn ion loading in different proportions on microstructural, thermal properties, mechanical properties and pollutant-catalyzed properties of the final composite films were studied.
2. Experimental
2.1. Materials
Polyimide (a-BPDA, s-BPDA, 4,4′-ODA and PDA) films with thickness of 50 μm were prepared by our laboratory. The PI films were rinsed by ultrasonic cleaning for 10 min in deionized water and dried in ambient environment prior to use. Zinc nitrate (Zn(NO3)2·6H2O), nickel nitrate (Ni(NO3)2·6HO2), ferrous nitrate (Fe(NO3)2·6HO2) and potassium hydroxide (KOH) was purchased from Shanghai Chemical Reagent Plant. All chemicals were analytical grade and used without further purification.2.2. Preparation of composite films
The procedures for preparing PI/heterostructured NiO–Fe2O3–ZnO nanocomposite films are illustrated in Scheme 1. First, PI films were treated by 2 mol L−1 aqueous KOH solution at 50 °C for 6 h to perform alkaline-induced hydrolysis, and then washed with deionized water and blown dry with air. The surface modified films were next immersed into Zn(NO3)2, Ni(NO3)2 and Fe(NO3)2 mixed solution (0.1 mol L−1 Zn(NO3)2, Zn![[thin space (1/6-em)]](https://www.rsc.org/images/entities/char_2009.gif) :
:![[thin space (1/6-em)]](https://www.rsc.org/images/entities/char_2009.gif) Ni
Ni![[thin space (1/6-em)]](https://www.rsc.org/images/entities/char_2009.gif) :
:![[thin space (1/6-em)]](https://www.rsc.org/images/entities/char_2009.gif) Fe = 1
Fe = 1![[thin space (1/6-em)]](https://www.rsc.org/images/entities/char_2009.gif) :
:![[thin space (1/6-em)]](https://www.rsc.org/images/entities/char_2009.gif) 0
0![[thin space (1/6-em)]](https://www.rsc.org/images/entities/char_2009.gif) :
:![[thin space (1/6-em)]](https://www.rsc.org/images/entities/char_2009.gif) 0, 2
0, 2![[thin space (1/6-em)]](https://www.rsc.org/images/entities/char_2009.gif) :
:![[thin space (1/6-em)]](https://www.rsc.org/images/entities/char_2009.gif) 1
1![[thin space (1/6-em)]](https://www.rsc.org/images/entities/char_2009.gif) :
:![[thin space (1/6-em)]](https://www.rsc.org/images/entities/char_2009.gif) 1, 4
1, 4![[thin space (1/6-em)]](https://www.rsc.org/images/entities/char_2009.gif) :
:![[thin space (1/6-em)]](https://www.rsc.org/images/entities/char_2009.gif) 1
1![[thin space (1/6-em)]](https://www.rsc.org/images/entities/char_2009.gif) :
:![[thin space (1/6-em)]](https://www.rsc.org/images/entities/char_2009.gif) 1,6
1,6![[thin space (1/6-em)]](https://www.rsc.org/images/entities/char_2009.gif) :
:![[thin space (1/6-em)]](https://www.rsc.org/images/entities/char_2009.gif) 1
1![[thin space (1/6-em)]](https://www.rsc.org/images/entities/char_2009.gif) :
:![[thin space (1/6-em)]](https://www.rsc.org/images/entities/char_2009.gif) 1 and 9
1 and 9![[thin space (1/6-em)]](https://www.rsc.org/images/entities/char_2009.gif) :
:![[thin space (1/6-em)]](https://www.rsc.org/images/entities/char_2009.gif) 1
1![[thin space (1/6-em)]](https://www.rsc.org/images/entities/char_2009.gif) :
:![[thin space (1/6-em)]](https://www.rsc.org/images/entities/char_2009.gif) 1, molar ratio) at room temperature for 4 h under the batch ultrasonic condition to incorporate Zn, Ni and Fe ions into the films through an ion-exchange reaction between potassium and Zn, Ni and Fe ions. After ion exchange, the films were rinsed by deionized water to remove the surface residual mixed solution and dried in ambient atmosphere. Finally, the precursor films were reimidized by slowly heating to 410 °C within 3 h in a forced air oven and were kept at 410 °C for 4.5 h. According to this method, the PI/heterostructured NiO–Fe2O3–ZnO nanocomposite films with different molar ratios of 1
1, molar ratio) at room temperature for 4 h under the batch ultrasonic condition to incorporate Zn, Ni and Fe ions into the films through an ion-exchange reaction between potassium and Zn, Ni and Fe ions. After ion exchange, the films were rinsed by deionized water to remove the surface residual mixed solution and dried in ambient atmosphere. Finally, the precursor films were reimidized by slowly heating to 410 °C within 3 h in a forced air oven and were kept at 410 °C for 4.5 h. According to this method, the PI/heterostructured NiO–Fe2O3–ZnO nanocomposite films with different molar ratios of 1![[thin space (1/6-em)]](https://www.rsc.org/images/entities/char_2009.gif) :
:![[thin space (1/6-em)]](https://www.rsc.org/images/entities/char_2009.gif) 0
0![[thin space (1/6-em)]](https://www.rsc.org/images/entities/char_2009.gif) :
:![[thin space (1/6-em)]](https://www.rsc.org/images/entities/char_2009.gif) 0, 9
0, 9![[thin space (1/6-em)]](https://www.rsc.org/images/entities/char_2009.gif) :
:![[thin space (1/6-em)]](https://www.rsc.org/images/entities/char_2009.gif) 1
1![[thin space (1/6-em)]](https://www.rsc.org/images/entities/char_2009.gif) :
:![[thin space (1/6-em)]](https://www.rsc.org/images/entities/char_2009.gif) 1, 6
1, 6![[thin space (1/6-em)]](https://www.rsc.org/images/entities/char_2009.gif) :
:![[thin space (1/6-em)]](https://www.rsc.org/images/entities/char_2009.gif) 1
1![[thin space (1/6-em)]](https://www.rsc.org/images/entities/char_2009.gif) :
:![[thin space (1/6-em)]](https://www.rsc.org/images/entities/char_2009.gif) 1,4
1,4![[thin space (1/6-em)]](https://www.rsc.org/images/entities/char_2009.gif) :
:![[thin space (1/6-em)]](https://www.rsc.org/images/entities/char_2009.gif) 1
1![[thin space (1/6-em)]](https://www.rsc.org/images/entities/char_2009.gif) :
:![[thin space (1/6-em)]](https://www.rsc.org/images/entities/char_2009.gif) 1 and 2
1 and 2![[thin space (1/6-em)]](https://www.rsc.org/images/entities/char_2009.gif) :
:![[thin space (1/6-em)]](https://www.rsc.org/images/entities/char_2009.gif) 1
1![[thin space (1/6-em)]](https://www.rsc.org/images/entities/char_2009.gif) :
:![[thin space (1/6-em)]](https://www.rsc.org/images/entities/char_2009.gif) 1 have been synthesized and named as PZNF-0, PZNF-1, PZNF-2, PZNF-3 and PZNF-4 (all are called PZNF-x).
1 have been synthesized and named as PZNF-0, PZNF-1, PZNF-2, PZNF-3 and PZNF-4 (all are called PZNF-x).
2.3. Characterization
The crystal structure and composition phase were analyzed by X-ray diffraction (XRD, Cu Kα, 40 kV, 100 mA, Xpert MPD Pro). Chemical structure information of polyimide films and nanocomposite films was collected using Infrared measurements (Version BM Spectrometer). The surface morphologies of nanocomposite films were determined by a field emission scanning electron microscopy (FE-SEM, Ultra 55) and atomic force microscopy (AFM, SPI3800N). X-ray photoelectron spectroscopy (XPS) data were also obtained to analysis surface chemical composition using an XSAM-800 spectrometer with Al Kα radiation (hν = 1486.60 eV, Kratos). Thermo gravimetric (TG) analyses of the samples were performed with a TA Instrument SDT Q600 in a nitrogen atmosphere at a heating rate of 10 °C min−1. UV-vis absorption spectra were recorded on a UV-3150 spectrophotometer equipped with an integrating sphere attachment. Tensile properties were determined from stress–strain curves with a Toyo Instron UTM-III-500 with a load cell of 10 kg at a drawing speed of 5 cm min−1.2.4. Photocatalytic degradation experiments
Photocatalytic degradation experiments were carried out in a customized reactor with a cooling-water-cycle system, and the reaction temperature of the aqueous solution was maintained at 25 °C. A 300 W Xe lamp was employed as the exciting light source for simulated solar light irradiation. The photocatalytic activities were estimated by the degradation of methyl orange and 2-nitrophenol (5 × 10⁻⁵ M) solution. In each experiment, the pure PI and the PZNF-x nanocomposite films (300 mg) were added into 50 mL dye aqueous solution (5 × 10⁻⁵ mol L−1). Prior to irradiation, the dye aqueous solution was stirred in the dark for 60 min to ensure the establishment of an adsorption/desorption equilibrium. During the reaction process under light illumination, 3 mL of suspension was sampled at given time intervals, which was analyzed on a UV-vis spectrophotometer to record the concentration changes of dye solutions.The degradation rate (%) has been calculated as:
3. Results and discussion
3.1. XRD characterization
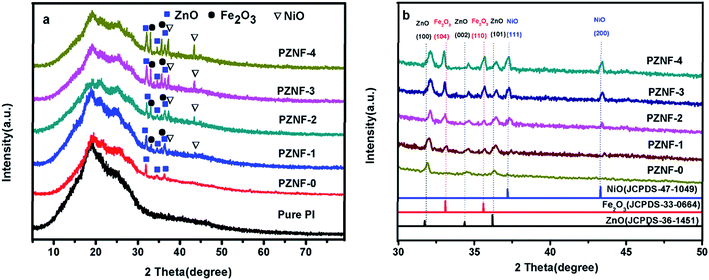
Fig. 1 displays the XRD patterns of pure PI and PZNF-x, respectively. It can be seen from Fig. 1a, compared to the XRD curve of pure PI, the additional diffraction peaks in PZNF-0 can be indexed to ZnO and the additional diffraction peaks in PZNF-1, PZNF-2, PZNF-3 and PZNF-4 can be indexed to ZnO, NiO and Fe2O3. Therefore, for PZNF-0, the XRD results indicate the formation of ZnO on the surface of PI, and for PZNF-1, PZNF-2, PZNF-3 and PZNF-4, the XRD results indicate the coexistence of ZnO, NiO and Fe2O3 on the surface of PI. Seen from Fig. 1b, the typical characteristic diffraction peaks located at 31.92, 34.50 and 36.32° in PZNF-0 are assigned to (100), (002) and (101) reflections of the hexagonal phase of ZnO. When comparing the XRD peaks of PZNF-0 sample to other PZNF-x samples, the XRD peaks of ZnO shift slightly to higher angles with increasing of Fe and Ni content. This phenomenon suggests that part Fe and Ni in NiO and Fe2O3 lattices have been entered into the ZnO lattices to form the heterostructure.39,40 When comparing the XRD peaks of PZNF-1, PZNF-2, PZNF-3 and PZNF-4, the intensity of XRD peaks of NiO and Fe2O3 increases with increasing of Fe and Ni content, which indicate that the PI/heterostructured NiO–Fe2O3–ZnO nanocomposite films of higher contents of Fe and Ni have more free NiO and Fe2O3 phase. Observed the XRD peaks of PZNF-1 and PZNF-2 (see Fig. 1b), there is a relative shift of the NiO (111), NiO (200) and Fe2O3 (104) diffraction peaks. This also confirms the formation of the heterostructure.3.2. Morphology analysis
Fig. 2 shows SEM images of pure PI and PZNF-x, respectively. It can be seen that, the reference pure PI is smooth without the detection of any particles as shown in Fig. 2a, while the mixed metal oxide/PI nanocomposite films show interesting morphologies of metal oxide particles stacking, as seen in Fig. 2b–f. It is presented in Fig. 2b that the surface of PZNF-0 is homogeneously covered with regular ZnO nanoparticles (20–30 nm), and these nanoparticles are loosely arranged together, a clear boundary between neighboring particles can be observed. Upon further treatment by Ni and Fe, the SEM images give very distinct change. When initial loading molar ratio of Zn, Ni and Fe ions reaching 9![[thin space (1/6-em)]](https://www.rsc.org/images/entities/char_2009.gif) :
:![[thin space (1/6-em)]](https://www.rsc.org/images/entities/char_2009.gif) 1
1![[thin space (1/6-em)]](https://www.rsc.org/images/entities/char_2009.gif) :
:![[thin space (1/6-em)]](https://www.rsc.org/images/entities/char_2009.gif) 1, it is shown the surface of PZNF-1 consists of irregular sized nanoparticles (15–25 nm) with very small amount of agglomeration (seen in Fig. 2c). Compared with PZNF-0, the nanoparticles are more densely packed together and interlink each other on the surface of PZNF-1, which are attributed to pile up effect by the different radius of NiO, Fe2O3, and ZnO nanoparticles. One can further find in the higher loading molar ratio of Zn, Ni and Fe ions that nanoparticles agglomerations intent to become more and bigger, and these spherical nanoparticles (15–25 nm) are connected to each other more closely and compactly (seen in Fig. 2d–f). Perhaps most impressively, it is seen form Fig. 2e that the mesh-shaped strips cover the whole surface of PZNF-3 and each nanoparticle is not completely covered by other nanoparticles. However, for PZNF-4, the mesh-shaped strips disappear, larger micro protrusions form, and a large amount of nanoparticles are completely encapsulated by outer nanoparticles (seen in Fig. 2f). The inconsistency in the morphology of PZNF-3 may be attributed to that the proper ratio of the different radius nanoparticles in PZNF-3 are just cross-linked, uncovered and become trips in a mesh-shaped morphology. In addition, from the surface morphologies of PZNF-1 to PZNF-4, it can be observed that NiO and Fe2O3 nanoparticles are found to assemble at the surface of ZnO crystals to form heterostructured NiO–Fe2O3–ZnO and the numbers of heterostructured NiO–Fe2O3–ZnO on the surface of PIZNNIFE-1 are less.
1, it is shown the surface of PZNF-1 consists of irregular sized nanoparticles (15–25 nm) with very small amount of agglomeration (seen in Fig. 2c). Compared with PZNF-0, the nanoparticles are more densely packed together and interlink each other on the surface of PZNF-1, which are attributed to pile up effect by the different radius of NiO, Fe2O3, and ZnO nanoparticles. One can further find in the higher loading molar ratio of Zn, Ni and Fe ions that nanoparticles agglomerations intent to become more and bigger, and these spherical nanoparticles (15–25 nm) are connected to each other more closely and compactly (seen in Fig. 2d–f). Perhaps most impressively, it is seen form Fig. 2e that the mesh-shaped strips cover the whole surface of PZNF-3 and each nanoparticle is not completely covered by other nanoparticles. However, for PZNF-4, the mesh-shaped strips disappear, larger micro protrusions form, and a large amount of nanoparticles are completely encapsulated by outer nanoparticles (seen in Fig. 2f). The inconsistency in the morphology of PZNF-3 may be attributed to that the proper ratio of the different radius nanoparticles in PZNF-3 are just cross-linked, uncovered and become trips in a mesh-shaped morphology. In addition, from the surface morphologies of PZNF-1 to PZNF-4, it can be observed that NiO and Fe2O3 nanoparticles are found to assemble at the surface of ZnO crystals to form heterostructured NiO–Fe2O3–ZnO and the numbers of heterostructured NiO–Fe2O3–ZnO on the surface of PIZNNIFE-1 are less.
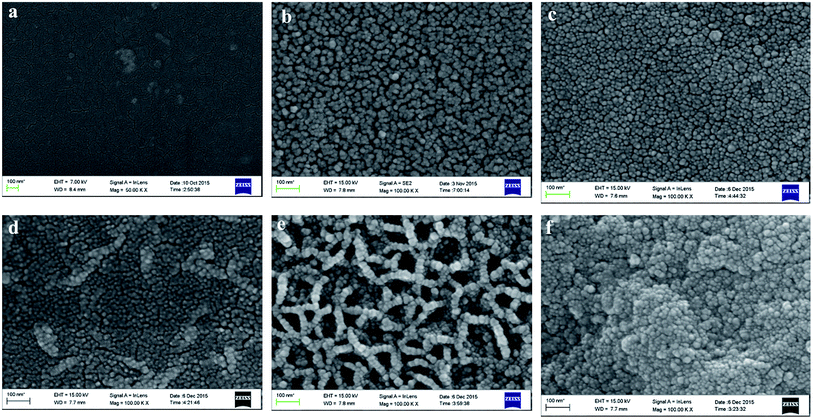 | ||
| Fig. 2 The SEM images of pure PI and PZNF-x: (a) pure PI, (b) PZNF-0, (c) PZNF-1, (d) PZNF-2, (e) PZNF-3 and (f) PZNF-4. | ||
In the mean time, AFM is introduced to further investigate the surface features of pure PI and PZNF-x as shown in Fig. 3. It can be seen that, the AFM surface morphologies of all these samples have the same trend with SEM images (seen in Fig. 3a–f). On the other hand, since the surface roughness played an important role for photocatalytic application of thin films, we used AFM to measure the surface average roughness (RMS). It is detected that for pure PI, the value of RMS is 8.9 nm. But for the PZNF-0 and PZNF-1 films, the values of RMS can reach 292 nm and 338 nm, respectively. This indicates that incorporating ZnO into PI substantially increases the surface average roughness and loading a small amount of NiO and Fe2O3 into ZnO/PI composite films can improve the surface average roughness. Additionally, the value of RMS of PZNF-2 to PZNF-4 is sequentially 161 nm, 179 nm and 233 nm, showing increase with the increase of the Ni, Fe proportion. These results indicate that the surface of composite films becomes flat with the increase of Zn, Ni and Fe proportion form 9![[thin space (1/6-em)]](https://www.rsc.org/images/entities/char_2009.gif) :
:![[thin space (1/6-em)]](https://www.rsc.org/images/entities/char_2009.gif) 1
1![[thin space (1/6-em)]](https://www.rsc.org/images/entities/char_2009.gif) :
:![[thin space (1/6-em)]](https://www.rsc.org/images/entities/char_2009.gif) 1 to 6
1 to 6![[thin space (1/6-em)]](https://www.rsc.org/images/entities/char_2009.gif) :
:![[thin space (1/6-em)]](https://www.rsc.org/images/entities/char_2009.gif) 1
1![[thin space (1/6-em)]](https://www.rsc.org/images/entities/char_2009.gif) :
:![[thin space (1/6-em)]](https://www.rsc.org/images/entities/char_2009.gif) 1, as a result of more close stacking of composite nanoparticles. And these also indicate that the larger and more micro protrusions are beneficial to form rougher surface.
1, as a result of more close stacking of composite nanoparticles. And these also indicate that the larger and more micro protrusions are beneficial to form rougher surface.
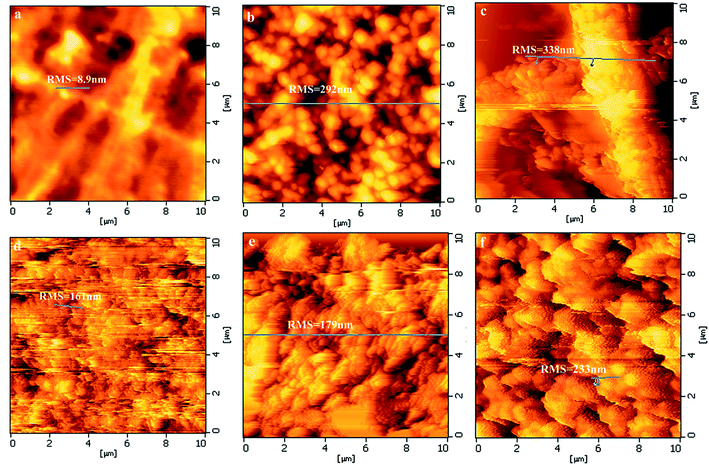 | ||
| Fig. 3 The AFM images and surface average roughnesses of pure PI and PZNF-x: (a) pure PI, (b) PZNF-0, (c) PZNF-1, (d) PZNF-2, (e) PZNF-3 and (f) PZNF-4. | ||
3.3. The XPS spectra analysis
Fig. 4 exhibits the XPS spectra of the pure PI and PZNF-x, respectively. From Fig. 4a, it can be clearly observed that the peaks of Zn, Fe, Ni, C and O exist in sample of PZNF-1, PZNF-2, PZNF-3 and PZNF-4, and only characteristic signals of Zn, C and O appear in PZNF-0. In contrast, only the peaks belonging to C, N and O exist in pure PI. The XPS surface atomic compositions for the pure PI and PIZNNIFE-x were displayed in Table 1.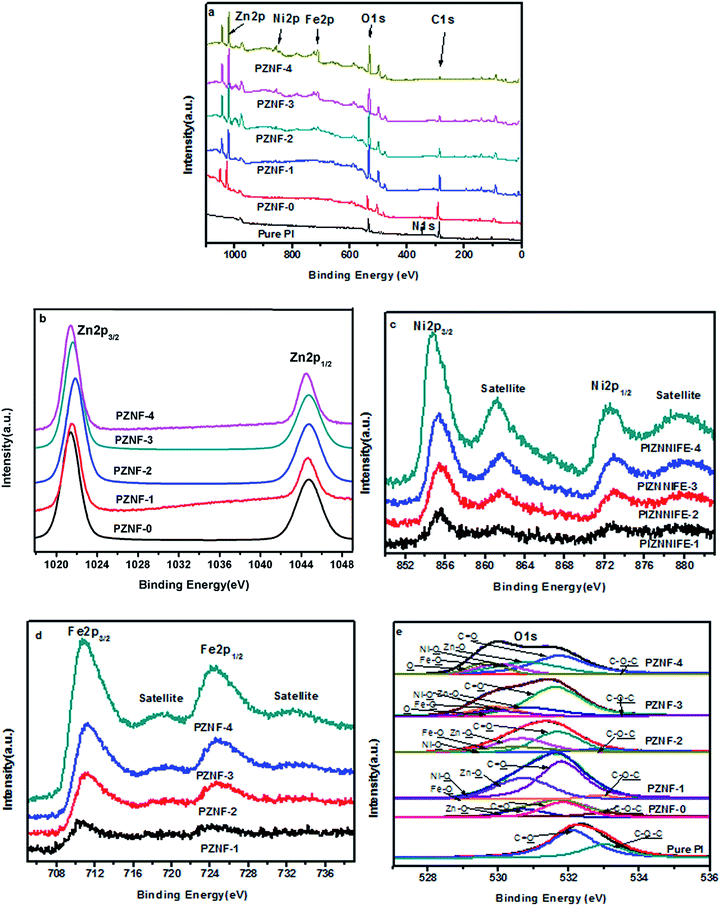 | ||
| Fig. 4 The XPS spectra of pure PI and PZNF-x including (a) a wide survey and (b)–(e) high-resolution spectra of Zn 2p, Ni 2p, Fe 2p and O 1s, respectively. | ||
| Samples | Atomic concentrations % | |||||
|---|---|---|---|---|---|---|
| Zn(2p) | Ni(2p) | Fe(2p) | O(1s) | C(1s) | N(1s) | |
| Pure PI | 0 | 0 | 0 | 25.58 | 70.29 | 4.13 |
| PZNF-0 | 9.81 | 0 | 0 | 39.44 | 50.74 | 0.1 |
| PZNF-1 | 8.15 | 0.85 | 0.92 | 42.48 | 47.60 | 0.08 |
| PZNF-2 | 9.23 | 1.46 | 1.59 | 44.79 | 42.86 | 0.07 |
| PZNF-3 | 10.17 | 2.39 | 2.72 | 59.05 | 25.63 | 0.04 |
| PZNF-4 | 10.59 | 5.02 | 5.94 | 62.15 | 16.18 | 0.02 |
As indicated, the calculated surface atomic ratios of Zn![[thin space (1/6-em)]](https://www.rsc.org/images/entities/char_2009.gif) :
:![[thin space (1/6-em)]](https://www.rsc.org/images/entities/char_2009.gif) Ni
Ni![[thin space (1/6-em)]](https://www.rsc.org/images/entities/char_2009.gif) :
:![[thin space (1/6-em)]](https://www.rsc.org/images/entities/char_2009.gif) Fe for the PZNF-1, PZNF-2, PZNF-3 and PZNF-4 are respectively 9
Fe for the PZNF-1, PZNF-2, PZNF-3 and PZNF-4 are respectively 9![[thin space (1/6-em)]](https://www.rsc.org/images/entities/char_2009.gif) :
:![[thin space (1/6-em)]](https://www.rsc.org/images/entities/char_2009.gif) 0.94
0.94![[thin space (1/6-em)]](https://www.rsc.org/images/entities/char_2009.gif) :
:![[thin space (1/6-em)]](https://www.rsc.org/images/entities/char_2009.gif) 1.02, 6
1.02, 6![[thin space (1/6-em)]](https://www.rsc.org/images/entities/char_2009.gif) :
:![[thin space (1/6-em)]](https://www.rsc.org/images/entities/char_2009.gif) 0.95
0.95![[thin space (1/6-em)]](https://www.rsc.org/images/entities/char_2009.gif) :
:![[thin space (1/6-em)]](https://www.rsc.org/images/entities/char_2009.gif) 1.03, 4
1.03, 4![[thin space (1/6-em)]](https://www.rsc.org/images/entities/char_2009.gif) :
:![[thin space (1/6-em)]](https://www.rsc.org/images/entities/char_2009.gif) 0.94
0.94![[thin space (1/6-em)]](https://www.rsc.org/images/entities/char_2009.gif) :
:![[thin space (1/6-em)]](https://www.rsc.org/images/entities/char_2009.gif) 1.07 and 2
1.07 and 2![[thin space (1/6-em)]](https://www.rsc.org/images/entities/char_2009.gif) :
:![[thin space (1/6-em)]](https://www.rsc.org/images/entities/char_2009.gif) 0.95
0.95![[thin space (1/6-em)]](https://www.rsc.org/images/entities/char_2009.gif) :
:![[thin space (1/6-em)]](https://www.rsc.org/images/entities/char_2009.gif) 1.12, which are close to the prepared molar ratio of Zn
1.12, which are close to the prepared molar ratio of Zn![[thin space (1/6-em)]](https://www.rsc.org/images/entities/char_2009.gif) :
:![[thin space (1/6-em)]](https://www.rsc.org/images/entities/char_2009.gif) Ni
Ni![[thin space (1/6-em)]](https://www.rsc.org/images/entities/char_2009.gif) :
:![[thin space (1/6-em)]](https://www.rsc.org/images/entities/char_2009.gif) Fe. It can also be found from Table 1, the carbon concentration decreases with the increase of Zn, Ni and Fe proportion, which confirms the initial findings of SEMs that those nanoparticle agglomerations are intent to become more and larger in the higher loading molar ratio of Zn, Ni and Fe, and resulting in covering the PI.
Fe. It can also be found from Table 1, the carbon concentration decreases with the increase of Zn, Ni and Fe proportion, which confirms the initial findings of SEMs that those nanoparticle agglomerations are intent to become more and larger in the higher loading molar ratio of Zn, Ni and Fe, and resulting in covering the PI.
The high resolution XPS spectra Zn 2p spectra for the PZNF-x films were shown in Fig. 4b. The binding energies presented at 1021.5 and 1044.8 eV belong to Zn 2p3/2 and Zn 3p1/2, respectively, which agree with the reference value for Zn2+ and are identical to the reported of related ZnO systems.41 The high resolution XPS spectra Ni 2p and Fe 2p spectra for PZNF-1, PZNF-2, PZNF-3 and PZNF-4 films were shown in Fig. 4c and d. The typical signals of Ni2+ 2p1/2 (872.6 eV) and 2p3/2 (854.8 eV) are observed in study samples (Fig. 4c), as well as the typical shakeup satellites peaks located at ca. 879.5 eV and 861.6 eV.42 The peaks located at 711.2 and 724.9 eV in Fig. 4d are attributed to the Fe 2p3/2 and Fe 2p1/2, respectively.43 Moreover, two satellite peaks at 718.9 and 733.1 eV are detected. Based on the above results, it's demonstrated the Fe in the PI/heterostructured NiO–Fe2O3–ZnO nanocomposite films is +3 valence states.44 High resolution XPS spectra of O 1s for pure PI and the PZNF-x are shown in Fig. 4e. To determine the binding states of oxygen in samples, the O 1s XPS peaks have been fitted to six deconvoluted peaks. The peaks at 533.08 and 531.82 eV are due to the ether (C–O–C) and imide functionalities (C![[double bond, length as m-dash]](https://www.rsc.org/images/entities/char_e001.gif) O) of PI, respectively.36 The peak at 530.70, 530.40 and 530.30 eV corresponds to the oxygen species in the ZnO,45 NiO46 and Fe2O3,13 respectively. XPS peak at 529.6 eV is associated with absorbed oxygen which may be favorable to the oxidation of organics. As for the pure PI, the binding state of O 1s core-level electrons can be resolved to C–O–C and C
O) of PI, respectively.36 The peak at 530.70, 530.40 and 530.30 eV corresponds to the oxygen species in the ZnO,45 NiO46 and Fe2O3,13 respectively. XPS peak at 529.6 eV is associated with absorbed oxygen which may be favorable to the oxidation of organics. As for the pure PI, the binding state of O 1s core-level electrons can be resolved to C–O–C and C![[double bond, length as m-dash]](https://www.rsc.org/images/entities/char_e001.gif) O. As for the PZNF-0, the binding state of O 1s core-level electrons can be resolved to C–O–C, C
O. As for the PZNF-0, the binding state of O 1s core-level electrons can be resolved to C–O–C, C![[double bond, length as m-dash]](https://www.rsc.org/images/entities/char_e001.gif) O and Zn–O, which indicates that ZnO forms on the PI film surface. It can be also finding from Fig. 3e that Zn–O, Ni–O and Fe–O form on the surface of PZNF-1, PZNF-2, PZNF-3 and PZNF-4 films. Most noteworthy, there is absorbed oxygen in PZNF-3 and PZNF-4 films as a result of the formation of special surface shapes.
O and Zn–O, which indicates that ZnO forms on the PI film surface. It can be also finding from Fig. 3e that Zn–O, Ni–O and Fe–O form on the surface of PZNF-1, PZNF-2, PZNF-3 and PZNF-4 films. Most noteworthy, there is absorbed oxygen in PZNF-3 and PZNF-4 films as a result of the formation of special surface shapes.
3.4. The FTIR spectra analysis
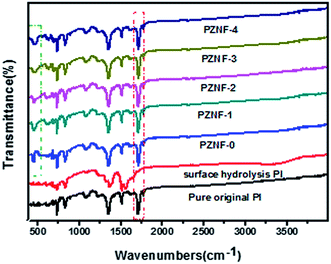
Fig. 5 exhibits the FTIR spectra of the pure original PI, surface hydrolysis PI and PZNF-x, respectively.As shown in Fig. 5, the strong absorbance peaks of pure original PI at 1714, 1776, and 1354 cm−1 are clearly visible, which represent the symmetric carbonyl (C![[double bond, length as m-dash]](https://www.rsc.org/images/entities/char_e001.gif) O) stretching, asymmetric carbonyl stretching and imide ring C–N stretching, respectively. After the film were treated by KOH, above peaks are weaken and diminish strongly. And two new peaks at 1658 cm−1 (amide I; carbonyl stretching) and 1544 cm−1 (amide II; coupling of C–N stretch and N–H deformation) appear. This result is attributed to the hydrolytic cleavage of the imide groups contained in the repeating unit of PI. The FT-IR also shows broad peaks centered at 3445 cm−1, ascribed to basic hydroxyl groups. After thermal curing and forming nanocomposite PI films, the absorbance peaks arising from imide ring peaks at 1714, 1776, and 1354 cm−1 appear again. This indicates that the already opened imide ring has reformed under this experimental condition. Besides, the broad absorption band 400–600 cm−1 in PZNF-x is in response to the metal–oxygen modes and confirms the formation of metal oxide on the surface of PI. The FT-IR spectrum of PZNF-0 shows a characteristic absorption peak of Zn–O bond stretching vibrations located in the range of 434–475 cm−1.47 The new characteristic absorption peak of Fe2O3 at 550 cm−1 in the FTIR spectra of PZNF-3 and PZNF-4 indicate that Fe2O3 exist on the surface of PI.10 The existence of shift and broadening of Zn–O absorption peak for PZNF-1, PZNF-2, PZNF-3 and PZNF-4 further support the formation of the heterostructured NiO–Fe2O3–ZnO.
O) stretching, asymmetric carbonyl stretching and imide ring C–N stretching, respectively. After the film were treated by KOH, above peaks are weaken and diminish strongly. And two new peaks at 1658 cm−1 (amide I; carbonyl stretching) and 1544 cm−1 (amide II; coupling of C–N stretch and N–H deformation) appear. This result is attributed to the hydrolytic cleavage of the imide groups contained in the repeating unit of PI. The FT-IR also shows broad peaks centered at 3445 cm−1, ascribed to basic hydroxyl groups. After thermal curing and forming nanocomposite PI films, the absorbance peaks arising from imide ring peaks at 1714, 1776, and 1354 cm−1 appear again. This indicates that the already opened imide ring has reformed under this experimental condition. Besides, the broad absorption band 400–600 cm−1 in PZNF-x is in response to the metal–oxygen modes and confirms the formation of metal oxide on the surface of PI. The FT-IR spectrum of PZNF-0 shows a characteristic absorption peak of Zn–O bond stretching vibrations located in the range of 434–475 cm−1.47 The new characteristic absorption peak of Fe2O3 at 550 cm−1 in the FTIR spectra of PZNF-3 and PZNF-4 indicate that Fe2O3 exist on the surface of PI.10 The existence of shift and broadening of Zn–O absorption peak for PZNF-1, PZNF-2, PZNF-3 and PZNF-4 further support the formation of the heterostructured NiO–Fe2O3–ZnO.
3.5. The UV-visible absorption spectra analysis
Fig. 6 depicts the UV-visible absorption spectra of ZnO, pure PI and PZNF-x, respectively. It can be seen that the pure ZnO can only absorb UV light (λ < 400 nm) because of its wide band gap (3.4 eV), and the pure PI has only broad adsorption in the UV wavelength region below 450 nm due to its delocalized p-electrons. However, despite weak adsorption in the visible wavelength region (λ > 500 nm) of pure PI and pure ZnO, the ZnO/PI nanocomposite film (PZNF-0) shows very broad absorption bands covering the visible region of 400–600 nm as reported in other literature.48 Moreover, the PZNF-0 exhibits a strong absorption for UV light, when compared with pure PI and pure ZnO. It is expected to have a positive impact on enhancing its photocatalytic properties and utilizing sunlight. The extended visible light response range of PZNF-0 is possibly a result of the formation of ZnO/PI surface complex. As compared to the spectrum of pure PI/ZnO nanocomposite film (PZNF-0), the PI/heterostructured NiO–Fe2O3–ZnO nanocomposite films (PZNF-1, PZNF-2, PZNF-3 and PZNF-4) show wider visible absorption bands with the increase of the Ni and Fe contents (400–630 nm for PZNF-1, 400–650 nm for PZNF-2, 400–720 nm for PZNF-3 and 400–740 nm for PZNF-4 respectively). These results suggest that the PI/heterostructured NiO–Fe2O3–ZnO nanocomposite films have potential for photocatalysis using the visible part of the spectrum. This wide visible-light photo absorption of NiO–Fe2O3–ZnO may be ascribed to the vectorial transfer of induced electron and hole among the three semiconductors.18 The band gap energies of photocatalysts can be estimated by the Kubelka–Munk theory. In this study, (αhν)n (n = 1/2) vs. hν of the materials were plotted in Fig. 6b. We find that the calculated energy gap for ZnO, pure PI, PZNF-0, PZNF-1, PZNF-2, PZNF-3 and PZNF-4 is about 3.22, 2.73, 1.76, 1.66,1.62,1.47 and 1.40 eV, respectively. These results indicating that the PI and NiO–Fe2O3 could influence the light absorption abilities, the band structures, and therefore the following photocatalytic activities of the ZnO photocatalysts toward dye pollutant decomposition.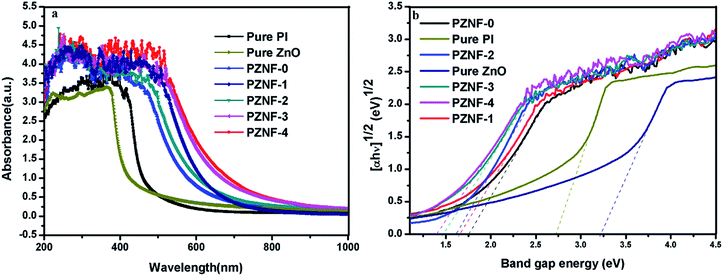 | ||
| Fig. 6 (a) The UV-visible absorption spectra of ZnO, pure PI and PZNF-x (b) plots of (αhν)1/2 vs. photon energy (hν) for the band gap energies of ZnO, pure PI and PZNF-x. | ||
3.6. Mechanical properties
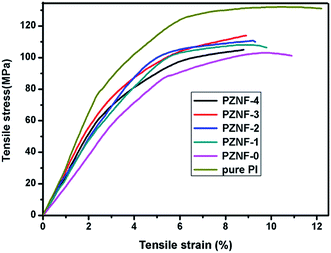
Typical stress–strain curves of pure PI and PZNF-x are illustrated in Fig. 7 and the corresponding data are summarized in Table 2. Compared with the pure PI, the tensile strengths and the elongations at break of PZNF-x had slightly decreased, which are the results of alkaline-induced hydrolysis of PI substrates in PZNF-x. Compared with the pure PZNF-0, from the table, we can see the noticeable trends of tensile strength of PZNF-x except PZNF-4 increased when increasing the NiO–Fe2O3 content, while the tensile elongation decreased. These trends can be mainly attributed to the rigid particles strengthen the PI matrix and reduce the flexibility. The tensile strength of PZNF-3 being greatest among PZNF-x can be explained by the rigid particles on the PZNF-3 surface possessing strongest interactions as results of the network morphology formation.| Samples | 23 °C tensile properties | |
|---|---|---|
| Strength (MPa) | Elongation (%) | |
| Pure PI | 132 | 12.2 |
| PZNF-0 | 103 | 10.9 |
| PZNF-1 | 108 | 9.8 |
| PZNF-2 | 111 | 9.3 |
| PZNF-3 | 114 | 8.9 |
| PZNF-4 | 105 | 8.8 |
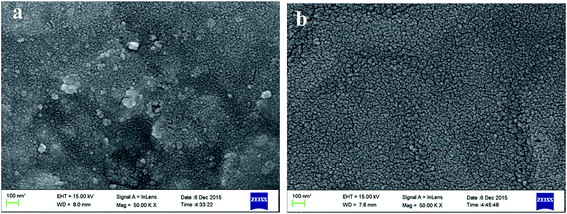
To evaluate the adhesion between the surface particles and PI matrix, ordinary commercial adhesive tape was adhered to the surface of samples and then was peeled off from it. Fig. 8 shows the SEM surface images of the PZNF-1 before and after peeling test. After the peeling test (Fig. 8b), although some agglomerates on the surface of PZNF-1 are drawn away from surface, yet the overall morphologies before and after the peeling are no obvious difference, which indicate the adhesion between PI matrix and nanoparticle layers is strong. Therefore, the maintained mechanical properties and strong adhesion make nanocomposite films superior over nanoparticles in water purification.
3.7. Photocatalytic activities
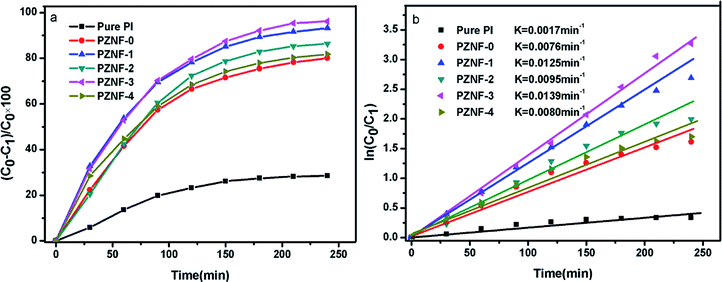
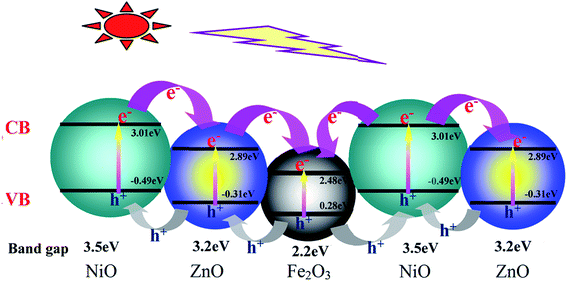
The model reaction for methyl orange photodegradation was carried out to evaluate the photocatalytic performance of pure PI and the PZNF-x under simulated solar light irradiation. Clearly, as displayed in Fig. 10a, about 28.5% methyl orange over pure PI was degraded after 240 min simulated solar light irradiation. Notably, PZNF-x showed enhanced photocatalytic activity for methyl orange degradation. From the degradation curves of Fig. 9a, it can be seen that the degradation rates of PZNF-0, PZNF-1, PZNF-2, PZNF-3 and PZNF-4 toward methyl orange after 240 min simulated solar light irradiation are about 80.1%, 93.2%, 86.4%, 96.2% and 81.8%, respectively. As compared to the PI/ZnO nanocomposite film, the PI/heterostructured NiO–Fe2O3–ZnO nanocomposite films exhibits higher photocatalytic activity, which may be attributed to (1) the enhanced visible light absorbance of the PI/heterostructured NiO–Fe2O3–ZnO as evidence in UV-visible absorption spectra (Fig. 6) and (2) the higher conduction band position and the lower valence bond of position semiconductor oxide among heterostructured NiO–Fe2O3–ZnO making interface charges easy transfer18 (as proposed in Scheme 2), it will efficiently hinder the recombination of photogenerated electron–hole pairs and considerably enhance the photocatalytic activity.To understand the electrons holes separation mechanism, the valence band (VB) and conduction band (CB) potentials of NiO, Fe2O3 and ZnO were calculated from the following empirical equations:
In addition, the morphology of the catalyst is a vital factor in the photocatalytic process since the catalytic reaction mainly occurs at their interface. Owing to special surface morphology of the PZNF-3 (seen in Fig. 2e), the hetero junction area of NiO–Fe2O3–ZnO obtained an optimum value and more electron–hole pairs will separate under illumination, which is beneficial to degrading the organic dyes. While for PZNF-4, more aggregation of particles on the ZnO surface leads to a decrease in the effective surface area of heterostructured NiO–Fe2O3–ZnO, and hence reduces the degradation rate to 81.8% (slightly higher than PZNF-0).
The methyl orange photodegradation over pure PI and the PZNF-x follows the first-order kinetics model (Fig. 9b). The first-order kinetics can be expressed by ln(C0/C1) = Kt, where K is the degradation rate constant. The values of K can be calculated from the slope and the intercept of the linear plot. The K values of methyl orange over pure PI, PZNF-0, PZNF-1, PZNF-2, PZNF-3 and PZNF-4 were about 0.0017, 0.0076, 0.0125, 0.0095, 0.0139 and 0.0080 min−1, respectively.
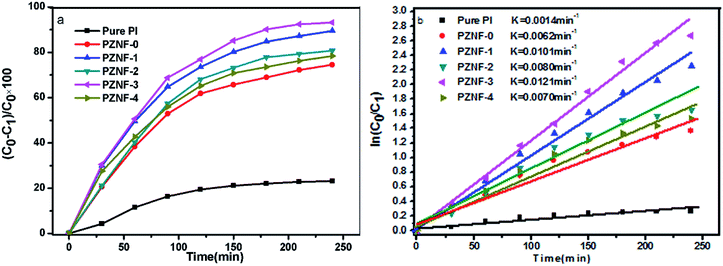
To avoid methyl orange photosensitization, the photocatalytic activity of pure PI film and the PIZNNIFE-x for degrading other colorless 2-nitrophenol was also performed under simulated solar irradiation. It can be seen from Fig. 10a that the PZNF-x also shows high photocatalytic efficiency for removing 2-nitrophenol and the PI/heterostructured NiO–Fe2O3–ZnO nanocomposite films exhibit the same photocatalytic regularity as degrading methyl orange. Moreover, 93.1% 2-nitrophenol photocatalytic degradation rate over the PZNF-3 was obtained under 240 min simulated solar light irradiation, which indicated that the PZNF-3 could also effectively photo-degrade other colorless organic pollutant. The larger methyl orange photocatalytic degradation rate than 2-nitrophenol under the identical condition was the result of methyl orange photosensitization promoting the photocatalytic degradation. Furthermore, it is found from that Fig. 10b that the K values of 2-nitrophenol over pure PI, PZNF-0, PZNF-1, PZNF-2, PZNF-3 and PZNF-4 are about 0.0014, 0.0062, 0.0101, 0.0080, 0.0121 and 0.0070 min−1, respectively.
3.8. The mechanical stability and recyclability
The mechanical stability and recyclability of the as-prepared PZNF-3 were evaluated by repeating methyl orange degradation after wear test at several times. Wear test in this work was that a sheet of M40 emery paper with a heavy object (100 g) was put on the surface of PZNF-3 and the emery paper was dragged back and forth three times. Before each repeating experiment, the as-prepared PZNF-3 went through the wear test and was ultrasonically cleaned with deionised water. The photocatalytic decomposition of methyl orange was displayed in Fig. 11. As shown in Fig. 11, we can clearly see that the photocatalytic degraded rate of methyl orange over the PZNF-3 is no obvious decline even after seven cycles. The results demonstrate that the mechanical durability of the PZNF-3 is outstanding, PI has good oxidation resistance and the as-fabricated nanocomposite film is considerably stable.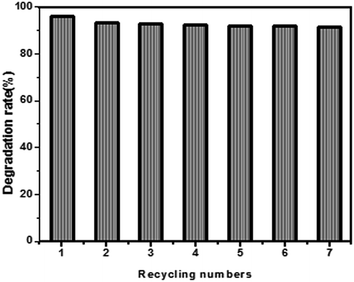 | ||
| Fig. 11 The recycling numbers for photocatalytic decomposition of methyl orange with PZNF-3 after wear test under simulated solar light irradiation. | ||
4. Conclusion
A series of NiO–Fe2O3–ZnO layers on double surfaces of polyimide film have been fabricated by direct ion exchange technique. The results confirmed the formation of PI/heterostructured NiO–Fe2O3–ZnO nanocomposite films. The obtained PI/heterostructured NiO–Fe2O3–ZnO nanocomposites possessed notable advantages. (1) The heterostructured NiO–Fe2O3–ZnO nanoparticles (20–30 nm) were dispersed uniformly on the PI surface, which could make full use of the functional properties of all metal oxide nanoparticles. (2) The large conjugated aromatic structure of PI and the vectorial transfer of induced electron and hole among the three semiconductors endowed PI/heterostructured NiO–Fe2O3–ZnO nanocomposites wider visible absorption (400–740 nm) and higher photocatalytic efficiency. (3) The PI/NiO–Fe2O3–ZnO nanocomposite films exhibited excellent mechanical properties and acceptable adhesion, which can overcome the problems of ZnO particles being difficult to reclaim. This study introduces a potential novel family of sunlight active photocatalysts for degradation of organic pollution.Conflicts of interest
There are no conflicts to declare.Acknowledgements
This work was supported by National science and technology support program (2014BAB15B02) and Engineering research center of biomass materials, Ministry of education, China (Grant No. 14tdsc03).References
- H. Tong, S. Ouyang, Y. Bi, N. Umezawa, M. Oshikiri and J. Ye, Adv. Mater., 2012, 24, 229–251 CrossRef CAS PubMed
.
- W. L. Ong, S. Natarajan, B. Kloostra and G. W. Ho, Nanoscale, 2013, 5, 5568–5573 RSC
.
- R. Saravana, E. Thirumal, V. K. Gupta, V. Narayanan and A. Stephen, J. Mol. Liq., 2013, 177, 394–401 CrossRef
.
- S. Lan, L. Liu, R. Li, Z. Leng and S. Gan, Ind. Eng. Chem. Res., 2014, 53, 3131–3139 CrossRef CAS
.
- C. Gomez-Solís, J. C. Ballesteros, L. M. Torres-Martínez, I. Juárez-Ramírez, L. A. Díaz-Torres, M. E. Zarazua-Morin and S. W. Lee, J. Photochem. Photobiol., A, 2015, 298, 49–54 CrossRef
.
- L. Soto-Vázquez, M. Cotto, C. Morant, J. Duconge and F. Márquez, J. Photochem. Photobiol., A, 2017, 332, 331–336 CrossRef
.
- R. Mariappan, V. Ponnuswamy, P. Suresh, R. Suresh, M. Ragavendar and A. C. Bose, J. Alloys Compd., 2014, 588, 170–176 CrossRef CAS
.
- H. Fallah, M. A. Zanjanchi and A. F. Shojaie, Mater. Chem. Phys., 2013, 139, 856–864 CrossRef
.
- C. Abed, C. Bouzidi, H. Elhouichet, B. Gelloz and M. Ferid, Appl. Surf. Sci., 2015, 349, 855–863 CrossRef CAS
.
- H. R. Mardani, M. Forouzani, M. Ziari and P. Biparva, Spectrochim. Acta, Part A, 2015, 141, 27–33 CrossRef CAS PubMed
.
- Ş. Ş. Türkyılmaz, N. Güy and M. Özacar, J. Photochem. Photobiol., A, 2017, 341, 39–50 CrossRef
.
- Q. Ding, Y. Miao and T. Liu, ACS Appl. Mater. Interfaces, 2013, 5, 5617–5622 CAS
.
- C. Wang, X. Tan, J. Yan, B. Chai, J. Li and S. Chen, Appl. Surf. Sci., 2017, 396, 780–790 CrossRef CAS
.
- M. Qasim, K. Asghar, B. R. Singh, S. Prathapani, W. Khan, A. H. Naqvi and D. Das, Spectrochim. Acta, Part A, 2015, 137, 1348–1356 CrossRef CAS PubMed
.
- M. Bahrami and A. Nezamzadeh-Ejhieh, Mater. Sci. Semicond. Process., 2014, 27, 833–840 CrossRef CAS
.
- N. Su, P. Lv, M. Li, X. Zhang, M. Li and J. Niu, Mater. Lett., 2014, 122, 201–204 CrossRef CAS
.
- N. Enjamuri, S. Hassan, A. Auroux, J. K. Pandey and B. Chowdhury, Appl. Catal., A, 2016, 523, 21–30 CrossRef CAS
.
- A. Hezam, K. Namratha, Q. A. Drmosh, Z. H. Yamani and K. Byrappa, Ceram. Int., 2017, 43, 5292–5301 CrossRef CAS
.
- N. M. Shooshtari and M. M. Ghazi, Chem. Eng. J., 2017, 315, 527–536 CrossRef CAS
.
- F. Achouri, S. Corbel, A. Aboulaich, L. Balan, A. Ghrabi, M. B. Said and R. Schneider, J. Phys. Chem. Solids, 2014, 75, 1081–1087 CrossRef CAS
.
- C. Luo, D. Li, W. Wu, C. Yua, W. Li and C. Pan, Appl. Catal., B, 2015, 166–167, 217–223 CrossRef CAS
.
- J. H. Park, J. H. Park, P. Biswas, D. K. Kwon, S. W. Han, H. K. Baik and J. M. Myoung, ACS Appl. Mater. Interfaces, 2016, 8, 11564–11574 CAS
.
- J. Lee, D. Bhattacharyya, A. J. Easteal and J. B. Metson, Curr. Appl. Phys., 2008, 8, 42–47 CrossRef
.
- Z. J. Chang, Chem. Commun., 2011, 47, 4427–4429 RSC
.
- Y. L. Lei, Y. J. Shu, J. H. Peng, Y. J. Tang and J. C. Huo, e-Polym., 2016, 16, 295–302 CAS
.
- Y. L. Lei, Y. J. Shu, J. H. Peng, Y. J. Tang and J. C. Huo, Polym. Sci., Ser. B, 2015, 57, 576–583 CrossRef CAS
.
- J. Y. Li, X. Jiang, L. Lin, J. J. Zhou, G. S. Xu and Y. P. Yuan, J. Mol. Catal. A: Chem., 2015, 406, 46–50 CrossRef CAS
.
- R. Murdey and J. T. Stuckless, J. Am. Chem. Soc., 2003, 125, 3995–3998 CrossRef CAS PubMed
.
- Y. S. Lin and H. M. Liu, Thin Solid Films, 2008, 516, 1773–1778 CrossRef CAS
.
- A. Somwangthanaroj, C. Phanthawonge, S. Ando and W. Tanthapanichakoon, J. Appl. Polym. Sci., 2008, 110, 1921–1928 CrossRef CAS
.
- T. Yan, M. Li, X. Wang, M. Sun, H. Liu, Q. Wei, W. Xu and B. Du, Appl. Surf. Sci., 2015, 340, 102–112 CrossRef CAS
.
- S. K. Lim, K. J. Chung, Y. H. Kim, C. K. Kim and C. S. Yoon, J. Colloid Interface Sci., 2004, 273, 517–522 CrossRef CAS PubMed
.
- S. C. Hsu, W. T. Whang, C. H. Hung, P. C. Chiang and Y. N. Hsiao, Macromol. Chem. Phys., 2005, 206, 291–298 CrossRef CAS
.
- S. Mu, Z. Wu, Y. Wang, S. Qi, X. Yang and D. Wu, Thin Solid Films, 2010, 518, 4175–4182 CrossRef CAS
.
- S. Mu, D. Wu, S. Qi and Z. Wu, J. Nanomater., 2011, 2011, 38–48 Search PubMed
.
- J. Zhan, G. Tian, S. Qi, Z. Wu, D. Wu and R. Jin, Compos. Sci. Technol., 2012, 72, 1020–1026 CrossRef CAS
.
- Q. Ding, Y. E. Miao and T. Liu, ACS Appl. Mater. Interfaces, 2013, 5, 5617–5622 CAS
.
- W. Liu, Z. Xu, D. Wu, Z. Wu and T. S. Hu, Mater. Lett., 2016, 177, 30–33 CrossRef CAS
.
- E. A. Rogozea, A. R. Petcu, N. L. Olteanu, C. A. Lazar, D. Cadar and M. Mihaly, Mater. Sci. Semicond. Process., 2017, 57, 1–11 CrossRef CAS
.
- S. Xia, Y. Meng, X. Zhou, J. Xue, G. Pan and Z. Ni, Appl. Catal., B, 2016, 187, 122–133 CrossRef CAS
.
- F. C. Romeiro, J. Z. Marinho, S. C. S. Lemos, A. P. deMoura, P. G. Freire, L. F. daSilva, E. Longo, R. A. A. Munoz and R. C. Lima, J. Solid State Chem., 2015, 230, 343–349 CrossRef CAS
.
- M. Zhong, Y. Li, M. Tariq, Y. Hu, W. Li, M. Zhu, H. Jin and Y. Li, J. Alloys Compd., 2016, 675, 286–291 CrossRef CAS
.
- L. Sun, R. Shao, L. Q. Tang and Z. D. Chen, J. Alloys Compd., 2013, 564, 55–62 CrossRef CAS
.
- X. Zhou, J. Y. Liu, C. Wang, P. Sun, X. L. Hu, X. W. Li, K. Shimanoe, N. Yamazoe and G. Y. Lu, Sens. Actuators, B, 2015, 206, 577–583 CrossRef CAS
.
- K. C. Barick, M. Aslam and D. Bahadur, J. Alloys Compd., 2014, 587, 282–286 CrossRef CAS
.
- M. S. Abdel-wahab, A. Jilani, I. S. Yahia and A. A. Al-Ghamdi, Superlattices Microstruct., 2016, 94, 108–118 CrossRef CAS
.
- J. H. Shen, G. Ma, J. M. Zhang, W. L. Quan and L. C. Li, Appl. Surf. Sci., 2015, 359, 455–468 CrossRef CAS
.
- S. Vural, S. Koytepe, T. Seckin and ī. Adıgüzel, Mater. Res. Bull., 2011, 46, 1679–1685 CrossRef CAS
.
| This journal is © The Royal Society of Chemistry 2017 |


