 Open Access Article
Creative Commons Attribution 3.0 Unported Licence
A highly selective ratiometric fluorescent probe for the cascade detection of Zn2+ and H2PO4− and its application in living cell imaging†
Kui Du ab,
Shizhen Niua,
Li Qiaob,
Yandong Douc,
Qing Zhu
 c,
Xinzhi Chen*a and
Pengfei Zhang*b
aKey Laboratory of Biomass Chemical Engineering of Ministry of Education, College of Chemical and Biological Engineering, Zhejiang University, Hangzhou, 310027, P. R. China. E-mail: 15268560133@163.com
bCollege of Material Chemistry and Chemical Engineering, Hangzhou Normal University, Hangzhou, 310036, P. R. China
cKey Laboratory of Bioorganic Synthesis of Zhejiang Province, College of Biotechnology and Bioengineering, Hangzhou 310014, China
First published on 21st August 2017
Abstract
A simple ratiometric sensor (L1) for the cascade detection of Zn2+ and H2PO4− with high selectivity was reported based on the intermolecular charge transfer (ICT) mechanism. This new sensor could distinguish Zn2+ from Cd2+, and features high fluorescence quantum yield with L1 (0.45) and L1–Zn2+ (0.27). There is a good linear relationship between the fluorescence ratio I525 nm/I430 nm upon addition of Zn2+ and the limit of detection (LOD) was evaluated to be 41.0 nM. Furthermore, the in situ prepared L1–Zn2+ complex also displayed good selectivity and ratiometric response for H2PO4− and the detection limit of L1–Zn2+ was found to be 49.0 nM. L1 exhibits permeability and can been applied to the detection of intracellular Zn2+ and H2PO4− in HepG-2 cells.
Introduction
Zinc plays important roles in gene transcription, cellular metabolism, immune function, and so on.1 It is also involved in neurological disorders such as Alzheimer's disease, ischemic stroke, cerebral ischemia and infantile diarrhea.2 Therefore, unravelling the processes in facilitating essential biological functions of mobile zinc ions in living cells is of significant interest.3 On the other hand, a simple and rapid method for determination of dihydrogen phosphate (H2PO4−), which is the predominant equilibrium species of inorganic phosphate at physiological pH, is still in high demand.4Fluorescent chemosensors have played an important role in the recognition of biologically important species, such as metal ions and anions, due to the simplicity and high sensitivity of fluorescence assays.5 The receptor, which is referred to as the central processing unit (CPU) of a chemosensor, plays a significant role in the designing of new fluorescent chemosensors, especially for the quinoline-based receptor.6 In recent years, numerous chemosensors with good recognition sites for a single species have been developed. However, fluorogenic receptors for the fluorescent chemosensors that allow the cascaded detection of multiple analytes with high selectivity are still desirable.7 Although, several fluorescent chemosensors with good recognition site has been designed for both zinc and dihydrogen phosphate,8 the ratiometric fluorescent probe with excellent selectivity for the cascade detection of the Zn2+ and H2PO4− is still a big challenge.9
Our research group involves the design and synthesis of novel 8-aminoquinoline derivatives and its application in the biological fields.10 In continue our work, herein; we have reported a novel receptor for the cascade detection of Zn2+ and H2PO4− with high selectivity through introducing of the tetrahydrofuran on to the carboxamidoquinoline. Furthermore, based on the intermolecular charge transfer (ICT) mechanism,11 a new fluorescent chemosensors L1 was designed with excellent ratiometric fluorescence response for the detection of Zn2+ ions and H2PO4−. And this new sensor has displayed a good application prospect in cell image.
Results and discussion
Synthesis
The synthesis of the L1 was described in Scheme 1. L1 was synthesized in two steps. Starting from compound 1, compound 2 was achieved in the presence of NaBr, PhI(OAc)2 and PivOH with Cu(OAc)2 as the catalyst. Then compound 2, phenylacetylene, PdCl2(PPh3)2 and Et3N were added in DMF and reacted at 60 °C for 24 h, the target product L1 was obtained.Fluorescence response for Zn2+
We implemented the spectroscopic properties of L1 for Zn2+ using the UV-Vis and fluorescence spectroscopy studies in DMSO/H2O (8![[thin space (1/6-em)]](https://www.rsc.org/images/entities/char_2009.gif) :
:![[thin space (1/6-em)]](https://www.rsc.org/images/entities/char_2009.gif) 2, v/v). The absorption spectrum of L1 exhibited two absorption bands at 280 nm and 360 nm corresponding to phenylene-ethynylene.12 Upon addition of Zn2+ ions (0–8 equiv.) to the solution of L1, resulted in the red shift of the absorption band center at 360 nm to 420 nm, along with the formation of a clear isosbestic point at 385 nm, indicating formation of L1–Zn2+ complex (Fig. S1†).
2, v/v). The absorption spectrum of L1 exhibited two absorption bands at 280 nm and 360 nm corresponding to phenylene-ethynylene.12 Upon addition of Zn2+ ions (0–8 equiv.) to the solution of L1, resulted in the red shift of the absorption band center at 360 nm to 420 nm, along with the formation of a clear isosbestic point at 385 nm, indicating formation of L1–Zn2+ complex (Fig. S1†).
In order to evaluate the selectivity of L1 for Zn2+, the fluorescence changes of L1 to various metal ions (Mg2+, Na+, Cu2+, Hg2+, K+, Al3+, Fe3+, Ca2+, Ag+, Ba2+, Co2+, Pb2+, Mn2+, Ni2+, Cr3+, Zn2+ and Cd2+) were investigated in DMSO/H2O (8![[thin space (1/6-em)]](https://www.rsc.org/images/entities/char_2009.gif) :
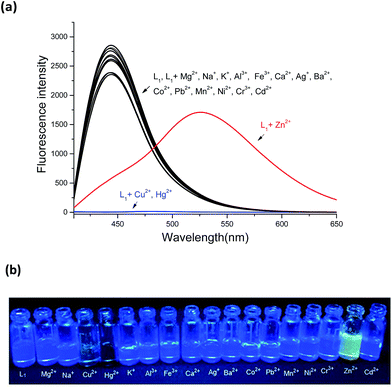
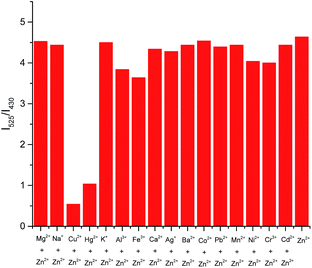
:![[thin space (1/6-em)]](https://www.rsc.org/images/entities/char_2009.gif) 2, v/v). Sensor L1, upon excitation at 390 nm, displayed a strong emission band centered at 430 nm which contribute to the introducing of the phenylene-ethynylene. Upon addition of 12 equiv. Zn2+ ion, the emission band at 430 nm decreased dramatically, meanwhile, a new emission band centered at 525 nm with a remarkable red-shift of 95 nm were observed (Fig. 1a). It can be attributed to an ICT process in the excited state of L1–Zn2+.13 In this situation, electron transfer from amide nitrogen adjacent to the quinoline which was substituted with phenylene-ethynylene at C-5 position to Zn2+ enhanced the ICT process of L1, and an obviously red-shift of 95 nm was achieved. Simultaneously, an apparently yellow emission of the solution can be visualized through the naked eye under a UV lamp (365 nm, Fig. 1b). While addition of other metal cations, no significant spectral changes were observed except Cu2+ and Hg2+, which shown fluorescence quenching effects. These results indicated that L1 can readily recognize Zn2+ from other ions through the obviously red-shift fluorescence. Furthermore, a competition experiment was conducted through adding Zn2+ (12 equiv.) to L1 solution in the presence of other metal ions (12 equiv.), which demonstrated that no obvious interference was observed except for Cu2+ and Hg2+ (Fig. 2).
2, v/v). Sensor L1, upon excitation at 390 nm, displayed a strong emission band centered at 430 nm which contribute to the introducing of the phenylene-ethynylene. Upon addition of 12 equiv. Zn2+ ion, the emission band at 430 nm decreased dramatically, meanwhile, a new emission band centered at 525 nm with a remarkable red-shift of 95 nm were observed (Fig. 1a). It can be attributed to an ICT process in the excited state of L1–Zn2+.13 In this situation, electron transfer from amide nitrogen adjacent to the quinoline which was substituted with phenylene-ethynylene at C-5 position to Zn2+ enhanced the ICT process of L1, and an obviously red-shift of 95 nm was achieved. Simultaneously, an apparently yellow emission of the solution can be visualized through the naked eye under a UV lamp (365 nm, Fig. 1b). While addition of other metal cations, no significant spectral changes were observed except Cu2+ and Hg2+, which shown fluorescence quenching effects. These results indicated that L1 can readily recognize Zn2+ from other ions through the obviously red-shift fluorescence. Furthermore, a competition experiment was conducted through adding Zn2+ (12 equiv.) to L1 solution in the presence of other metal ions (12 equiv.), which demonstrated that no obvious interference was observed except for Cu2+ and Hg2+ (Fig. 2).
In an attempt to evaluate the sensing property of sensor L1 to Zn2+, fluorescence titration experiments were conducted. As shown in Fig. 3, the emission intensity at 430 nm was gradually decreased, while a new emission band appeared at 525 nm with gradual increasing upon addition of Zn2+ ions. And the well-defined isoemissive point was observed at 475 nm. The fluorescence quantum yield of the L1–Zn2+ complex was calculated to be 0.27 (at 525 nm) as compared to that of free L1 (0.45 at 430 nm). This ratiometric fluorescence behavior of L1 with Zn2+ ions is attributed to internal charge transfer (ICT) mechanisms. From the titration profile, the binding constant of L1 and Zn2+ was evaluated to be 1.94 × 10⁴ M−1 (Fig. S2†).7a,d The detection limit of L1 for Zn2+ ions was determined to be 41.0 nM which is sufficiently low for the detection of Zn2+ ions in intracellular and in vivo11d (Fig. S3†).
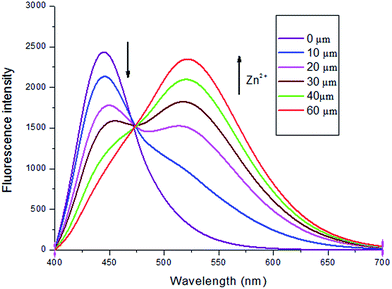 | ||
Fig. 3 Fluorescence spectra of L1 (5 μM) in the presence of different concentration of Zn2+ in DMSO/H2O (v/v = 8![[thin space (1/6-em)]](https://www.rsc.org/images/entities/char_2009.gif) : :![[thin space (1/6-em)]](https://www.rsc.org/images/entities/char_2009.gif) 2), λex = 390 nm. 2), λex = 390 nm. | ||
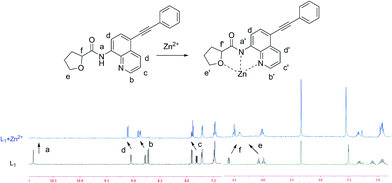
For better understanding the interaction of L1 with Zn2+, 1H NMR spectra of L1 in the absence and presence of Zn2+ (12.0 equiv.) were conducted (Fig. 4). On complexation of L1 with Zn2+, amide proton was diminished, ascribed to the interaction between metal and carboxamido group.14 And all protons of the quinoline or tetrahydrofuran moieties changed accordingly, demonstrated that the direct interaction between the ligating groups of the probe and Zn2+. Moreover, the release of L1 when added H2PO4− to the L1–Zn2+ solution was displayed through the ESI-Mass spectra, in which two peaks at m/z 343.1444 assigned to [L1 + H+] and at m/z 406.2726 assigned to [L1 + Zn2+ + H+] were observed (Fig. S4†). The Job's plot analysis indicated that 1![[thin space (1/6-em)]](https://www.rsc.org/images/entities/char_2009.gif) :
:![[thin space (1/6-em)]](https://www.rsc.org/images/entities/char_2009.gif) 1 binding stoichiometry between L1 and Zn2+ (Fig. 5). And the proposed mechanism of L1 for the cascade detection of Zn2+ and H2PO4− was displayed in Fig. S5.†
1 binding stoichiometry between L1 and Zn2+ (Fig. 5). And the proposed mechanism of L1 for the cascade detection of Zn2+ and H2PO4− was displayed in Fig. S5.†
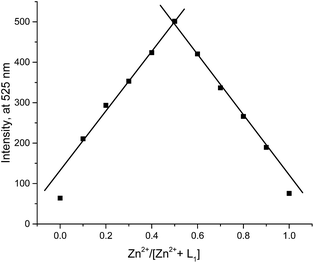 | ||
Fig. 5 Job's plot for L1–Zn2+ complex in DMSO/H2O (v/v = 8![[thin space (1/6-em)]](https://www.rsc.org/images/entities/char_2009.gif) : :![[thin space (1/6-em)]](https://www.rsc.org/images/entities/char_2009.gif) 2). The total concentration of Zn2+ and L1 is 10 μM. λex = 390 nm. 2). The total concentration of Zn2+ and L1 is 10 μM. λex = 390 nm. | ||
Subsequently effects of pH on the fluorescence of L1 with Zn2+ also were investigated. As shown in Fig. 6, L1 displayed weak fluorescence response to Zn2+ in an acidic environment (pH < 5) contribute to the protonation of the amino group in L1, resulted in weak coordination ability to Zn2+. However, the Zn2+ detection abilities of L1 can be achieved when the pH increased from 6 to 11. At pH 7.5, the fluorescence intensity reached its optimum point at 525 nm, indicating that L1 possess the highest sensing ability under the physiological pH window. Therefore, all the fluorescence detection processes were performed at pH 7.5.
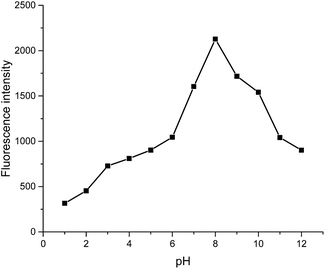 | ||
| Fig. 6 Effect of pH on the fluorescence intensity of L1 (5 μM) with Zn2+ (12 equiv.) in DMSO/water (v/v, 8/2) (λex = 390 nm, λem = 525 nm). | ||
Fluorescence sensing of L1–Zn2+ complex for H2PO4−
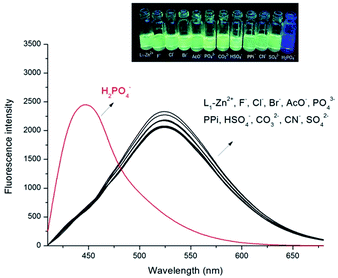
Then L1–Zn2+ complex were further conducted as a secondary sensor system towards H2PO4− recognition via the relay recognition approach. To evaluate the selective detection of H2PO4− with various anions, F−, Cl−, Br−, AcO−, PO43−, PPi, CO32−, HSO4−, CN− and SO42− (14 equiv.) were added to the solution of the L1–Zn2+ complex. As shown in Fig. 7, the addition of H2PO4− (14 equiv.) to the solution of L1–Zn2+ complex resulted in the appearance of fluorescence emission at 430 nm along with simultaneous decease at 525 nm. And the solution turned to the original blue color from yellow (Fig. 7). The revival of probe L1 fluorescence at 430 nm is contributed to the coordination of H2PO4− with Zn2+. However, the addition of other inorganic anions such F−, Cl−, Br−, AcO−, PO43−, PPi, CO32−, HSO4−, CN− and SO42− (14 equiv.) did not show any obvious changes in fluorescence response (Fig. S6†).The fluorescence titration experiments also were conducted to estimate the sensing property of sensor L1–Zn2+ to H2PO4− (Fig. 8). The emission intensity at 430 nm was gradually increased, while emission intensity at 525 nm with gradual decreasing upon addition of H2PO4− ions. Addition of 14 equiv. H2PO4− (70 μM) to the solution resulted in absolutely quenching of the fluorescence emission of the L1–Zn2+ complex. Furthermore, the L1–Zn2+ complex provided an excellent ratiometric system for the detection of H2PO4− in DMSO/H2O (8![[thin space (1/6-em)]](https://www.rsc.org/images/entities/char_2009.gif) :
:![[thin space (1/6-em)]](https://www.rsc.org/images/entities/char_2009.gif) 2, v/v). And the detection limit of L1–Zn2+ for H2PO4− ions was determined to be 49.0 nM [Fig. S7†].
2, v/v). And the detection limit of L1–Zn2+ for H2PO4− ions was determined to be 49.0 nM [Fig. S7†].
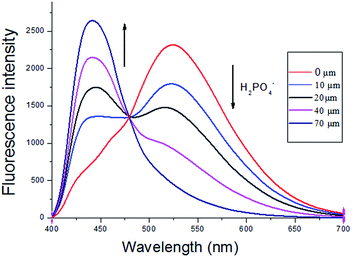 | ||
Fig. 8 Fluorescence spectra of L1–Zn2+ (5 μM) in the presence of different concentration of H2PO4− in DMSO/H2O (v/v = 8![[thin space (1/6-em)]](https://www.rsc.org/images/entities/char_2009.gif) : :![[thin space (1/6-em)]](https://www.rsc.org/images/entities/char_2009.gif) 2), λex = 390 nm. 2), λex = 390 nm. | ||
Application of fluorescence detection of Zn2+ and H2PO4− ions in living cells
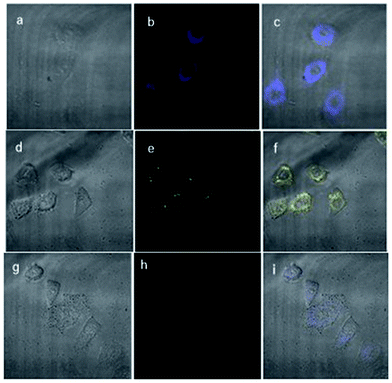
To further assess fluorescence detection of Zn2+ and H2PO4− ions in biological samples, fluorescent imaging inside HepG-2 cells were performed by the bio-imaging process. Firstly, the cytotoxicity which plays the important factor in live cell imaging of the L1 was assessed by MTS assays in HepG-2 cells (Fig. S8†). The result indicating that low micromolar concentrations of L1 were almost free of toxicity to the HepG-2 cells. Although treatment with 50 μM of L1 at 24 h, the cell survival decreased, no significant loss of cells were noticed, suggesting that this new sensor can be applied in the cell imaging.Incubation of HepG-2 cells with 5 μM of L1 in TBS buffer before imaging for 30 min at 37 °C showed in the blue channel which indicated the emissive nature of L1 in the intracellular system (Fig. 9a–c). While, the addition of Zn2+ (40 μM) to cells with receptor L1 (5 μM) showed fluorescence emission in the yellow channel (Fig. 9d–f). These results suggest that L1 is cell permeable and can be further designed as a biomaterial for the probing of bioactive analytes in the cellular environment with the change in fluorescence emission from blue to yellow. Moreover, the successive interaction of H2PO4− (60 μM) towards the L1–Zn2+ complex was conducted. The yellow fluorescence turned off upon the addition of NaH2PO4, along with the fluorescence revival of probe L1 (Fig. 9g–i). Hence, L1 has potential applicability for detecting Zn2+ and H2PO4− in biological samples via the relay recognition approach.
Conclusions
In summary, we have developed a novel fluorescent L1 with tetrahydrofuran-2-carboxamidoquinoline as the new receptor. Sensor L1 displayed highly selective and ratiometric fluorescence responses to Zn2+ at physiological pH condition. Moreover, the in situ formed L1–Zn2+ complex demonstrated reversible, selective and good ratiometric response for the H2PO4−. The detection limit of L1 to Zn2+ and L1–Zn2+ complex to H2PO4− was found to be 41.0 nM and 49.0 nM respectively. Furthermore, the intracellular detection of Zn2+ ions by L1 and H2PO4− ions by the L1–Zn2+ complex was also conducted in the HepG-2 cell lines. These results suggest that L1 and the in situ formed L1–Zn2+ complex are cell permeable and can be further designed as a biomaterial for the probing of bioactive analytes in the cellular environment with the change in fluorescence emission between blue to yellow.Experimental section
Materials and general methods
The reagents and solvents for the present study were purchased from commercial suppliers and used as received. Absorption measurements were carried out using a JASCO-V630 spectrophotometer. Fluorescence spectra were recorded on SpectraMax M5. 1H NMR and 13C NMR spectra were recorded using a Bruker DRX-500 spectrometer. All of the chemical shifts were reported in ppm and coupling constants (J) in hertz. High-resolution mass spectroscopy (HRMS) was measured on a Bruker micrOTOF-Q mass spectrometer (BrukerDaltonik, Bremen, Germany). The pH measurements were made using a Mettler Toledo FE20 pH meter. Fluorescence imaging experiments were performed using a Zeiss Axiovert 200M inverted epifluorescence microscope with a Hamamatsu EM-CCD digital camera C9100 and a MS200 XY Piezo Z stage (Applied Scientific Instruments, Inc.). The cytotoxicity of L1 was evaluated by the MTS assay (BB-4204-250T).Cell imaging experiments
The HepG-2 cells were cultured in Dulbecco's Modified Eagle Medium (DMEM, GIBCO), supplemented with 10% heat-deactivated fetal bovine serum (FBS) and 1% penicillin/streptomycin, at 37 °C in a humidified atmosphere with 5% CO2.15 In order to get the cell image, the HepG-2 cells were seeded in 6-well flat-bottomed plates one day before. 5 μm of L1 was added to the HepG-2 cells and incubated for 0.5 h at 37 °C under 5% CO2 and the fluorescence imaging of intracellular Zn2+ was observed under inverted fluorescence microscope, the image last for 5 min. And then the cells were washed with TBS for three times, subsequently incubating with 40 μm Zn2+ for another 0.5 h, then the image was achieved. After rinsed with TBS for another three times of the cells, NaH2PO4 solutions (60 μm) were added in the cells. The imaging was started immediately upon NaH2PO4 solution addition.Synthesis
The synthesis of the L1 was described in Scheme 1. Compound 1 and 2 were achieved according to our previous work.10b The mixture of compound 2 (0.64 g, 2.0 mmol), phenylacetylene (0.25 g, 2.5 mmol), PdCl2(PPh3)2 (15.8 mg, 0.2 mmol), Et3N (0.40 g, 4.0 mmol), and DMF (15 mL) was heated at 60 °C for 24 h. After completion of the reaction, the mixture was filtered to remove salts and the precipitate was washed with 100 mL of ethyl acetate, and then the organic phase was added into 100 mL of water. 100 mL of ethyl acetate was used to extract the crude product from the mixture. The organic phase was removed under reduced pressure to obtain the crude product, which was purified by silica gel column with a mixture solvent of petroleum ether/ethyl acetate as the eluent.Conflicts of interest
There are no conflicts to declare.Acknowledgements
Financial support from the Natural Science Foundation of Zhejiang Province (No. LZ13B020001), the National Natural Science Foundation of China (No. 21376213, No. 21376058).Notes and references
- (a) A. I. Bush, W. H. Pettingell, G. Multhaup, M. D. Paradis, J. P. Vonsattel, J. F. Gusella, K. Beyreuther, C. L. Masters and R. E. Tanzi, Science, 1994, 265, 1464 CAS; (b) J. M. Berg and Y. Shi, Science, 1996, 271, 1081 CAS; (c) T. V. Halloran, Science, 1993, 261, 715 Search PubMed; (d) C. J. Frederickson, J. Y. Koh and A. I. Bush, Nat. Rev. Neurosci., 2005, 6, 449 CrossRef CAS PubMed; (e) C. J. Frederickson and A. I. Bush, BioMetals, 2001, 14, 353 CrossRef CAS PubMed.
- (a) J. Y. Koh, S. W. Suh, B. J. Gwag, Y. Y. He, C. Y. Hsu and D. W. Choi, Science, 1996, 272, 1013 CAS; (b) D. W. Choi and J. Y. Koh, Annu. Rev. Neurosci., 1998, 21, 347 CrossRef CAS PubMed; (c) C. F. Walker and R. E. Black, Annu. Rev. Nutr., 2004, 24, 255 CrossRef CAS PubMed.
- (a) C. Andreini, L. Banci, I. Bertini and A. J. Rosato, Proteome Res., 2006, 5, 196 CrossRef CAS PubMed; (b) G. Salazar, B. Craige, R. Love, D. Kalman and V. Faundez, J. Cell Sci., 2005, 118, 1911 CrossRef CAS PubMed; (c) K. Ponnuvel, V. Padmini and R. Sribalan, Sens. Actuators, B, 2016, 222, 605 CrossRef CAS; (d) Z. Guo, G. Kim, I. Shin and J. Yoon, Biomaterials, 2012, 33, 7818 CrossRef CAS PubMed; (e) G. Sivaramam, T. An and D. Chellappa, Analyst, 2012, 137, 5881 RSC.
- (a) A. E. Hargrove, S. Nieto, T. Zhang, J. L. Sessler and E. V. Anslyn, Chem. Rev., 2011, 111, 6603 CrossRef CAS PubMed; (b) C. Bazzicalupi, A. Bencini and V. Lippolis, Chem. Soc. Rev., 2010, 39, 3709 RSC; (c) D. Zhang, J. R. Cochrane, A. Martinez and G. Gao, RSC Adv., 2014, 4, 29735 RSC.
- (a) J. Yoon, S. K. Kim, N. J. Singh and K. S. Kim, Chem. Soc. Rev., 2006, 35, 355 RSC; (b) P. A. Gale, S. E. Garcia-Garrido and J. Garric, Chem. Soc. Rev., 2008, 37, 151 RSC; (c) M. Formica, V. Fusi, L. Giorgi and M. Micheloni, Coord. Chem. Rev., 2012, 256, 170 CrossRef CAS.
- (a) A. P. de Silva, H. Q. Nimal Gunaratne, T. Gunnlaugsson, A. J. M. Huxley, C. P. McCoy, J. T. Rademacher and T. E. Rice, Chem. Rev., 1997, 97, 1515 CrossRef CAS PubMed; (b) Z. Xu, J. Yoon and D. R. Spring, Fluorescent chemosensors for Zn2+, Chem. Soc. Rev., 2010, 39, 1996 RSC; (c) Y. Ma, F. Wang, S. Kambam and X. Chen, Sens. Actuators, B, 2013, 188, 1116 CrossRef CAS; (d) J. Qiang, C. Chang, Z. Zhu, T. Wei, W. Yu, F. Wang, J. Yin, Y. Wang, W. Zhang, J. Xie and X. Chen, Sens. Actuators, B, 2016, 233, 591 CrossRef CAS; (e) W. Yu, J. Qiang, J. Yin, S. Kambam, F. Wang, Y. Wang and X. Chen, Org. Lett., 2014, 16, 2220 CrossRef CAS PubMed; (f) C. Chang, F. Wang, T. Wei and X. Chen, Ind. Eng. Chem. Res., 2017, 56, 8797 CrossRef CAS.
- (a) E. J. Song, H. Kim, I. H. Hwang, K. B. Kim, A. R. Kim, I. Noh and C. Kim, Sens. Actuators, B, 2014, 195, 36 CrossRef CAS; (b) Y. W. Choi, G. J. Park, Y. J. Na, H. Y. Jo, S. A. Lee, G. R. You and C. Kim, Sens. Actuators, B, 2014, 194, 343 CrossRef CAS; (c) E. J. Song, J. Kang, G. R. You, G. J. Park, Y. Kim, S. J. Kim, C. Kim and R. G. Harrison, Dalton Trans., 2013, 42, 15514 RSC; (d) L. Li, Y. Shen, Y. Zhao, L. Mu, X. Zeng, C. Redshaw and G. Wei, Sens. Actuators, B, 2016, 226, 279 CrossRef CAS; (e) A. Roy, S. Dey and P. Roy, Sens. Actuators, B, 2016, 237, 628 CrossRef CAS; (f) C. Patra, A. K. Bhanja, C. Sen, D. Ojha, D. Chattopadhyay, A. Mahapatra and C. Sinha, RSC Adv., 2016, 6, 53378 RSC.
- (a) N. Sharma, S. I. Reja, V. Bhalla and M. Kumar, Dalton Trans., 2015, 44, 6062 RSC; (b) S. Suganya, S. Velmathi, P. Venkatesan, S. Wu and M. S. Boobalan, Inorg. Chem. Front., 2015, 2, 649 RSC; (c) A. Hens, RSC Adv., 2015, 5, 54352 RSC; (d) B. Shi, Y. Zhang, T. Wei, Q. Lin, H. Yao, P. Zhang and X. You, Sens. Actuators, B, 2014, 190, 555 CrossRef CAS; (e) S. Goswami, S. Maity, A. C. Maity, A. K. Das, K. Khanra, T. K. Mandal and N. Bhattacharyy, Tetrahedron Lett., 2014, 55, 5993 CrossRef CAS; (f) A. Gogoi, S. Samanta and G. Das, Sens. Actuators, B, 2014, 202, 788 CrossRef CAS; (g) C. Patra, A. K. Bhanja, C. Sen, D. Ojha, D. Chattopadhyay, A. Mahapatra and C. Sinha, Sens. Actuators, B, 2016, 228, 287 CrossRef CAS; (h) V. Bhalla, V. Vij, M. Kumar, P. R. Sharma and T. Kaur, Org. Lett., 2012, 14, 1012 CrossRef CAS PubMed.
- C. He, W. Zhu, Y. Xu, Y. Zhong, J. Zhou and X. Qian, J. Mater. Chem., 2010, 20, 10755 RSC.
- (a) J. Xu, C. Shen, X. Zhu, P. Zhang, M. J. Ajitha, K. Huang, Z. An and X. Liu, Chem.–Asian J., 2016, 11, 882 CrossRef CAS PubMed; (b) J. Xu, X. Zhu, G. Zhou, B. Ying, P. Ye, L. Su, C. Shen and P. Zhang, Org. Biomol. Chem., 2016, 14, 3016 RSC; (c) B. Ying, J. Xu, X. Zhu, C. Shen and P. Zhang, ChemCatChem, 2016, 8, 2604 CrossRef CAS; (d) X. Zhu, L. Qiao, P. Ye, B. Ying, J. Xu, C. Shen and P. Zhang, RSC Adv., 2016, 6, 89979 RSC.
- (a) L. Gu, X. Wan, H. Liu, T. Liu and Y. Yao, Anal. Methods, 2014, 6, 8460 RSC; (b) Z. Liu, C. Zhang, Y. Chen, F. Qian, Y. Bai, W. He and Z. Guo, Chem. Commun., 2014, 50, 1253 RSC; (c) L. Xue, G. Li, C. Yu and H. Jiang, Chem.–Eur. J., 2012, 18, 1050 CrossRef CAS PubMed; (d) Y. Ma, H. Chen, F. Wang, S. Kambam, Y. Wang, C. Mao and X. Chen, Dyes and Pigments, 2014, 102, 301 CrossRef CAS.
- J. L. Palma, A. Evrim, H. Lindsay, T. B. Marder, J. C. Collings, B. Andrew, J. S. Melinger, J. L. Krause and V. D. Kleiman, J. Phys. Chem. C, 2010, 114, 20702 CAS.
- J. Hou, H. Y. Chen, S. Zhang, G. Li and Y. Yang, J. Am. Chem. Soc., 2008, 130, 16144 CrossRef CAS PubMed.
- (a) Y. Zhang, X. Guo, W. Si, L. Jia and X. Qian, Org. Lett., 2008, 10, 473 CrossRef CAS PubMed; (b) S. Goswami, A. K. Das, K. Aich, A. Manna, S. Maity, K. Khanra and N. Bhattacharyya, Analyst, 2013, 138, 4593 RSC.
- (a) F. Qian, C. Zhang, Y. Zhang, W. He, X. Gao, P. Hu and Z. Guo, J. Am. Chem. Soc., 2009, 131, 1460 CrossRef CAS PubMed; (b) L. Tang, X. Dai, K. Zhong, D. Wu and X. Wen, Sens. Actuators, B, 2014, 203, 557 CrossRef CAS; (c) K. Ponnuvel, M. Kumar and V. Padmini, Sens. Actuators, B, 2016, 227, 242 CrossRef CAS.
Footnote |
| † Electronic supplementary information (ESI) available. See DOI: 10.1039/c7ra08020d |
| This journal is © The Royal Society of Chemistry 2017 |


