
 Open Access Article
 This Open Access Article is licensed under a
 Creative Commons Attribution 3.0 Unported Licence
Theoretical investigations on the phase transition of pure and Li-doped AlH3
Zheng Mei a,
Feng-Qi Zhaob,
Si-Yu Xub and
Xue-Hai Ju*a
a,
Feng-Qi Zhaob,
Si-Yu Xub and
Xue-Hai Ju*a
aKey Laboratory of Soft Chemistry and Functional Materials of MOE, School of Chemical Engineering, Nanjing University of Science and Technology, Nanjing 210094, P. R. China. E-mail: xhju@njust.edu.cn; Fax: +86 25 84431622; Tel: +86 25 84315947 extn 801
bLaboratory of Science and Technology on Combustion and Explosion, Xi'an Modern Chemistry Research Institute, Xi'an 710065, P. R. China
First published on 29th August 2017
Abstract
In order to solve a contradiction between early theoretical prediction and experiments concerning the γ → α phase transition of aluminum hydride, models of Li-doped AlH3 were constructed and investigated theoretically. Thermodynamic calculations show that the γ → α transition of pure AlH3 absorbs energy, and the changes in Gibbs free energy are in range of 1.74–1.99 kJ mol−1 at 298–380 K. These are opposite to the experimental fact that the γ- to α-phase transition takes place at 380 K. However, the changes in enthalpy and Gibbs free energy in the γ → α phase transition of Li-doped AlH3 are negative. The doping of Li decreases the activation energy of the γ → α transition and introduces more metastable states between them. As the doping content increases, both the changes in enthalpy and Gibbs free energy (ΔHγ→α and ΔGγ→α) decrease. The experimental ΔHγ→α value (−2.83 kJ mol−1) is between those of doped AlH3 with 1/23 and 1/11 Li-content (−0.87 and −5.62 kJ mol−1 for Al23LiH70 and Al11LiH34, respectively). Heat capacity CP(T) increases as the Li-doping content increases. The CP(T) of Al23LiH70 is consistent with the experiments. Considering the thermodynamic evidence and the experimental conditions for AlH3 preparation, the aluminum hydride synthesized by the reaction of LiAlH4 + AlCl3 is probably Li-doped with a Li content of 1/23. The changes in enthalpy and Gibbs free energy, as well as the activation energy for the γ → α phase transition can be increased if the Li-doped AlH3 is purified.
1. Introduction
Aluminum hydride (AlH3, alane) is a metastable crystal that is an important material because of its high hydrogen and energy storage capabilities,1–5 thus it has been considered as a promising candidate for recyclable hydrogen storage materials in fuel cells and energetic components in rocket propellants.1,2 Furthermore, as a highly active metal hydride and reductant, AlH3 can be used in metastable intermolecular composites (MICs). MICs are high performance thermite composites usually consisting of nano layers, bars or particles of reducing and oxidizing agents, which are highly active metals (nano Al, Mg) and metal oxides (nano CuO, Fe2O3, etc.), respectively.6 However, researchers have realized that the MICs with a metal reductant were low on combustion velocity and pressure because of the lack of gaseous products.6 Thus, AlH3 could be a promising reductant in MICs, because AlH3 does not only carry a large amount of energy but also produces a lot of gas (H2O) during the reactions.Due to its significant applications, many researchers have investigated AlH3 by simulation or experiment. Theoretical investigations involving hydrogen store and desorption properties,7–9 polymorph transition of pressures1,5,10 and mediated features11 of AlH3 have been reported in recent years. Meanwhile, experimental studies of synthesis and thermodynamic analysis have been performed and showed the phase transition among AlH3 crystalline polymorphs. An earlier calculation by Ke et al. predicted new cubic and orthorhombic polymorphs with smaller enthalpy and Gibbs free energy than those of hexagonal polymorph (α-phase).10 These polymorphs were successively synthesized in subsequent years.12,13 However, some researchers have observed the phase transition with heat release from β and γ phase AlH3 to α phase at about 380 K,2,3 which contradicts Ke's theoretical results. Considering the significance of AlH3 in the energetic materials, it is necessary to find more details about the thermodynamics of the polymorphs and to solve this contradiction.
In the previous thermodynamic experiments, both the α and γ polymorphs were synthesized using a reaction of AlCl3 and LiAlH4 in ethereal solvent that was originally developed by Brower et al.:14
 | (1) |
Complex metal hydrides (LiAlH4 and LiBH4) were required to preserve the AlH3 in solvent evaporation. Different AlH3 polymorphs were produced as the content of the metal hydride changes. The conditions played an important role in determining the structural and thermodynamic properties of AlH3 thus generated. We have noticed that the AlH3 was generated in the electrolyte solution (with Li+, Cl−, Al3+, AlH4−). Since the Li+ ion is small and dissociative in the reaction solution, is it possible that Li atom was doped into the AlH3 crystals? To answer this question and find out the influence of Li-doping upon the thermodynamic performances of AlH3 polymorphs, we performed theoretical investigations of α- and γ-AlH3 with different Li doping contents (including pure AlH3) and made a comparison with the experimental results.
For this purpose, density functional theory with generalized gradient approximation (DFT-GGA) calculations for α- and γ-AlH3 with different Li-doping contents were performed to obtain the optimized geometries, energies, and phonon vibrational modes. The phonon calculations provided density of phonon states (phonon DOS), zero point vibrational energy (ZPE), as well as vibrational enthalpy and entropy. The results could be used to estimate the thermodynamic properties including internal energy, heat capacity, Gibbs free energy and the enthalpy change of phase transition. By comparing the calculated and the available experimental results, the role of Li-doping in AlH3 phase transition could be revealed.
2. Computational methods and details
Density functional theory (DFT) methods have been efficiently used for the periodic atomic/molecular/crystalline systems.15–19 Many functionals, including Perdew–Burke–Ernzerhof (PBE), Perdew–Wang (PW91), revised PBE (RPBE), PBE for solids (PBESOL) and PBE with Wu–Cohen exchange (WC) functionals20–24 were developed for improving the accuracy of GGA simulations of different elements and systems. In order to select the most suitable method and functional for AlH3 systems, local density approximation (LDA) and generalized gradient approximation (GGA) calculations with the above functionals were performed for α- and γ-AlH3 crystals, while the optimized lattice parameters were compared with the experiments. The method with the smallest error of lattice parameters would be employed in the following calculation of Li-doped AlH3 crystals, thus guaranteeing accuracy geometries and energies. All the DFT calculations were performed by using CASTEP module in Material Studio 6.0 package.25Once the geometries were optimized to the lowest configuration energies, the phonon calculations were performed at the same level to provide the phonon DOS using Baroni's linear response (or density functional perturbation theory, DFPT) method.26 Based on the configuration energy and the phonon spectrum, the thermodynamic properties were calculated via Baroni's formulas below. The internal energy U is
| U = EC + ZPE + HV | (2) |
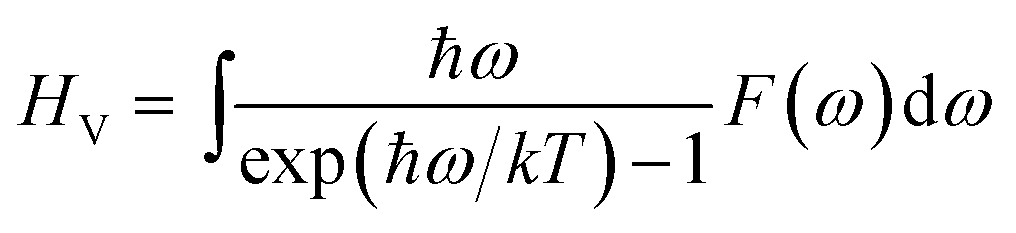 | (3) |
 | (4) |
The Gibbs free energy is
 | (5) |
 | (6) |
The internal energy U is actually the total energy of a system. Since the work term of Δ(pV) is neglectable for solids under atmospheric pressure, the change of U demonstrates the change of enthalpy, which is usually characterized by the heat release or absorption. Therefore, the transition enthalpy of γ → α phase AlH3 is
| ΔHγ→α = Uα − Uγ | (7) |
3. Results and discussion
3.1 Benchmark of the methods and functionals
In order to find an appropriated method for AlH3 crystal systems, GGA calculations with 5 functionals (with and without DFT-dispersion, DFT-D correction) and LDA calculations for pure α- and γ-AlH3 were performed. Results were listed in Table 1 together with the experimental values. Four data were noted in bold in Table 1, which are the smallest mean absolute error (MAE) and crystalline cell volume error of α- and γ-AlH3, respectively. As can be seen in Table 1, GGA/PBE and GGA/PW91 are superior to others for the calculation of AlH3 crystals, especially the PW91 was superior for overall performance (MAE are 0.45% and 0.57% while ΔV are 0.59% and 1.29%, respectively for α- and γ-AlH3). But interestingly, the cell volume of γ-AlH3 at the LDA/CA-PZ level was excellently consistent with that of experiment, although its performances for other parameters were not the best. This may be caused by two reasons: (a) the offset of the positive and negative errors of the lattice parameters, (b) the small gradient of electronic density in the AlH3 crystals. In addition, the TS, Grimme and OBS DFT-D dispersion correction (for PBE, PBE, and PW91, respectively) have overestimated the interactions between the atoms, leading to the negative error of the lattice parameters and cell volumes.27–29| Phase | Method/functional | a (Å) | b (Å) | c (Å) | V (Å3) | Δa (%) | Δb (%) | Δc (%) | MAE (%) | ΔV (%) |
|---|---|---|---|---|---|---|---|---|---|---|
| a The experimental a, b, c of α- and γ-AlH3 were taken from ref. 13 and 30 respectively. | ||||||||||
| Alpha | GGA/PBE | 4.4741 | 4.4741 | 11.7785 | 204.19 | 0.56 | 0.56 | −0.21 | 0.44 | 0.90 |
| GGA/PBE TS | 4.3261 | 4.3261 | 11.6356 | 188.58 | −2.77 | −2.77 | −1.42 | 2.32 | −6.81 | |
| GGA/PBE Grimme | 4.2732 | 4.2732 | 11.6470 | 184.18 | −3.96 | −3.96 | −1.33 | 3.08 | −8.98 | |
| GGA/RPBE | 4.6271 | 4.6271 | 11.8120 | 219.01 | 4.00 | 4.00 | 0.07 | 2.69 | 8.23 | |
| GGA/PW91 | 4.4710 | 4.4710 | 11.7579 | 203.55 | 0.49 | 0.49 | −0.39 | 0.45 | 0.59 | |
| GGA/PW91 OBS | 4.1207 | 4.1207 | 11.3829 | 167.39 | −7.39 | −7.39 | −3.56 | 6.11 | −17.28 | |
| GGA/WC | 4.3470 | 4.3470 | 11.7318 | 191.99 | −2.30 | −2.30 | −0.61 | 1.74 | −5.13 | |
| GGA/PBESOL | 4.3485 | 4.3485 | 11.7506 | 192.42 | −2.27 | −2.27 | −0.45 | 1.66 | −4.91 | |
| LDA/CA-PZ | 4.3232 | 4.3232 | 11.7395 | 190.01 | −2.83 | −2.83 | −0.54 | 2.07 | −6.10 | |
| Experimenta | 4.4493 | 4.4493 | 11.8037 | 202.36 | — | — | — | — | — | |
| Gamma | GGA/PBE | 5.4353 | 7.4258 | 5.7705 | 232.90 | 1.02 | 0.95 | −0.08 | 0.68 | 1.90 |
| GGA/PBE TS | 5.3231 | 7.2697 | 5.6682 | 219.34 | −1.07 | −1.17 | −1.85 | 1.36 | −4.03 | |
| GGA/PBE Grimme | 5.3743 | 7.2743 | 5.7120 | 223.31 | −0.12 | −1.10 | −1.09 | 0.77 | −2.30 | |
| GGA/RPBE | 5.4523 | 7.4830 | 5.8032 | 236.77 | 1.33 | 1.73 | 0.49 | 1.18 | 3.59 | |
| GGA/PW91 | 5.4257 | 7.4043 | 5.7626 | 231.50 | 0.84 | 0.66 | −0.22 | 0.57 | 1.29 | |
| GGA/PW91 OBS | 5.2854 | 7.1309 | 5.5550 | 209.36 | −1.77 | −3.05 | −3.81 | 2.88 | −8.40 | |
| GGA/WC | 5.4284 | 7.3670 | 5.7313 | 229.20 | 0.89 | 0.16 | −0.76 | 0.60 | 0.28 | |
| GGA/PBESOL | 5.4367 | 7.3879 | 5.7407 | 230.58 | 1.04 | 0.44 | −0.60 | 0.69 | 0.88 | |
| LDA/CA-PZ | 5.4295 | 7.3516 | 5.7263 | 228.57 | 0.91 | −0.05 | −0.85 | 0.60 | 0.00 | |
| Experimenta | 5.3806 | 7.3555 | 5.7751 | 228.56 | — | — | — | — | — | |
According to the above analysis, GGA/PW91 method without dispersion correction was selected to calculate the Li-doped AlH3 crystals in this work because of its superior overall performance for both α and γ polymorphs.
3.2 Crystal structures of Li-doped AlH3 and potential energy surface of phase transition
According to the original α- and γ-AlH3 crystal structures from ref. 13 and 30, α- and γ-supercells of Al12H36, Al23LiH70 and Al11LiH34 were built and optimized respectively (Fig. 1). To generate each Li-doped supercell from the pure AlH3 crystal, one Al atom were replaced by Li and two H atoms near Li were removed in consideration of valence balance. In below discuses, the energies are in terms of per mole AlLixH(3+x). The AlLixH(3+x) is pure aluminum hydride when the x = 0, and the doping contents increases as x goes from 1/23 to 1/11.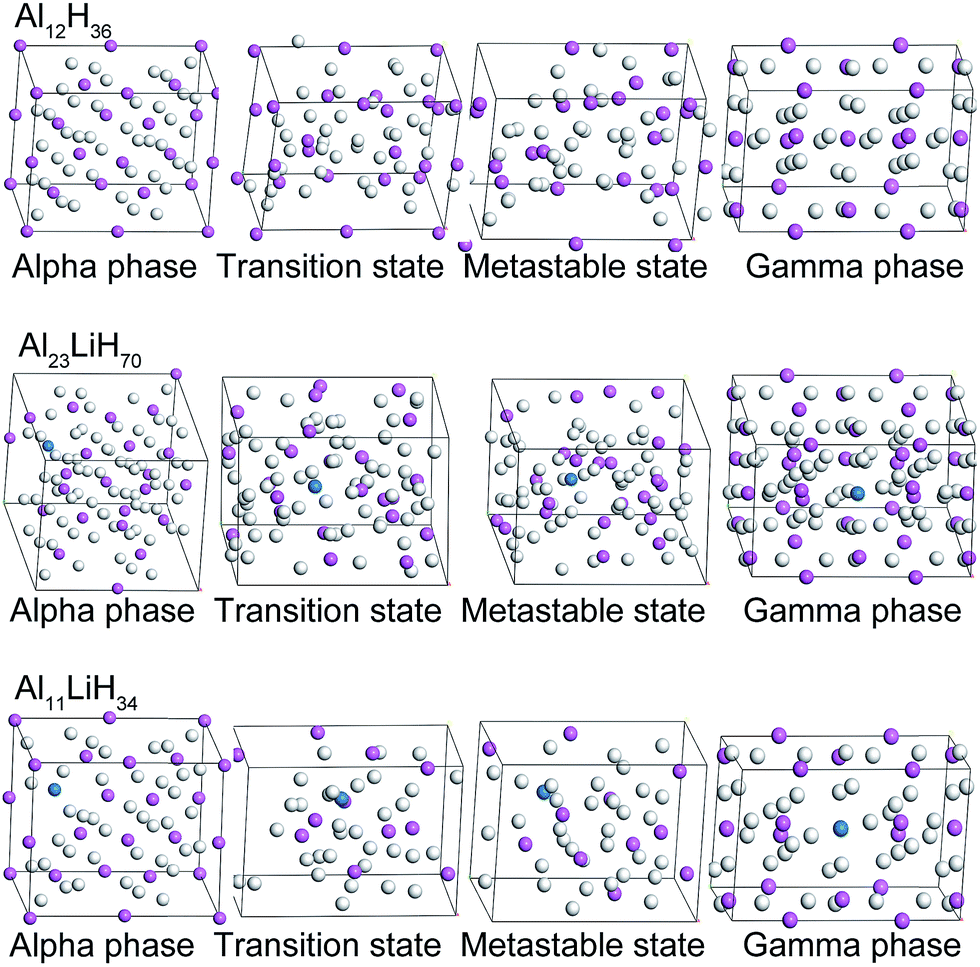 | ||
| Fig. 1 Optimized α- and γ-Al12H36, Al23LiH70 and Al11LiH34 supercells, as well as the corresponding structures of the transition states and metastable states. | ||
Due to the smaller size and fewer bonding orbitals of Li than Al atom, the doping of Li generates a local hole of electron density in the supercells and influences the energy evolution in phase transition. Using linear synchronous transit (LST) method with quadratic synchronous transit (QST) algorithm, the minimum energy paths of the transition between alpha and gamma phases of Al12H36, Al23LiH70 and Al11LiH34 supercells were calculated by CASTEP program. As can be seen in Fig. 2, the maximum energies in the transition paths for Al12H36, Al23LiH70 and Al11LiH34 supercells are 547.49, 522.69 and 394.35 kJ mol−1, respectively, which are corresponding to the transition states shown in Fig. 1. The comparison reveals that the activation energy of the phase transition decreases as the doping content increases, indicating that the doping of Li atoms makes the transition easier. Besides, the energies of metastable states in the transition are also shown. Interestingly, the number of the metastable states increases as the doping content increases. The most significant metastable state for each doping content was noted in Fig. 2. The total energies of metastable states decrease as the doping content increases, just as the activation energy.
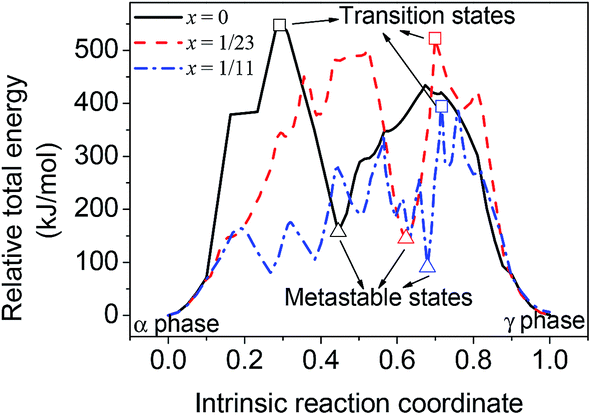 | ||
| Fig. 2 Calculated energy evolution of the phase transition for AlLixH(3+x), x = 0, 1/23 and 1/11. | ||
3.3 Density of phonon states, internal energy and Gibbs free energy
Fig. 3 demonstrates the density of phonon states (DOS) of α- and γ-AlLixH(3+x) supercells, as well as the partial DOS (PDOS) for Al, Li and H atoms. The phonon PDOS of Al and Li locate in 0–500 cm−1, while those of H locate in the range of 500–2200 cm−1. In both α- and γ phase supercells, the Al and Li atoms make main contributions to low frequencies phonon while H atoms make main contributions to high frequencies phonon. | ||
| Fig. 3 Calculated full and partial density of phonon states for α- and γ-AlLixH(3+x) supercells, x = 0, 1/23 and 1/11. | ||
Phonon is a quantitative characterization of vibration in crystals. The atoms in crystal can vibrate and spread the vibration in terms of different modes, depending on the different periodic arrangements and interaction strengths. Also, phonon wave can scatter at the interface or defect area and results in energy exchange.
As the doping content increases, the high frequency peaks in γ-AlH3 are split. Some Al–H interaction strengths were enhanced and led to higher frequencies, while some other interaction strengths were weaken and led to lower frequencies. This implies that the doping of Li atoms causes a reduced symmetry of the crystals. The excitation or ionization of the Li atoms can be a good channel for the phonon scattering, results in a rearrangement of near atoms. This is a driving force for the γ–α transition of AlLixH(3+x).
In addition, it is well known that phase transition involves the cleavage and reform of the chemical bonds, because the different polymorphs usually contain different atomic configurations. The bond breaking is the key step in overcoming the energy barriers. Researchers have point out that the ‘up pumping’ of low frequency phonon plays an important role in the cleavage of the bonds.31,32 The magnitude of vibration modes of low frequency is positively related to the energy transfer rate for lattice vibration to bond breaking. Therefore, the low frequency phonon modes by the Li-doping have played an important role to facilitate the bond breaking and to lower the phase transition temperature. This agrees with the activation energy calculation shown in Fig. 2.
With the neglecting of electronic excitation, lattice vibration makes full contribution to the thermodynamic properties of crystals. Due to the wave spreading of the vibrations, every vibrational mode is delocalized in the crystal and makes individual contribution to the thermodynamic properties such as zero point energy (ZPE) and vibrational enthalpy (HV). According to Boltzmann's energy distribution, a vibrational mode with frequency ωi contributes a ZPE = ℏωi/2 and a HV = ℏωi/(exp(ℏωi/kT) − 1). Based on the phonon DOS and the optimized configuration energy (EC), the zero point vibrational energy (ZPE), internal energy (U) and Gibbs free energy (G) at 380 K, as well as the enthalpy change and Gibbs free energy change (ΔHγ→α and ΔGγ→α) of γ → α phase transition at 298 and 380 K were obtained and listed in Table 2. All the EC, U, and G values decrease as x increases. The values of ΔHγ→α and ΔGγ→α also decrease as x increases. Especially the decreasing of ΔGγ→α implies that the γ → α phase transition becomes easier as more Li atoms are doped. Besides, the ΔHγ→α and ΔGγ→α change slightly as the temperature changes from 298 to 380 K, while the doping content is the critical factor influences them.
| x | Phase | EC (eV mol−1) | ZPE (eV mol−1) | U298 (eV mol−1) | G298 (eV mol−1) | U380 (eV mol−1) | G380 (eV mol−1) | ΔHγ→α,298 (kJ mol−1) | ΔGγ→α,298 (kJ mol−1) | ΔHγ→α,380 (kJ mol−1) | ΔGγ→α,380 (kJ mol−1) |
|---|---|---|---|---|---|---|---|---|---|---|---|
| 0 | α | −105.2247 | 0.6717 | −104.4910 | −104.5901 | −104.4554 | −104.6240 | 1.58 | 1.74 | 0.87 | 1.99 |
| γ | −105.2262 | 0.6592 | −104.5074 | −104.6081 | −104.4644 | −104.6446 | |||||
| 1/23 | α | −106.1969 | 0.6686 | −105.4670 | −105.5698 | −105.4221 | −105.6071 | −0.86 | −0.17 | −0.87 | 0.04 |
| γ | −106.1850 | 0.6635 | −105.4580 | −105.5680 | −105.4131 | −105.6075 | |||||
| 1/11 | α | −107.3160 | 0.6724 | −106.5773 | −106.6897 | −106.5301 | −106.7303 | −5.72 | −5.38 | −5.62 | −5.30 |
| γ | −107.2520 | 0.6677 | −106.5180 | −106.6339 | −106.4718 | −106.4661 |
It is worth noting that the ΔHγ→α and ΔGγ→α are positive for pure AlH3, which is agreed with an earlier calculation.10 However, it has been reported that the ΔHγ→α is −2.8 ± 0.4 kJ mol−1 at about 380 K in the experiments2,3 which is contradict to our calculated positive ΔHγ→α for pure AlH3. However, the sign of ΔHγ→α in experiment was consistent with the ΔHγ→α (−0.87 and −5.62 kJ mol−1) of Al23LiH70 and Al11LiH34. The ΔGγ→α and ΔHγ→α are significant parameters. The former indicates the direction of phase transition, while the latter determines the heat release or absorption. Their signs (plus or minus) are not inverted by the approximation error or measuring error. Therefore, the synthesis of γ-AlH3 in experiments may bring about Li-doping in AlH3 that was unable to be detected in XRD due to low content of Li.2,3
Fig. 4 represents the ΔGγ→α and ΔHγ→α over the temperature range of 0–500 K for AlLixH(3+x) (x = 0, 1/23 and 1/11). The calculated ΔHγ→α of pure AlH3 is positive at 0 to 500 K, which indicates that the pure AlH3 will absorb energy in γ → α phase transition. The absolute value of ΔGγ→α decreases as the temperature increases implies that the γ to α phase transition is favorable at relatively lower temperature. But the experiments revealed that the γ → α phase transition occurred when the γ phase was heated to about 380 K. This indicates that the γ → α phase transition must overcome an energy barrier. On the other hand, it is also revealed that the transition enthalpy change of experiment is between those of Al23LiH70 and Al11LiH34.
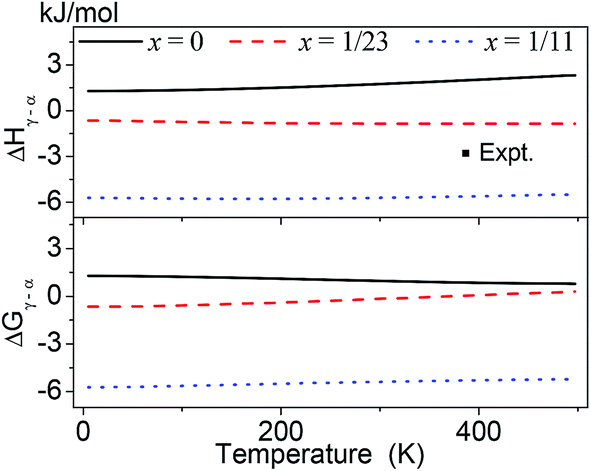 | ||
| Fig. 4 Calculated Gibbs free energy change ΔGγ→α and enthalpy change ΔHγ→α over the temperature range of 0–500 K for AlLixH(3+x) (x = 0, 1/23 and 1/11). The experimental data (−2.8 kJ mol−1 at 380 K) was taken from ref. 2 and 3. | ||
3.4 Heat capacity
Using the phonon DOS, the heat capacity CP(T) of pure and Li-doped α-AlH3 were calculated and represent in Fig. 5. The experimental CP(T) for α-AlH3 (41.14 J mol−1 K−1 at 298.15 K (ref. 33) and 45.22 J mol−1 K−1 at 320.65 K (ref. 34)) were also shown for comparison. The heat capacity increases as x increases, which is caused by the Li-doping that introduces new vibrational modes. In Fig. 5, the experimental CP(T) are significantly larger than those of pure AlH3 (x = 0), but is close to those of AlLixH(3+x) of x = 1/23. Again, this indicated that the experiments probably brought about Li-doping in AlH3.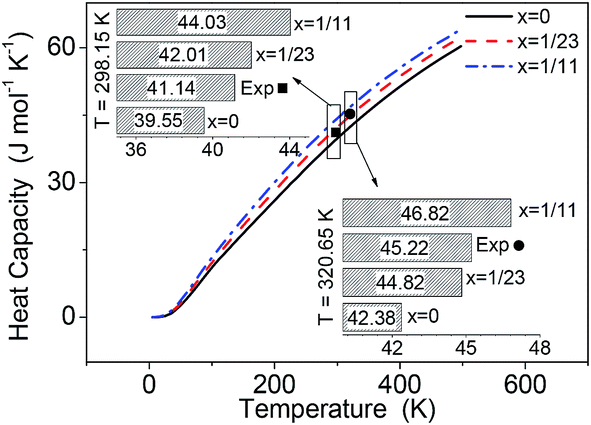 | ||
| Fig. 5 Calculated heat capacity of α-AlLixH(3+x) (x = 0, 1/23 and 1/11) over the temperature range of 0–500 K, comparing with the experimental values.33,34 | ||
4. Conclusions
The benchmark calculations for α- and γ-AlH3 showed that the GGA/PW91 method guarantees accurate lattice parameters with 0.51% mean absolute error. The relative energy evolution of the phase transitions for AlLixH(3+x) (x = 0, 1/23, 1/11) indicated that the introduction of more Li leads to a smaller activation energy for the transition. The calculated full and partial density of phonon states (DOS and PDOS) revealed that the Li-doping breaks the symmetry of crystal, introduces new vibrational modes, thus increases the heat capacity.Using the phonon DOS, the enthalpy change (ΔHγ→α) and the Gibbs free energy change (ΔGγ→α) in γ → α phase transition were estimated. Results showed that the γ → α transition of pure AlH3 absorbs energy, which is contrary to the experiments. However, the γ → α transition of Li-doped AlH3 with negative ΔHγ→α and ΔGγ→α values agrees with the experiments. The heat capacity calculation revealed that the CP(T) is close to the experimental value when the crystal is AlLixH(3+x) with x = 1/23.
Based on the above analysis and the experiment condition for AlH3 preparation, the aluminum hydride synthesized by the reaction of LiAlH4 + AlCl3 in experiments is likely to be Li-doped AlH3 (Fig. 1) instead of pure one. This can explain the contradiction between the theoretical prediction and the experiments for the phase transition. Besides, pure AlH3 has smaller heat capacity and larger γ → α phase transition enthalpy than those of Li-doped ones.
Conflicts of interest
There are no conflicts to declare.Acknowledgements
Z. Mei thanks the Innovation Project for Postgraduates in Universities of Jiangsu Province.References
- P. Vajeeston, P. Ravindran and H. Fjellvag, Chem. Mater., 2008, 20, 5997–6002 CrossRef CAS.
- J. Graetz and J. J. Reilly, J. Alloys Compd., 2006, 424, 262–265 CrossRef CAS.
- J. Graetz, J. J. Reilly, J. G. Kulleck and R. C. Bowman, J. Alloys Compd., 2007, 446, 271–275 CrossRef.
- S. J. Hwang, R. C. Bowman, J. Graetz, J. J. Reilly, W. Langley and C. M. Jensen, J. Alloys Compd., 2007, 446, 290–295 CrossRef.
- W. X. Feng, S. X. Cui and M. Feng, J. Phys. Chem. Solids, 2014, 75, 803–807 CrossRef CAS.
- Y. J. Wang, Z. X. Li, H. Y. Yu and C. G. Feng, Prog. Chem., 2016, 28, 1689–1704 Search PubMed.
- C. J. Pickard and R. J. Needs, Phys. Rev. B: Condens. Matter Mater. Phys., 2007, 76, 5 CrossRef.
- P. Vajeeston, P. Ravindran and H. Fjellvag, J. Phys. Chem. A, 2011, 115, 10708–10719 CrossRef CAS PubMed.
- C. W. Duan, L. X. Hu, Y. Sun and Z. P. Wan, RSC Adv., 2016, 6, 74215–74224 RSC.
- X. Z. Ke, A. Kuwabara and I. Tanaka, Phys. Rev. B: Condens. Matter Mater. Phys., 2005, 71, 7 Search PubMed.
- C. Liu, N. Wang and S. P. Huang, Int. J. Hydrogen Energy, 2016, 41, 16966–16973 CrossRef CAS.
- H. W. Brinks, W. Langley, C. M. Jensen, J. Graetz, J. J. Reilly and B. C. Hauback, J. Alloys Compd., 2007, 433, 180–183 CrossRef CAS.
- V. A. Yartys, R. V. Denys, J. P. Maehlen, C. Frommen, M. Fichtner, B. M. Bulychev and H. Emerich, Inorg. Chem., 2007, 46, 1051–1055 CrossRef CAS PubMed.
- F. M. Brower, N. E. Matzek, P. F. Reigler, H. W. Rinn, C. B. Roberts, D. L. Schmidt, J. A. Snover and K. Terada, Chem. Informationsdienst, 1976, 7, 28 Search PubMed.
- A. Gil, V. Branchadell and M. J. Calhorda, RSC Adv., 2016, 6, 85891–85902 RSC.
- T. M. Dunster, A. Gil, J. Segura and N. M. Temme, Comput. Phys. Commun., 2017, 217, 193–197 CrossRef CAS.
- A. H. Reshak, RSC Adv., 2016, 6, 51675–51682 RSC.
- A. H. Reshak, J. Alloys Compd., 2017, 711, 229–234 CrossRef CAS.
- A. H. Reshak, Mater. Chem. Phys., 2017, 192, 260–267 CrossRef CAS.
- J. P. Perdew, K. Burke and M. Ernzerhof, Phys. Rev. Lett., 1996, 77, 3865–3868 CrossRef CAS PubMed.
- J. P. Perdew and W. Yue, Phys. Rev. B: Condens. Matter Mater. Phys., 1992, 45, 13244–13249 CrossRef.
- B. Hammer, L. B. Hansen and J. K. Norskov, Phys. Rev. B: Condens. Matter Mater. Phys., 1999, 59, 7413–7421 CrossRef.
- J. P. Perdew, A. Ruzsinszky, G. I. Csonka, O. A. Vydrov, G. E. Scuseria, L. A. Constantin, X. L. Zhou and K. Burke, Phys. Rev. Lett., 2008, 100, 4 CrossRef PubMed.
- Z. G. Wu and R. E. Cohen, Phys. Rev. B: Condens. Matter Mater. Phys., 2006, 73, 6 Search PubMed.
- S. J. Clark, M. D. Segall, C. J. Pickard, P. J. Hasnip, M. J. Probert, K. Refson and M. C. Payne, Z. Kristallogr., 2005, 220, 567–570 CAS.
- S. Baroni, S. de Gironcoli, A. Dal Corso and P. Giannozzi, Rev. Mod. Phys., 2001, 73, 515–562 CrossRef CAS.
- A. Tkatchenko and M. Scheffler, Phys. Rev. Lett., 2009, 102, 4 CrossRef PubMed.
- S. Grimme, J. Comput. Chem., 2006, 27, 1787–1799 CrossRef CAS PubMed.
- F. Ortmann, F. Bechstedt and W. G. Schmidt, Phys. Rev. B: Condens. Matter Mater. Phys., 2006, 73, 10 CrossRef.
- P. Vajeeston and H. Fjellvag, Emerging Mater. Res., 2015, 4, 192–217 CrossRef CAS.
- D. D. Dlott and M. D. Fayer, J. Chem. Phys., 1990, 92, 3798–3812 CrossRef CAS.
- S. J. Ye, K. Tonokura and M. Koshi, Combust. Flame, 2003, 132, 240–246 CrossRef CAS.
- K. S. Gavrichev, V. E. Gorbunov, S. I. Bakum, V. M. Gurevich and A. D. Izotov, Inorg. Mater., 2002, 38, 661–664 CrossRef CAS.
- N. Li, F. Q. Zhao, Y. Luo, H. X. Hao, H. X. Gao, E. G. Yao, L. B. Xiao, R. Z. Hu and J. H. Yi, J. Therm. Anal. Calorim., 2015, 120, 1847–1851 CrossRef CAS.
| This journal is © The Royal Society of Chemistry 2017 |