 Open Access Article
A highly sensitive electrochemical IFN-γ aptasensor based on a hierarchical graphene/AuNPs electrode interface with a dual enzyme-assisted amplification strategy†
Yu Yin *a,
Lei Shi
 b,
Zhenyu Chu
 c and
Wanqin Jin
 *c
*c
aSchool of Environmental and Chemical Engineering, Jiangsu University of Science and Technology, Zhenjiang 212003, P. R. China. E-mail: season_july@just.edu.cn; Tel: +86-511-85637630
bState Key Laboratory of Lake Science and Environment, Nanjing Institute of Geography and Limnology, Chinese Academy of Sciences, Nanjing 210008, P. R. China
cState Key Laboratory of Materials-Oriented Chemical Engineering, College of Chemical Engineering, Nanjing Tech University, Nanjing 210009, P. R. China. E-mail: wqjin@njtech.edu.cn; Fax: +86-25-83172292; Tel: +86-25-83172266
First published on 21st September 2017
Abstract
In this work, we have developed a new electrochemical aptasensor for IFN-γ assay, based on a hierarchical graphene/AuNPs modified electrode coupled with a dual enzyme-assisted signal amplification strategy. The graphene/AuNPs modified electrode with a large specific area, high conductivity, excellent stability and biocompatibility was used for the immobilization of plentiful duplex DNA strands of capture probes and IFN-γ aptamers. In the presence of IFN-γ, hybridized aptamers were released from the electrode surface due to the formation of aptamer/IFN-γ complexes. Meanwhile, aptamers were digested with RecJf exonuclease and IFN-γ was available for target recycling, creating numerous free capture probes on the electrode surface. Then the hybridization chain reaction was initiated with the help of linker probes and biotin-labeled reporter probes. Thus cascade duplex DNA polymers were produced on the electrode surface, providing lots of binding sites for streptavidin–alkaline phosphatase to generate robust enzyme-catalyzed signals. Due to this dual enzyme-assisted amplification strategy, the prepared aptasensor exhibited a wide linear range from 5 pM–5 nM with an ultralow detection limit of 2 pM (S/N = 3). Besides, the aptasensor showed an excellent selectivity, satisfactory reproducibility and stability, and a great potential in serum analysis. Importantly, the versatility of the designed sensing strategy makes it easily extended for analyzing other biomolecules.
Introduction
As a typical cytokine secreted by a number of immune cells, such as thymus-derived and natural killer cells, interferon-gamma (IFN-γ) has played a critical role in the development of pleural effusion of tuberculosis, and served as a diagnostic immune response marker.1,2 Due to its significance in the immune system, the development of sensitive and specific methods for IFN-γ detection is critically important for immunology research and medical diagnosis. Although antibody based immunosensors could realize an effective IFN-γ assay, they usually suffer from a low stability, high cost and complicated preparation procedure, making them unsuitable for routine and rapid analysis.3–5 Comparing with the conventional antibody, aptamers have special properties of high affinity and specificity toward extensive targets,6,7 e.g. small molecules,8,9 biological proteins,10–12 cells13 and heavy metal ions.14,15 Electrochemical aptasensors have received enormous interest due to their simplicity, low cost, portability and easy miniaturization,16 opening a new horizon for developing simple and sensitive methods for IFN-γ detection. For examples, based on the conformational change of methylene blue attached aptamers, Liu et al. developed an electrochemical IFN-γ aptasensor and a detection limit of 60 pM with a linear range from 0.06–10 nM was obtained.17 Besides, Zhang et al. described a label-free method for electrochemical assay of IFN-γ by incorporating a specific DNAzyme sequence into a hairpin aptamer probe.18 Accordingly, a detection limit of 100 pM with a linear range from 0.1–10 nM was achieved. Although reliable assays of IFN-γ were realized with these biosensors, desired IFN-γ aptasensors with lower detection limits are extremely demanded considering that IFN-γ presents at ultralow levels during the early stages of disease progress. Moreover, Yan et al. reported a highly sensitive electrochemical aptasensing technology for IFN-γ detection, realizing an ultralow detection limit of 65 fM.19 However, comparing with relatively wide linear ranges in previous work, the narrow detection range from 0.1–0.7 pM was not favorable for its application in real analysis. As a consequence, it still remains a challenge to construct novel electrochemical IFN-γ aptasensors with both high sensitivity and wide linear ranges.To construct sensitive electrochemical biosensors, the preparation of nanomaterial modified electrodes is favorable to immobilize amounts of biomolecules on the sensing interfaces, further improving the analytical performance.20–22 Nanocomposites of graphene and gold nanoparticles (AuNPs) have attracted great attention in electrochemical biosensing, due to their high electrical conductivity, large specific surface area and excellent biocompatibility arising from synergistic effect of individual materials.23–26 Recently, several strategies have been developed for preparing graphene/AuNPs modified electrodes, such as physical transfer method,27–29 chemical vapor deposition30 and interfacial self-assembly.31,32 However, a weak binding stability of nanocomposites on electrode surfaces, expensive instruments or complicated operation and preparation processes are observed and required with these methods, severally hindering their performance improvement and wide applications. Alternatively, the electrodeposition is a more convenient and effective method,33–35 in which graphene oxide and chloroauric acid can be simultaneously reduced and directly deposited on an electrode surface. Such graphene/AuNPs modified electrodes have been widely used to construct electrochemical biosensors for the detection of procalcitonin,35 DNA sequences36 and endonuclease,37 achieving significantly enhanced sensitivities. Due to the attractive properties, it is highly inspired to develop sensitive electrochemical IFN-γ aptasensors using electrodeposited graphene/AuNPs modified electrodes.
Besides, signal amplification strategies have been designed to significantly improve the detectability of electrochemical biosensors. On one hand, nuclease-induced cleavage offers a new tool for constructing sensitive biosensors, in which target recycle is realized to achieve the signal amplification.38–40 Comparing with the requirement of a specific nicking sequence with endonucleases, RecJf exonuclease is single-stranded DNA specific enzyme and digests the appointed DNA strands.41–43 This advantage makes it a promising candidate to design versatile signal amplification strategies for various analytes, such as oligonucleotides, proteins and small organic molecules. On the other hand, hybridization chain reaction (HCR) has been widely applied to enhance response signals.44–47 The DNA molecules can be programmed to self-assemble into nicked cascaded structures analogous to alternating copolymers, forming plentiful binding sites for electroactive indicators. Besides, the mild conditions required for HCR make it an attractive signal amplification strategy in sensing applications. Although nuclease-induced target recycling and HCR have been extensively used for signal amplification, few efforts have been dedicated to constructing high-performance IFN-γ aptasensor integrating these two favorable strategies.
In this work, we have reported a novel electrochemical aptasensor for IFN-γ detection, based on a hierarchical graphene/AuNPs electrode interface with dual enzyme-assisted amplification strategy. The hierarchical graphene/AuNPs film with excellent properties was in situ electrodeposited on the electrode and served for the immobilization of the duplex DNA strands of capture probes and IFN-γ aptamers. The presence of IFN-γ and RecJf exonuclease triggered the release and digestion of aptamers, resulting in the recycle of IFN-γ and liberation of capture probes. The linker probes and two biotin-labeled report probes led to the formation of cascaded DNA duplex polymers through HCR on the electrode surface. Then numerous electroactive indicators of streptavidin–alkaline phosphatase were efficiently introduced into DNA polymers, creating significantly enhanced enzyme-catalyzed signals. Through the dual enzyme-assisted amplification strategy on a hierarchical graphene/AuNPs electrode interface, a highly sensitive electrochemical assay for IFN-γ was realized.
Experimental
Materials and agents
The oligonucleotides were synthesized by Sangon Biotech. Co, Ltd (Shanghai, China), and the sequences are listed in Table S1.† Recombinant human IFN-γ, chloroauric acid (HAuCl4), hexanethiol (HT), streptavidin–alkaline phosphatase (ST–AP), α-naphthyl phosphate (α-NP), and tris (hydroxymethyl) aminomethane (Tris-base) were purchased from the Sigma-Aldrich. RecJf exonuclease was supplied from New England Biolabs. All other chemicals used were all of analytical grade, and triple distilled water was used throughout the work.The buffers employed in the study were: 20 mM Tris–HCl buffer (pH 7.4) containing 140 mM NaCl, 5 mM KCl and 1 mM MgCl2 for dissolving capture probes, aptamers and IFN-γ; 0.01 M phosphate buffered solution (PBS, pH 7.4) containing 10 mM Na2HPO4, 10 mM NaH2PO4 and 100 mM NaCl for washing the sensing interfaces; diethanolamine buffer (DEA, pH 9.6) containing 0.1 M DEA, 1 M MgCl2 and 0.1 M KCl for electrochemical measurements.
Preparation of graphene/AuNPs modified electrode
GO was firstly prepared according to modified Hummers' methods, as reported in our previous work.31 Prior to use, the glass carbon electrode (GCE) was successively polished with 0.3 and 0.05 μm alumina powders, and then ultrasonicated with ethanol and water. Afterwards, GCE was electrochemically scanning in 0.5 M H2SO4 until a stable cyclic curve was obtained. For the electrodeposition of graphene/AuNPs film on GCE, a carbonate buffer solution containing 1.0 mg mL−1 GO and 100 μM HAuCl4 was prepared, the cyclic voltammetry was performed between −1.5 and 0.6 V at a rate of 25 mV s−1 for 5 cycles, accompanying with magnetic stirring and N2 bubbling.33 After the electrodeposition, the modified electrode was throughly washed with distilled water.Construction of the electrochemical IFN-γ aptasensor
The duplex DNA strands were firstly prepared through mixing the capture probes (5.0 μM) and aptamers (5.0 μM) in the annealing buffer, which was heated to 95 °C for 15 min and cooled to room temperature. Then, 20 μL solution of duplex DNA strands was dropped on graphene/AuNPs modified electrode surface and incubated for 12 h at room temperature. Afterwards, the modified electrode was treated with 10 μL HT solution (1 mM) for 2 h to remove the physically adsorbed molecules. Subsequently, the modified electrode was incubated with a mixture solution containing different IFN-γ concentrations and RecJf exonuclease (0.5 unit per μL) for 2 h. After washing with buffer solution, 20 μL linker probes (5.0 μM) were added on the electrode surface for 1 h. Finally, the electrode was immersed into the solution containing report probe-I (1 μM) and report probe-II (1 μM) for 90 min to trigger the HCR. Finally, 10 μL ST–AP solution containing 1% BSA was dropped onto the electrode surface and incubated at 37 °C for 30 min, followed by thoroughly washing for subsequent electrochemical measurements.Characterizations and electrochemical measurements
Surface morphologies of prepared graphene oxide and graphene/AuNPs film were investigate with field-emission scanning electron microscopy (FESEM, Hitachi S4800). Transmission electron microscopy (TEM) and high resolution TEM (HRTEM) analyses were conducted on a JEM 3010 TEM system using an accelerating voltage of 200 kV. X-ray diffraction (XRD) was performed on an X-ray diffractometer (D/MAX 2500 V/PC) with a Cu-Kα line, λ = 0.15419 nm. X-ray photoelectron spectroscopy (XPS) was measured on a ESCAlab MKII spectrometer using Al-Kα as the irradiation source. Raman spectra were collected on a LabRAM-1B microscope Raman system equipped with a 532 nm laser source. UV-vis spectra were recorded with a UV 3600 spectrophotometer (Shimadzu, Kyoto, Japan). Cyclic voltammetry (CV), differential pulse voltammetry (DPV) and electrochemical impedance spectroscopy (EIS) measurements were operated with a CHI 660E electrochemical workstation using a three-electrode system. The supporting electrolyte of 5 mM K3Fe(CN)6/K4Fe(CN)6 solution containing 0.5 M KCl was employed for EIS measurements. DPV was implemented with a modulation amplitude of 70 mV, a scan rate of 10 mV s−1, a pulse amplitude of 20 mV, and potential scan from 0 to 0.5 V. To ensure the reliability of results, each measurement was performed in triplicate.Results and discussion
Characterizations of graphene/AuNPs film on GCE
Comparing with the GO with typically wrinkled structures (Fig. 1A), a hierarchical and homogeneous graphene/AuNPs film was successfully produced on the GCE surface via the electrodeposition method, as illustrated in Fig. 1B. Highly dispersed AuNPs are distinctly observed on the transparent graphene sheets. Meanwhile, TEM image clearly reveals a layered structure of the graphene/AuNPs nanocomposite (Fig. 1C). The large AuNPs with diameters from 10–15 nm were tightly confined on the graphene sheets, indicating that an intense interaction between AuNPs and graphene was formed. With a high magnification focused on the surface (Fig. 1D), numerous smaller AuNPs with diameters from 3–5 nm were uniformly attached on the graphene surface. This result is similar with that reported in the literature.37 Furthermore, a typical HRTEM image of the AuNP is presented in the inset of Fig. 1D. The lattice spacing of ∼0.235 nm corresponds to the (111) plane of face-centered cubic (fcc) structure of AuNPs. Obviously, the attractive structure of graphene/AuNPs film on GCE is beneficial to realize a high specific area and provide sufficient binding sites for the immobilization of biomolecules.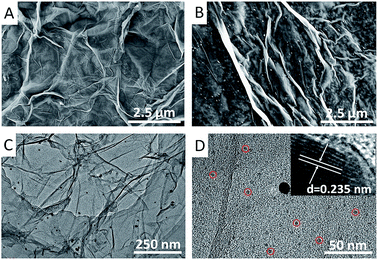 | ||
| Fig. 1 FESEM images of (A) GO and (B) electrochemically deposited graphene/AuNPs film on the GCE. (C) and (D) TEM images of graphene/AuNPs nanocomposites, inset: HRTEM image of an Au nanoparticle. | ||
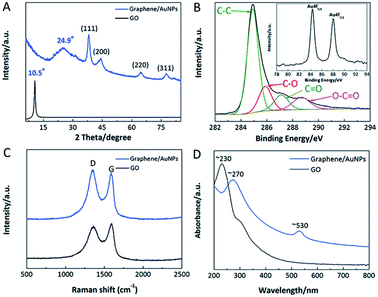
The XRD patterns of GO and graphene/AuNPs film are shown in Fig. 2A. In contrast to a sharp peak at ∼10.5° of GO, a broad XRD peak at ∼24.9° of graphene/AuNPs film is attributed to electrochemically reduced graphene sheets.48 It is revealed that few-layer stacked graphene sheets were poorly ordering along their stacking direction, and the reduction of GO resulted in an obvious decrease in interlayer spacing. Besides, the characteristic peaks at ∼38.3, 44.3, 64.8 and 77.7° belong to fcc Au, corresponding to the (111), (200), (220) and (311) faces respectively.12 Fig. 2B shows the C 1s and Au 4f XPS spectra of graphene/AuNPs film. Comparing with the C 1s XPS spectrum of GO (shown in Fig. S1†), the peak associated with C–C became predominant, and remarkably decreased peaks relating to C–O, C![[double bond, length as m-dash]](https://www.rsc.org/images/entities/char_e001.gif) O and O–C
O and O–C![[double bond, length as m-dash]](https://www.rsc.org/images/entities/char_e001.gif) O were observed on the graphene/AuNPs film.31 It is confirmed that effective removal of most oxygenous groups was realized upon the electrochemical reduction. As suggested in inset of Fig. 2B, Au 4f peaks (4 f7/2 and 4 f5/2) locate at ∼83.7 eV and 87.6 eV respectively, demonstrating that produced AuNPs consist of metallic Au0. Furthermore, the results of XRD and XPS indicate that a small quantity of oxygenous groups remain on the graphene/AuNPs film. These hydrophilic groups were favourable for the effective anchoring of AuNPs on graphene sheets, and would improve the immobilization capacity and recognition efficiency of nanocomposite film towards biological molecules. Raman spectra of GO and graphene/AuNPs film were depicted in Fig. 2C. The characteristic peaks located at ∼1355 cm−1 (D band) and 1589 cm−1 (G band) are attributed to the defects in the hexagonal carbon ring and the first-order scattering of E2g mode assigned for the stretching of C–C bonds.49 Comparing with that of GO, an increased ID/IG value was acquired in the graphene/AuNPs film, indicating that additional quasi-amorphous sp2-bonded carbon domains were produced. Moreover, Fig. 2D depicts the UV-vis spectra of GO and graphene/AuNPs. GO exhibits a representative absorption peak at ∼230 nm, while electro-reduction of GO resulted in a red shift to ∼270 nm, indicating the formation of graphene.50 After the formation of AuNPs, a new broad absorption peak at ∼530 nm was observed, which is corresponded to the plasmon resonance band of AuNPs on the graphene sheets.
O were observed on the graphene/AuNPs film.31 It is confirmed that effective removal of most oxygenous groups was realized upon the electrochemical reduction. As suggested in inset of Fig. 2B, Au 4f peaks (4 f7/2 and 4 f5/2) locate at ∼83.7 eV and 87.6 eV respectively, demonstrating that produced AuNPs consist of metallic Au0. Furthermore, the results of XRD and XPS indicate that a small quantity of oxygenous groups remain on the graphene/AuNPs film. These hydrophilic groups were favourable for the effective anchoring of AuNPs on graphene sheets, and would improve the immobilization capacity and recognition efficiency of nanocomposite film towards biological molecules. Raman spectra of GO and graphene/AuNPs film were depicted in Fig. 2C. The characteristic peaks located at ∼1355 cm−1 (D band) and 1589 cm−1 (G band) are attributed to the defects in the hexagonal carbon ring and the first-order scattering of E2g mode assigned for the stretching of C–C bonds.49 Comparing with that of GO, an increased ID/IG value was acquired in the graphene/AuNPs film, indicating that additional quasi-amorphous sp2-bonded carbon domains were produced. Moreover, Fig. 2D depicts the UV-vis spectra of GO and graphene/AuNPs. GO exhibits a representative absorption peak at ∼230 nm, while electro-reduction of GO resulted in a red shift to ∼270 nm, indicating the formation of graphene.50 After the formation of AuNPs, a new broad absorption peak at ∼530 nm was observed, which is corresponded to the plasmon resonance band of AuNPs on the graphene sheets.
Cyclic voltammetry (CV) and electrochemical impedance spectroscopy (EIS) measurements were adopted to explore the electrochemical properties of graphene/AuNPs film. As revealed in Fig. S2A,† in contrast to a low oxidation current of the bare GCE, gradually enhanced response currents were achieved on the graphene and graphene/AuNPs modified electrodes. Meanwhile, perceptible decreases of peak-to-peak separation (ΔEp) from ∼98.1 mV of GCE to 82.7 mV of graphene/AuNPs film were obtained, suggesting a faster electron transfer rate between the redox indicators and the electrode surface. Obviously, the formation of nanocomposite film on GCE surface significantly increases its specific surface area and conductivity due to the synergistic effect from graphene and AuNPs. To assess the structural stability of graphene/AuNPs film on the GCE surface, the modified electrode was consecutively scanned for 20 cycles in the solution (inset in Fig. S2A†). The resulting oxidation peak currents were recorded and an acceptable change of ∼3.7% was obtained, showing an excellent structural stability of nanocomposite film on the GCE surface. Besides, EIS was adopted to evaluate the interfacial electron transfer resistance of graphene/AuNPs film, as shown in Fig. S2B.† The EIS spectrum contains a semicircle and a linear portion respectively. The semicircle diameter at higher frequencies corresponds to the electron-transfer limited process (Ret), and the linear portion at lower frequencies represents the diffusion-limited process.51,52 In comparison with the bare GCE with a relatively large Ret of ∼300 Ω, obviously smaller semicircles with Ret of ∼105 Ω and ∼25 Ω were observed on the graphene and graphene/AuNPs modified GCE respectively. The remarkably reduced Ret is mainly ascribed to the large specific area and high electrical conductivity of the nanocomposite film. These investigations indicate that prepared graphene/AuNPs film has a large specific area, high conductivity and structural stability, and excellent biocompatibility, all of these merits make it a potential candidate for constructing sensitive electrochemical biosensors.
Design of the sensing strategy for IFN-γ assay
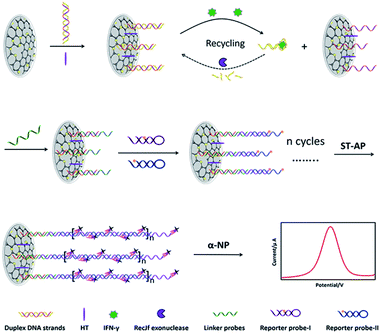
The sensing scheme is shown in Fig. 3. First of all, duplex DNA strands were immobilized on the graphene/AuNPs film through the formation of Au–S bonds. In the presence of IFN-γ, the complex of aptamer/IFN-γ was formed, resulting in the liberation of capture probes on the electrode surface. Meanwhile, the aptamer in the complex was digested with RecJf exonuclease, leading to the recycling of IFN-γ to generate numerous free capture probes on electrode surface. Free capture probes were available for the subsequent hybridization with linker probes, which were used to initiate the HCR in the presence of reporter probes. With the successive self-assembly of biotin labelled reporter probes, cascaded duplex DNA polymers were produced on the electrode surface. Finally, numerous ST–AP was attached on the DNA polymers, which was used to produce significantly enhanced enzyme-catalyzed electrochemical signals for quantitative IFN-γ monitoring.Electrochemical investigations of the IFN-γ aptasensor
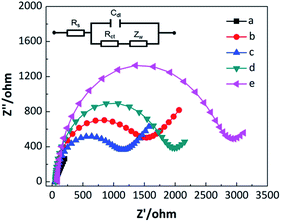
As an efficient tool for exploring the interfacial electron transfer, EIS was adopted to investigate the stepwise assembly process of constructed electrochemical aptasensor in this work.53 The resulting Nyquist plots are displayed in Fig. 4. Comparing with a low resistance of graphene/AuNPs film (curve a), the self-assembly of duplex DNA strands and TH molecules resulted in a substantial increase in Ret (curve b). The significantly enhanced impedance can be ascribed to two factors that severally hinder the transfer of redox probe, [Fe(CN)6]3/[Fe(CN)6]4, at the sensing interface. One is the negatively charged phosphate backbone of the DNA strands, and the other is the large steric hindrance of assembled molecules. The subsequent recognition of IFN-γ and digestion of aptamers reduced interfacial steric hindrance and improved the access of redox probe on the electrode surface. As a consequence, an obviously decreased Ret was observed in this condition (curve c). In the presence of linker probes, an increased Ret was produced due to the formation of the duplex DNA strands (curve d). Once the HCR was triggered in the addition of reporter probes, the impedance increased remarkably due to that numerous DNA strands were assembled on the electrode surface (curve e), making the electron transfer more difficult.In order to further verify the stepwise modification procedure, the electrochemical aptasensor was also studied by CV.29 As shown in Fig. S3,† in contrast with a high and a well-defined current response of graphene/AuNPs modified electrode (curve a), the peak currents of the duplex DNA strands and TH immobilized electrode decreased obviously (curve b). This decline in redox currents confirms the successful immobilization of duplex strands and TH molecules onto the electrode surface. After treating with IFN-γ and RecJf exonuclease, increased peak currents were observed (curve c), indicating that partial aptamers were released from the electrode surface. While further hybridizing with linker probes, the peak currents decreased correspondingly (curve d). Finally, the formation of cascaded DNA polymers led to the generation of significantly decreased peak currents (curve e). These results are consistent with those observed in EIS investigations, demonstrating that the electrochemical aptasensor successfully works as the designed routine.
Signal amplification performance of the electrochemical aptasensor
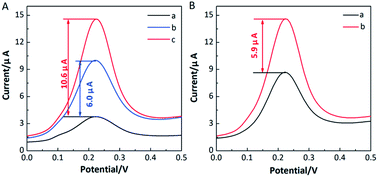
In our designed strategy, RecJf exonuclease selectively digested the aptamer in the complex of IFN-γ/aptamer, and the IFN-γ was released to bind with another aptamer to initiate a new cleavage reaction. As a result, a large amount of free capture probes were produced on the electrode surface and used for the HCR. To verify the signal amplification performance of the proposed aptasensor for IFN-γ detection, DPV measurements were performed on the aptasensor in the presence/absence of RecJf exonuclease and IFN-γ, as shown in Fig. 5A. Comparing with a low background peak current in the absence of IFN-γ (curve a), an increased peak current with a current change of ∼6.0 μA was acquired when the IFN-γ (1 nM) was added solely (curve b). As anticipated, a significantly enhanced response signal was produced with the addition of RecJf exonuclease (0.5 unit per μL), due to the digestion of aptamers and further recycling of IFN-γ (curve c). In this case, the current change of ∼10.6 μA was 1.8-fold higher than that of IFN-γ solely. Besides, the effect of HCR on the DPV responses was studied (Fig. 5B). Curve a in Fig. 5B shows a relatively low response signal in the absence of HCR. It can be seen from curve b that an obvious signal amplification was realized with a current change of ∼5.9 μA. These results distinctly confirm the feasibility of the designed sensing strategy and the high efficiency of dual enzyme-assisted amplification strategy for IFN-γ detection.Optimization of experimental conditions
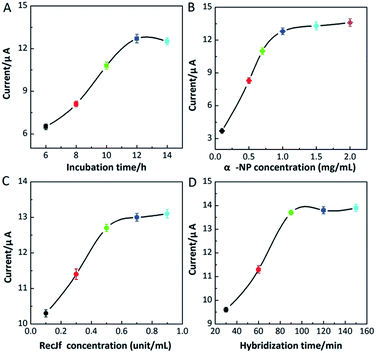
To obtain high-performance assay results, different experimental conditions were investigated and optimized in details. As the distribution density of duplex DNA strands plays a critical role in the current response, the incubation time of duplex DNA strands on graphene/AuNPs modified electrode was explored. As shown in Fig. 6A, the peak currents increased sharply with more incubation time up to 12 h, and then slightly decreased while further prolonging the incubation time. A low density of duplex DNA strands usually generates weak signal responses, while a crowed distribution of duplex DNA strands produces high steric hindrance, hindering the recognition towards IFN-γ and the further hybridization with linker probes.54 As a result, a proper incubation time of 12 h was selected in this work. Besides, α-NP concentration was an important parameter affecting the signal responses (Fig. 6B). Increasing the α-NP concentrations, the peak currents increased gradually and then reached a constant value at 1.0 mg mL−1. Therefore, 1.0 mg mL−1 was chosen as the optimal α-NP concentration for the subsequent measurements.The peak currents obtained with different RecJf exonuclease concentrations were investigated. As depicted in Fig. 6C, enhanced peak currents were acquired with increasing RecJf exonuclease concentrations, and a stable value was observed at 0.5 unit per μL. Although treating with additional RecJf exonuclease, subtle increases in peak currents were obtained, indicating that 0.5 unit per μL was sufficient to fulfil the nicking reaction. In addition, the hybridization time with reporter probes was also studied (Fig. 6D). The peak currents rapidly increased with increasing hybridization time and plateaued within 90 min. Thus, 90 min was introduced in this test for the hybridization with reporter probes.
Analytical performance of the electrochemical aptasensor
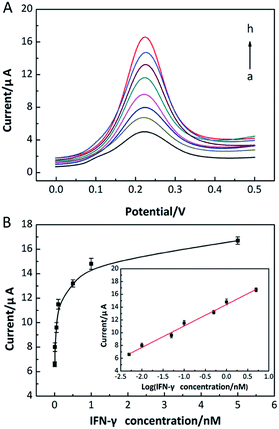
Under the optimized experimental conditions, the analytical performance of the prepared IFN-γ aptasensor was investigated. As shown in Fig. 7A, the enhanced peak currents were observed with increasing IFN-γ concentrations, due to that more ST–AP molecules were bound on the electrode surface. The linear relationship between peak current (Ipeak) and the logarithm of the IFN-γ concentrations was obtained in the range from 5 pM to 5 nM (Fig. 7B). Correspondingly, a linear regression equation of Ipeak = 14.40 + 3.36![[thin space (1/6-em)]](https://www.rsc.org/images/entities/char_2009.gif) log
log![[thin space (1/6-em)]](https://www.rsc.org/images/entities/char_2009.gif) CIFN-γ (R2 = 0.995) with a low detection limit of 2 pM (S/N = 3) was achieved. Although more analytical time was required comparing with some other reported IFN-γ aptasensors (shown in Table S2†),17,18,55–59 the performance of prepared aptasensor was comparable or better than most of reported biosensors. Besides, the proposed aptasensor could not be regenerated due to the involved target recycling strategy assisted with exonuclease. However, considering the versatility of the designed sensing strategy and facile preparation of graphene/AuNPs modified electrode, our constructed high-performance aptasensor would have a wide application in practice.
CIFN-γ (R2 = 0.995) with a low detection limit of 2 pM (S/N = 3) was achieved. Although more analytical time was required comparing with some other reported IFN-γ aptasensors (shown in Table S2†),17,18,55–59 the performance of prepared aptasensor was comparable or better than most of reported biosensors. Besides, the proposed aptasensor could not be regenerated due to the involved target recycling strategy assisted with exonuclease. However, considering the versatility of the designed sensing strategy and facile preparation of graphene/AuNPs modified electrode, our constructed high-performance aptasensor would have a wide application in practice.
As a comparison, the sensing performance towards IFN-γ detection based on graphene modified GCE was further investigated, and amino modified capture probes were used to interact with residual carboxy groups on the electrochemically deposited graphene.60 As shown in Fig. S4,† significantly reduced response currents of graphene-based aptasensor were observed, resulting in a narrow linear range with a high detection limit of ∼60 pM (S/N = 3). Due to few carboxy groups remaining on the graphene surface, a small quantity of capture probes were immobilized on the electrode surface, severely hindering the signal acquisitions. Meanwhile, in contrast to the graphene/AuNPs modified GCE, a lower specific area and electron transfer rate was observed on graphene modified electrode, which was not favorable for the signal transmission. These results confirm that graphene/AuNPs modified GCE plays a critical role in the enhancement of electrochemical signals, contributing to a high performance in IFN-γ detection.
Selectivity, stability and reproducibility of the electrochemical aptasensor
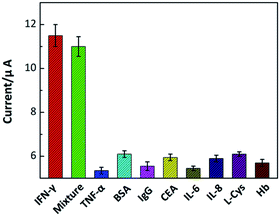
To realize a reliable assay in practical applications, selectivity of prepared aptasensor is investigated. The constructed aptasensor was challenged with IFN-γ and other familiar interferences of TNF-α, BSA, IgG, CEA, IL-6, IL-8, L-Cys and Hb at different concentrations. The corresponding electrochemical signals were recorded, as shown in Fig. 8. The presence of IFN-γ at a low concentration of 0.1 nM produced a remarkable signal response, while all other interferences at a high concentration of 1.0 nM showed negligible effects on the electrochemical signals. The results indicate that this aptasensor has a high selectivity towards IFN-γ. This excellent specificity can be attributed to the specific recognition and strong combining capability between the aptamer and IFN-γ.The reproducibility of the aptasensor was also explored, in which five independently measurements were implemented under the same condition. Similar signal responses were observed with these measurements, and a relative standard deviation (RSD) was estimated ∼6.21%, indicating an acceptable reproducibility of the constructed electrochemical aptasensor. Besides, the prepared aptasensor was stored at 4 °C for 1–2 weeks, and then used for IFN-γ detection to evaluate its stability. It is observed that the DPV response retained ∼92.7% of its initial response, confirming that the aptasensor possessed a satisfactory stability for IFN-γ detection. It is mainly ascribed to the stable structure of graphene/AuNPs film on GCE and a favourable biocompatibility of the sensing interface reinforcing their interactions with biomolecules.
Practical applications of the IFN-γ aptasensor in serum samples
The potential applicability of the aptasensor for detecting IFN-γ in real serum samples was studies in this work, and the results were compared with those tested with the commercial ELISA method. The recovery and RSD of each test were calculated to estimate the accuracy of detection. As shown in Table 1, satisfactory recoveries (91.3% to 107.7%) with acceptable RSD (4.21% to 5.54%) were obtained for IFN-γ detection. These results suggest that the prepared aptasensor is reliable for the IFN-γ detection in the real samples.| Samples | ELISA test | Constructed aptasensor | Recovery (%) | RSD (%) |
|---|---|---|---|---|
| 1 | 36.2 pM | 33.1 pM | 91.4 | 5.54 |
| 2 | 53.9 pM | 50.6 pM | 93.8 | 4.81 |
| 3 | 0.13 nM | 0.14 nM | 107.7 | 4.63 |
| 4 | 0.23 nM | 0.21 nM | 91.3 | 4.21 |
Conclusions
In summary, we have developed a sensitive and selective electrochemical aptasensor for IFN-γ detection. The hierarchical graphene/AuNPs modified electrode enhanced the electron transfer and provided plentiful binding sites for biomolecules. Coupling with the exonuclease-induced target recycling and alkaline phosphatase-catalyzed signal readout, dramatically enhanced electrochemical signals were produced. As a consequence, an ultrasensitive electrochemical aptasensor for picomolar IFN-γ detection was realized in this work. Due to its versatility and portability of designed sensing scheme, this work opens a new horizon for the development of high-performance electrochemical biosensors for medical diagnostics, food safety and environmental monitoring.Conflicts of interest
There are no conflicts to declare.Acknowledgements
This work was supported by the National Natural Science Foundation of China (21607159), the Natural Science Foundation of Jiangsu Province (BK20161087), China Postdoctoral Science Foundation (2015M581750), Jiangsu Planned Projects for Postdoctoral Research Funds (1501114B), State Key Laboratory of Materials-Oriented Chemical Engineering (KL15-13).References
- U. Boehm, T. Klamp, M. Groot and J. C. Howard, Annu. Rev. Immunol., 1997, 15, 749 CrossRef CAS PubMed.
- D. A. Chesler and C. S. Reiss, Cytokine Growth Factor Rev., 2002, 13, 441 CrossRef CAS PubMed.
- K. Min, M. Cho, S.-Y. Han, Y.-B. Shim, J. Ku and C. Ban, Biosens. Bioelectron., 2008, 23, 1819 CrossRef CAS PubMed.
- M. Dijksma, B. Kamp, J. C. Hoogvliet and W. P. van Bennekom, Anal. Chem., 2001, 73, 901 CrossRef CAS PubMed.
- C.-C. Chang, S. Lin, C.-H. Lee, T.-L. Chuang, P.-R. Hsueh, H.-C. Lai and C.-W. Lin, Biosens. Bioelectron., 2012, 37, 68 CrossRef CAS PubMed.
- S. Song, L. Wang, J. Li, J. Zhao and C. Fan, TrAC, Trends Anal. Chem., 2008, 27, 108 CrossRef CAS.
- A. B. Iliuk, L. H. Hu and W. A. Tao, Anal. Chem., 2011, 83, 4440 CrossRef CAS PubMed.
- L. Jia, L. Ding, J. Tian, L. Bao, Y. Hu, H. Ju and J.-S. Yu, Nanoscale, 2015, 7, 15953 RSC.
- D. Tang, J. Tang, Q. Li, B. Su and G. Chen, Anal. Chem., 2011, 83, 7255 CrossRef CAS PubMed.
- W. Cheng, L. Ding, Y. Chen, F. Yan, H. Ju and Y. Yin, Chem. Commun., 2010, 46, 6720 RSC.
- L. Shi, Z. Chu, Y. Liu, J. Peng and W. Jin, J. Mater. Chem. B, 2014, 2, 2658 RSC.
- L. Shi, Z. Chu, Y. Liu and W. Jin, J. Mater. Chem. B, 2015, 3, 3134 RSC.
- J. J. Yin, X. X. He, K. M. Wang, Z. H. Qing, X. Wu, H. Shi and X. H. Yang, Nanoscale, 2012, 4, 110 RSC.
- H. Hai, F. Yang and J. Li, RSC Adv., 2013, 3, 13144 RSC.
- S. M. Taghdisi, N. M. Danesh, P. Lavaee, A. S. Emrani, M. Ramezani and K. Abnous, RSC Adv., 2015, 5, 43508 RSC.
- T. Hianik and J. Wang, Electroanalysis, 2009, 21, 1223 CrossRef CAS.
- Y. Liu, N. Tuleouva, E. Ramanculov and A. Revzin, Anal. Chem., 2010, 82, 8131 CrossRef CAS PubMed.
- H. Zhang, B. Jiang, Y. Xiang, Y. Chai and R. Yuan, Analyst, 2012, 137, 1020 RSC.
- G. Yan, Y. Wang, X. He, K. Wang, J. Liu and Y. Du, Biosens. Bioelectron., 2013, 44, 57 CrossRef CAS PubMed.
- Z. M. Li, Y. Yu, Z. L. Li, T. Wu and J. J. Yin, Anal. Methods, 2015, 7, 9732 RSC.
- X. J. Huang, A. M. O'Mahony and R. G. Compton, Small, 2009, 5, 776 CrossRef CAS PubMed.
- A. Martin, J. Hernandez-Ferrer, L. Vazquez, M.-T. Martinez and A. Escarpa, RSC Adv., 2014, 4, 132 RSC.
- C. Shan, H. Yang, D. Han, Q. Zhang, A. Ivaska and L. Niu, Biosens. Bioelectron., 2010, 25, 1070 CrossRef CAS PubMed.
- W. Hong, H. Bai, Y. Xu, Z. Yao, Z. Gu and G. Shi, J. Phys. Chem. C, 2010, 114, 1822 CAS.
- C. Du, Z. Y. Yao, Y. Q. Chen, H. Bai and L. Li, RSC Adv., 2014, 4, 9133 RSC.
- A. Martin and A. Escarpa, TrAC, Trends Anal. Chem., 2014, 56, 13 CrossRef CAS.
- Y. Choi, H. S. Bae, E. Seo, S. Jang, K. H. Park and B.-S. Kim, J. Mater. Chem., 2011, 21, 15431 RSC.
- J. Liang, Z. Chen, L. Guo and L. Li, Chem. Commun., 2011, 47, 5476 RSC.
- C. Liu, G. Xiang, D. Jiang, L. Liu, F. Liu, F. Luo and X. Pu, Analyst, 2015, 140, 7784 RSC.
- T. Tran Duy, J. Balamurugan, J. Y. Hwang, N. H. Kim and J. H. Lee, Carbon, 2016, 98, 90 CrossRef.
- L. Shi, Z. Chu, Y. Liu, W. Jin and N. Xu, Adv. Funct. Mater., 2014, 24, 7032 CrossRef CAS.
- L. Shi, Y. Wang, S. Ding, Z. Chu, Y. Yin, D. Jiang, J. Luo and W. Jin, Biosens. Bioelectron., 2017, 89, 871 CrossRef CAS PubMed.
- C. Liu, K. Wang, S. Luo, Y. Tang and L. Chen, Small, 2011, 7, 1203 CrossRef CAS PubMed.
- Q. Zhu, Y. Chai, Y. Zhuo and R. Yuan, Biosens. Bioelectron., 2015, 68, 42 CrossRef CAS PubMed.
- F. Liu, G. Xiang, R. Yuan, X. Chen, F. Luo, D. Jiang, S. Huang, Y. Li and X. Pu, Biosens. Bioelectron., 2014, 60, 210 CrossRef CAS PubMed.
- Y. Chen, B. Jiang, Y. Xiang, Y. Chai and R. Yuan, Chem. Commun., 2011, 47, 12798 RSC.
- Y. Li, Y. Li, Y. Wu, F. Lu, Y. Chen and W. Gao, Biosens. Bioelectron., 2017, 89, 585 CrossRef CAS PubMed.
- M. Yan, W. Bai, C. Zhu, Y. Huang, J. Yan and A. Chen, Biosens. Bioelectron., 2016, 77, 613 CrossRef CAS PubMed.
- X. L. Zhu, J. Zhao, Y. Wu, Z. M. Shen and G. X. Li, Anal. Chem., 2011, 83, 4085 CrossRef CAS PubMed.
- R. Freeman, X. Q. Liu and I. Willner, Nano Lett., 2011, 11, 4456 CrossRef CAS PubMed.
- L. Jiang, J. Peng, R. Yuan, Y. Chai, Y. Yuan, L. Bai and Y. Wang, Analyst, 2013, 138, 4818 RSC.
- Y. Tan, X. Wei, Y. Zhang, P. Wang, B. Qiu, L. Guo, Z. Lin and H.-H. Yang, Anal. Chem., 2015, 87, 11826 CrossRef CAS PubMed.
- P. Miao, Y. Tang, B. Wang, K. Han, X. Chen and H. Sun, Analyst, 2014, 139, 5695 RSC.
- S. Bi, S. Yue and S. Zhang, Chem. Soc. Rev., 2017, 46, 4281 RSC.
- Z. Zhang, T. W. Fan and I. M. Hsing, Nanoscale, 2017, 9, 2748 RSC.
- B. Bao, J. Zhu, L. Gong, J. Chen, Y. Pan and L. Wang, RSC Adv., 2017, 7, 3528 RSC.
- J. Ikbal, G. S. Lim and Z. Gao, TrAC, Trends Anal. Chem., 2015, 64, 86 CrossRef CAS.
- Y. Xu, K. Sheng, C. Li and G. Shi, ACS Nano, 2010, 4, 4324 CrossRef CAS PubMed.
- S. Stankovich, D. A. Dikin, R. D. Piner, K. A. Kohlhaas, A. Kleinhammes, Y. Jia, Y. Wu, S. T. Nguyen and R. S. Ruoff, Carbon, 2007, 45, 1558 CrossRef CAS.
- T. Zheng, T. Tan, Q. Zhang, J.-J. Fu, J.-J. Wu, K. Zhang, J.-J. Zhu and H. Wang, Nanoscale, 2013, 5, 10360 RSC.
- F. Lisdat and D. Schaefer, Anal. Bioanal. Chem., 2008, 391, 1555 CrossRef CAS PubMed.
- I. I. Suni, TrAC, Trends Anal. Chem., 2008, 27, 604 CrossRef CAS.
- C. Luo, H. Tang, W. Cheng, L. Yan, D. Zhang, H. Ju and S. Ding, Biosens. Bioelectron., 2013, 48, 132 CrossRef CAS PubMed.
- J. Zhang, S. Song, L. Zhang, L. Wang, H. Wu, D. Pan and C. Fan, J. Am. Chem. Soc., 2006, 128, 8575 CrossRef CAS PubMed.
- J. Xia, D. Song, Z. Wang, F. Zhang, M. Yang, R. Gui, L. Xia, S. Bi, Y. Xia, Y. Li and L. Xia, Biosens. Bioelectron., 2015, 68, 55 CrossRef CAS PubMed.
- J. Zhao, C. Chen, L. Zhang, J. Jiang and R. Yu, Biosens. Bioelectron., 2012, 36, 129 CrossRef CAS PubMed.
- Y. Chen, T. S. Pui, P. Kongsuphol, K. C. Tang and S. K. Arya, Biosens. Bioelectron., 2014, 53, 257 CrossRef CAS PubMed.
- S. Ding, C. Mosher, X. Y. Lee, S. R. Das, A. A. Cargill, X. Tang, B. Chen, E. S. McLamore, C. Gomes, J. M. Hostetter and J. C. Claussen, ACS Sens., 2017, 2, 210 CrossRef CAS PubMed.
- X. M. Miao, C. N. Ko, K. Vellaisamy, Z. B. Li, G. J. Yang, C. H. Leung and D. L. Ma, Sci. Rep., 2017, 7, 42740 CrossRef CAS PubMed.
- L. Shi, Y. Wang, Z. Chu, Y. Yin, D. Jiang, J. Luo, S. Ding and W. Jin, J. Mater. Chem. B, 2017, 5, 1073 RSC.
Footnote |
| † Electronic supplementary information (ESI) available. See DOI: 10.1039/c7ra07817j |
| This journal is © The Royal Society of Chemistry 2017 |

