 Open Access Article
The effect of defects on the interfacial mechanical properties of graphene/epoxy composites
Maoyuan Lia,
Helezi Zhoua,
Yun Zhang *a,
Yonggui Liaob and
Huamin Zhoua
aState Key Laboratory of Material Processing and Die & Mold Technology, Huazhong University of Science and Technology, Wuhan 430074, Hubei, China. E-mail: marblezy@hust.edu.cn; Tel: +86-27-87543492
bKey Laboratory for Large-Format Battery Materials and System, Ministry of Education, School of Chemistry and Chemical Engineering, Huazhong University of Science and Technology, Wuhan 430074, Hubei, China
First published on 28th September 2017
Abstract
In this study, the effect of defects on the interfacial mechanical properties of graphene/epoxy composites has been investigated by using molecular dynamics simulations. Three common types of defects with different concentrations, i.e., single-vacancy, double-vacancy, and Stone–Wales, were considered. Two typical separations, i.e., normal separation and shear separation, were conducted to evaluate the graphene/epoxy interfacial cohesive strength and interfacial shear strength, respectively. The pull-out energy and corresponding forces during the whole process were determined. It was found that the vacancy defects, including single-vacancy and double-vacancy, would degrade the interfacial mechanical properties. In contrast, the Stone–Wales defect could enhance the interfacial strength, especially the interfacial shear strength. Besides, the effect of graphene agglomeration on the graphene/epoxy interfacial shear stress was also investigated. The results showed that the interaction between graphene sheets was much stronger than that between graphene and polymer. Additionally, the graphene agglomerated structure was found to weaken the graphene sheet and epoxy interfacial load transfer, which agreed with the observations in previous experimental results in the literature.
1. Introduction
Due to its extraordinary, outstanding physical properties, graphene (Gr) has been widely used as a filler to enhance the mechanical, thermal, and electrical properties of epoxy based composites.1–4 For example, the Yong's modulus of neat epoxy could be enhanced about 33% by Gr at a low weight fraction of 0.1%.1 However, the experimental mechanical property values of Gr/epoxy were still far lower than those predicted by theoretical analysis and simulations.5–7 This can be ascribed to some assumptions in the analysis and simulations, such as the well dispersed nature of Gr in the matrix without agglomeration and the perfect Gr sheets without any defects, which may affect the interfacial load transfer from Gr to the polymer matrix.The interfacial mechanical properties between the Gr and the polymer matrix is important for determining the overall mechanical performance of composites.8,9 Since it is complex to quantitatively evaluate the interfacial properties by experiment, molecular dynamics (MD) have proved to be a practical method to investigate the interfacial mechanical properties of polymer matrix and Gr sheets.
Some studies by using MD method have proved that the chemical functionalization has influence on the interfacial mechanical properties between Gr and polymer. For example, Lv et al.10 evaluated that the interfacial bonding properties could be improved with the chemical functionalization of Gr when pulling the Gr out from the polymer matrix. Ding et al.11 found that the interfacial shear strength between graphene oxide and polymer was much stronger than that between Gr and polymer. Liu et al.12 showed that Gr grafted with polymer chains could improve the shear strength while degrade the cohesive strength.
However, most of the existing researches focused on the Gr without any defect. The defects13 in the Gr sheets such as single-vacancy (SV), double-vacancy (DV) and Stone–Wales (SW) are inevitable during the synthesis process as well as manufacturing. Many experimental and simulation studies14–18 have showed that the defects have a remarkable impact on the mechanical properties as well as other physical properties of the pristine Gr sheet. Moreover, some researches have been conducted to evaluate the effect of defects on the shear strength between carbon nanotube (CNT) and polymer. For example, Yang et al.19,20 showed that the vacancy defect would degrade the shear strength between CNT and polyethylene while the SW would enhance it, which was attributed to the stronger absorbed energy between the SW defective Gr and polymer. Similar results21 were obtained for CNT–epoxy nanocomposites by the introduction of SW defect and adatoms. More recently, Yang et al.22 have firstly observed that the defect controlled by the high energy carbon ions could improve the shear strength of CNT/polymer derived ceramic interface while the measured fracture strength was observed to decrease marginally.
Although there have been some pioneer simulation works as described above, there is few investigations on the effect of the defects on interfacial mechanical properties of Gr/epoxy nanocomposites, especially on the cohesive strength and shear strength. The mechanisms of enhancement or degradation effect on the interfacial mechanical properties caused by the Gr defects is still not well understood. Thus, it is of great significance to investigate the effect of defects on the interfacial mechanical properties of Gr/epoxy composites.
Besides, the agglomeration of Gr due to the lager surface area was another obstacle to improve the mechanical properties of polymer-based composites. To understand the degrade effect caused by Gr agglomeration was also a critical issue. Using MD simulations, Rahman et al.23 found that the in-plane elastic modulus of well dispersed Gr/polymer nanocomposites was higher than that of the agglomerated one. Ding et al.11 also has showed that a well dispersion state of graphene oxide sheets could enhance the interfacial properties between the polymer and graphene oxide. However, little work has been reported to-date on the effect of Gr agglomeration on interfacial mechanical properties. Additionally, the agglomeration of Gr may form more complex interface types in the Gr/polymer composites. Therefore, it is also necessary to investigate the effect of Gr agglomeration on the interfacial mechanical properties between Gr and epoxy considering the different interface types.
In this study, we have conducted a series of pull-out MD simulations to investigate the effect of defects on the interfacial mechanical properties of Gr–epoxy nanocomposites. Three common types of defects, i.e., SV, DV and SW were randomly dispersed in Gr sheets, respectively. Two separation modes i.e., the normal separation and the shear separation, were conducted to evaluate the cohesive strength and shear strength, respectively. Moreover, the effect of Gr agglomeration on the shear strength was also studied by different pull-out manners.
2. Computational methods
2.1 Molecular models of Gr/epoxy nanocomposites
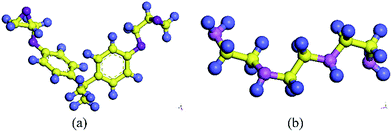
The molecular models of Gr/epoxy nanocomposites were first constructed by a commercial software, Material Studio (Accelrys). A representative molecular method proposed by Yu et al.24 was used to build the initial cross-linked epoxy model. In this model, six molecular chains of bisphenol A diglycidyl ether (DGEBA) resin were linked by one molecular chain of triethylenetetramine (TETA) curing agent, as shown in Fig. 1. The method has been used to successfully obtain the thermal and mechanical properties23,25–27 of cross-linked epoxy, and the simulation results agreed well with experimental observations.To evaluate the interfacial properties of Gr/epoxy composites, two representative interface models were conducted. One is the normal separation, which was constructed to obtain the cohesive strength by applying z-axis displacement to the Gr, as shown in Fig. 2a. Another is the shear separation, which was conducted to obtain the shear strength by applying x-axis displacement to pull out the Gr from epoxy matrix, as shown in Fig. 2b. The molecular model of cross-linked epoxy and pristine Gr sheet were shown in Fig. 2c and d. The molecular configurations of the above models were listed in Table 1. To investigate the effect of defects on the interfacial mechanical properties of Gr/epoxy nanocomposites, Gr sheets with three common types of possible defects, including SV, DV, and SW were constructed, as shown in Fig. 3. The SV and DV defects were formed by removing one carbon atom and two adjacent carbon atoms on the pristine Gr sheet, respectively. The SW defect was created by rotating one of the C–C bonds by 90°, transforming four hexagons into two pentagons and heptagons (5-7-7-5). The concentration of defects ranged from 0% to 13%, and the three types of defects were randomly located on the Gr sheets, respectively. For the vacancy defect, the concentration was defined as the number density of atoms removed from the Gr sheet. For a SW defect, which did not involve any removed or added carbon atoms in Gr sheet, the concentration was defined by considering two defected atoms.
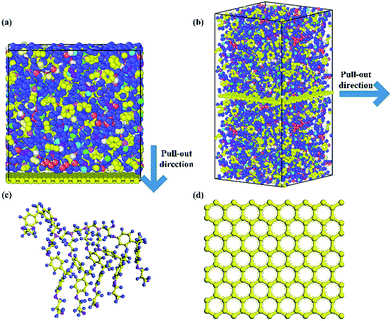 | ||
| Fig. 2 Gr/epoxy nanocomposites of (a) normal separation interface model and (b) shear separation interface model; (c) representative molecule DEGBA cured with TETA; (d) pristine Gr sheet. | ||
| Configuration | Unit cell dimension (Å) | Atom number | Interaction force type |
|---|---|---|---|
| Normal separation interface model | a = 36.4 b = 37.14 c = 39.22 | 5370 | Normal |
| Shear separation interface model | a = 36.1 b = 37.5 c = 73.13 | 10![[thin space (1/6-em)]](https://www.rsc.org/images/entities/char_2009.gif) 200 200 |
Shear |
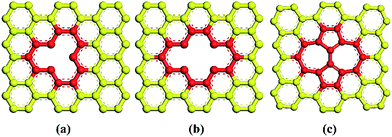 | ||
| Fig. 3 Types of defects studied in this work (a) single-vacancy (SV), (b) double-vacancy (DV) and (c) Stone–Wales (SW) defect. | ||
In the MD simulations, an ab initio force field, polymer consistent force field (PCFF)28 based on CFF91 with additional parameters was used to describe all the inter- and intra-atomic interactions for the nanocomposites. This force field has been widely used in previous studies to investigate the mechanical and thermal properties of Gr reinforced epoxy composites.5,29,30 Assuming there is no covalent chemical bonding between Gr and epoxy, the interfacial bonding strength was mainly dominated by van der Waals (vdW) interaction, which was expressed as the 9-6 Lennard-Jones (LJ) potentials in PCFF. The 9-6 LJ potential is described as Eij = ε[2(δ/rij)9 − 3(δ/rij)6], where rij is the distance between atom i and j, ε and δ are the energy and distance constants, respectively. The LJ potential parameters between different types of atoms are calculated by using the sixth power mix rules (i.e.,  ). The cutoff distance for the calculation of van der Waals (vdW) interactions was 1.0 nm in the present simulations. The Large-scale Atomic/Molecular Massively Parallel Simulator (LAMMPS)31 was used to conduct all the molecular dynamic simulation, and the velocity-Verlet method was used to integrate the equation of motion. The main steps involved in the pull-out simulations for composites containing Gr sheet with or without defects are as follows:
2.2 The calculation of interfacial properties
The interfacial interaction mechanical properties between Gr and epoxy matrix can be evaluated by the interfacial energy ΔE, pull-out energy Epullout and pull-out force Fpullout. The interaction energy was calculated from the different between the potential energy of the nanocomposite and the potential energy of epoxy matrix and the Gr filler, as follow:33,34| ΔE = Etotal − EGr − Eepoxy | (1) |
| Epullout = Ecurrentpullout − Einitalpullout | (2) |
For normal separation, the cohesive strength σi can be calculated from the following equation:
 | (3) |
For shear separation, the shear strength τi can be calculated from the pull-out energy as follows:
 | (4) |
 | (5) |
3. Results and discussion
3.1 Validation of MD model
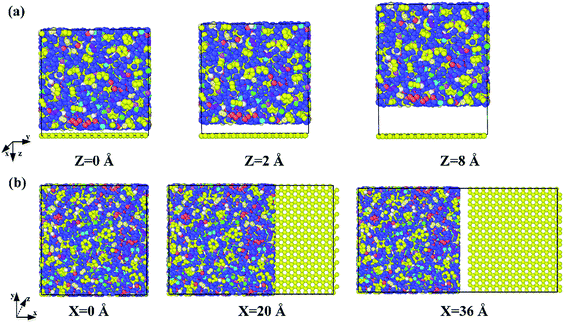
To validate the molecular models and PCFF potential, the cohesive strength and shear strength between the pristine Gr and cross-linked epoxy were first calculated. Fig. 4 shows the snapshots of the normal/shear separation pull-out process of the pristine Gr from the epoxy matrix, respectively. The pull-out force Fpullout and pull-out energy Epullout during the pullout process were calculated, as shown in Fig. 5. For the case of normal separation, the pull-out force increased linearly at first, and reached a maximum of about 180 kcal mol−1 Å−1 at around 1 Å separation, beyond which it reduced gradually and went to zero, which agreed with previous studies.12,36 For the case of shear separation, it can be observed that the pull-out force can be divided into three stages during the whole process. The pull-out force increased in the first stage, then oscillated around a stable value in the second stage, and finally decreased in the third stage, which also had the same trend with previous studies.23,37 The length of the first and the third stage was about 1.0 nm, which was close to the cutoff distance of vdW interaction. The pull-out energy Epullout for the two separation ways increased gradually as the Gr was pulled out from the epoxy matrix. The variation of energy during the whole pull-out process was found to be equal to the variation of the vdW energy, which indicated the interfacial bonding strength was mainly dominated by vdW interaction.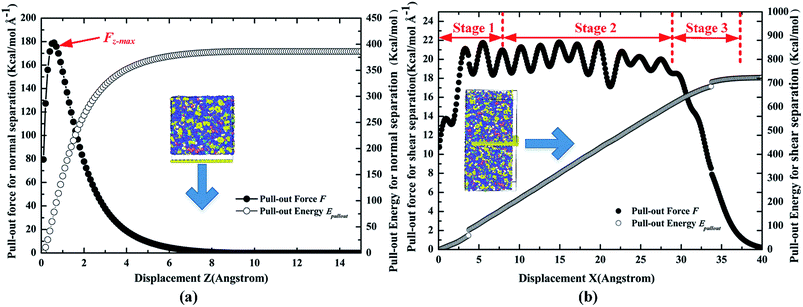 | ||
| Fig. 5 Variation of the pull-out force F and pull-out energy Epullout for the nanocomposite containing pristine Gr during the pull-out process (a) normal separation mode (b) shear separation mode. | ||
Based on the calculated pull-out force, pull-out energy and eqn (2)–(5), the cohesive strength and shear strength between the pristine Gr and epoxy were 962.77 MPa and 111.10 MPa, respectively. The results showed that the interfacial cohesive strength was much higher than the interfacial shear strength, implying that the shear separation failure may be generated more easily compared with the normal separation. The value of cohesive strength in present study agreed with the simulation results by other researchers12,29,36 (i.e., ∼730 MPa). The difference was due to the different polymer matrix type and the unit cell sizes. Besides, the cohesive strength (i.e., 962.77 MPa) between Gr and polymer was much larger than that (i.e., 479 MPa) between carbon nanotube (CNT) and polymer,38 indicating that the Gr had a better enhancement effect than CNT in the polymer nanocomposites.1 For the case of shear separation, the calculated shear strength for the present model was also consistent with the previous studies10,32,39 (i.e., ∼100 MPa). Additionally, the results indicated that the interfacial shear strength between Gr and epoxy was much larger than that of CNT/epoxy (40.68 MPa).40 In the later discussion, these cohesive strength and shear strength values between pristine Gr and epoxy will be used as the reference. Hence, these results confirmed the validity of the PCFF potential and present molecular models to calculate the interfacial bonding strength between Gr and polymer.
3.2 Effect of defects on the interfacial properties
The effect of the three kinds of defects on the interfacial properties of Gr/epoxy are discussed in this section. As described in the previous section, both the normal separation and shear separation were considered. For the case of normal separation mode, the cohesive strength between Gr–epoxy and the maximum force in z-axis required to separate the Gr from epoxy are calculated according to the concentrations of different defect type, as shown in Fig. 6. In case of the vacancy defects, including SV and DV, the results revealed that both the maximum force in pullout direction and the corresponding cohesive strength of the Gr–epoxy decreased as the defect concentrations in the Gr sheet increased. Since the bonded energy of the epoxy and Gr didn't change remarkably, the non-bonded energy, that is, the vdW interaction between the Gr and epoxy matrix completely contributed to the interaction energy. According to the expressions, the vdW interaction energy would decrease as the increased number of removed carbon atoms in the Gr, resulting in the decrease of the cohesive strength. Unlike the vacancy defect, the existence of SW defect enhanced the cohesive strength and the maximum pullout force. It can be observed that the cohesive strength increased from 962.77 to the 991.16 MPa when the SW defect concentration was 3%. The enhancement effect in the cohesive strength indicated that the interaction energy between SW defective Gr and epoxy was stronger than that between pristine Gr and epoxy.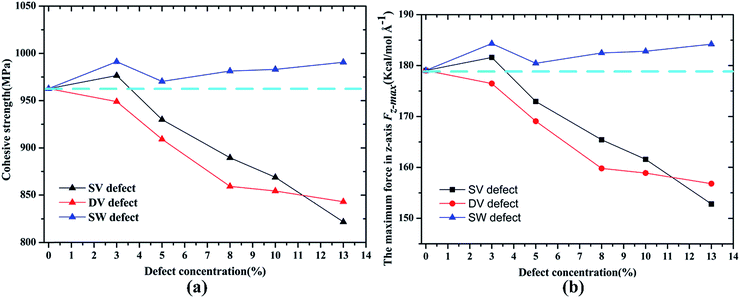 | ||
| Fig. 6 Variation in (a) cohesive strength σi and (b) the maximum force Fz-max in z-axis according to concentrations of different defect types. | ||
For the case of shear separation mode, the similar results had been found that the vacancy defects (SV and DV defect) could degrade the shear strength while the SW defect had a reinforcement effect on the shear strength and the corresponding pull-out energy, as shown in Fig. 7. Comparing to the cohesive strength, the shear strength showed a more sensitive relationship with the vacancy defect, for example, the maximum decrease in the shear strength was about 31% (111.10 to 76.61 MPa) while the result in cohesive strength was about 17% (962.77 to 821.73 MPa) at SV defect with a concentration of 13%. Furthermore, the SV defect had a more significant decrease effect on shear strength and the pullout energy than the DV defect at the same defect concentrations, for instance, the shear strength decreased to 102.31, 93.65 MPa for a defect concentration of 8% of SV and DV, respectively. Previous simulations have indicated that the energy per missing atom for a DV was much lower than that for SV,13 thus, the DV defect was thermodynamically preferred than SV defect. The SW defect showed a positive effect on the shear strength, of which the maximum increase was about 4% at a concentration of 5%. Meanwhile, the corresponding pull-out energy increased with the existence of SW, indicating a stronger adhesive effect compared with the pristine Gr.
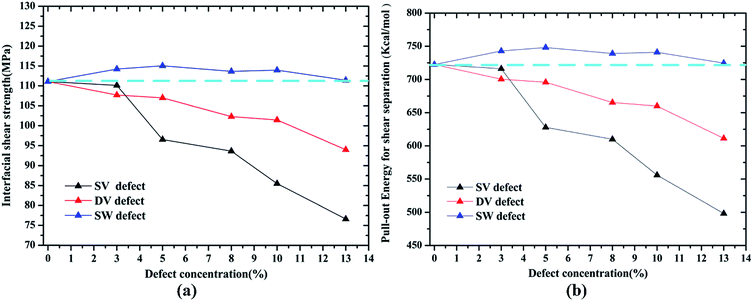 | ||
| Fig. 7 Variation in (a) interfacial shear strength τi and (b) the pull-out energy Epullout according to concentrations of different defect types. | ||
The above results agreed with some previous works.19–22,41 However, the mechanism of the enhancement in shear strength and cohesive strength by SW defect was complex, as the formation of SW defect didn't remove or add any atoms. Yang et al.19,20 concluded from their studies that the enhancement may be attributed to the fact that the polymer molecules were more efficiently absorbed on the surface of the SW defective Gr. Some other studies21 found that the SW defects can increase the concentration of sp2 carbons near the Gr, leading to the increase in π–π attractions at the Gr–epoxy interface. More recently, Moon et al.41 have revealed the enhancement mechanism between the SW defective Gr and polymer through a density functional theory (DFT) simulation, an improved adsorption energy caused by SW defect was clearly observed using the quantum simulations. Moreover, the SW defects were also found to increase the sliding resistance of polymer on Gr sheet, leading to more polymer molecules absorbed onto the Gr. It should be noted that the cohesive strength and shear strength were evaluated using eqn (3)–(5), however, the Gr surface area may be changed with the introduction of defect, for example, the Gr sheet would form the wrinkled structure caused by the SW defect, leading to the increase or decrease of the surface area. Thus, it is difficult to calculate the wrinkled Gr area accurately.32 All in all, the above results indicate that the vacancy defect, including SV and DV, could degrade the interfacial properties of Gr–epoxy, and the SW defect could enhance the cohesive strength and shear strength in Gr–epoxy system. Therefore, the introduction of SW defect in Gr sheets may be a useful way to improve the mechanical strength of Gr/polymer nanocomposites.
3.3 Effect of agglomeration on the interfacial property
Based on the preceding study on the Gr–epoxy interfacial properties, we continued evaluating the effect of agglomeration on the interfacial property, which was commonly observed in fabricating the Gr/epoxy nanocomposites. Followed by previous study,11,23 a three-layer Gr/epoxy composites molecular model was conducted to investigate the influence of Gr agglomerations. The shear separation was applied in this part.For the three-layer Gr, different kinds of pull-out manners may happen under the practical circumstance. Thus, three typical manners were studied, i.e., pulling out the whole Gr sheets (Case 2), pulling out the middle Gr sheet (Case 3), and pulling out the top Gr sheet (Case 4). The Case 1, i.e., pulling out the single Gr sheet, was also studied as the reference. The pull-out force and energy during the whole process for the four cases were calculated, as shown in Fig. 8. Compared with the single-Gr system (Case 1), it can be observed that the pull-out energy increased when more Gr sheets (Case 2) were pulled out. For the triple-Gr system, the order of the pull-out energy for different cases was: Case 3 > Case 4 > Case 2. The pull-out energy mainly originated from the interaction energy (vdW interactions) between the top/bottom epoxy matrix and the whole Gr sheets (Case 2), the top-bottom Gr sheets and the middle Gr sheet (Case 3), the upper Gr sheet/below epoxy matrix and the bottom Gr sheet (Case 4), respectively. The above results indicated that the interaction energy between Gr sheets was stronger than that between Gr and epoxy. A similar simulation result was also found in recent study of the Gr/PVA nanocomposites system.11 Meanwhile, the corresponding pull-out forces were also calculated and found to have the same trend with the pull-out energy, as shown in the inset in Fig. 9.
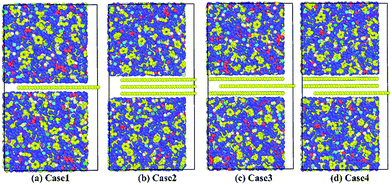 | ||
| Fig. 8 Pulling out (a) the single Gr sheet; (b) the whole Gr sheets; (c) the middle Gr sheet; (d) the bottom Gr sheet. | ||
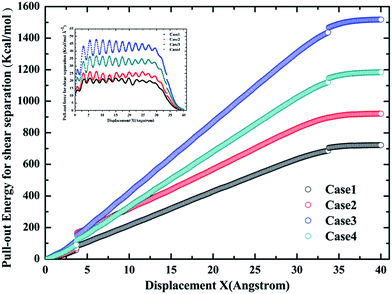 | ||
| Fig. 9 The pull-out energy profiles for different cases during the whole process. The inset shows the corresponding pull-out force during the whole process. | ||
The values of contact areas, pullout energy and the shear strength for different Gr/epoxy nanocomposite systems were presented in Table 2. Using the eqn (4) and (5), the calculated shear strength for Case 1 to 4 was 111.11, 105.37, 233.24 and 181.92 MPa, respectively. It should be noted that, for the Case 2 pullout process of triple-Gr systems, the shear strength, τi, can be calculated by the follow expressions:
 | (6) |
 | (7) |
| Nanocomposites system | Contact area, L2(w + h) (Å3) | Pull-out energy, Epull-out (kcal mol−1) | Interfacial shear strength, τi (MPa) |
|---|---|---|---|
| Single-Gr (Case 1) | 45![[thin space (1/6-em)]](https://www.rsc.org/images/entities/char_2009.gif) 116.85 116.85 |
722.52 | 111.11 |
| Triple-Gr (whole, Case 2) | 57![[thin space (1/6-em)]](https://www.rsc.org/images/entities/char_2009.gif) 589.16 589.16 |
874.64 | 105.37 |
| Triple-Gr (middle, Case 3) | 45![[thin space (1/6-em)]](https://www.rsc.org/images/entities/char_2009.gif) 116.85 116.85 |
1517.73 | 233.24 |
| Triple-Gr (bottom, Case 4) | 45![[thin space (1/6-em)]](https://www.rsc.org/images/entities/char_2009.gif) 116.85 116.85 |
1183.97 | 181.92 |
4. Conclusion
The effect of defects on the interfacial mechanical properties of Gr/epoxy nanocomposites were investigated by MD simulations in present study. Three common types of defects were studied, including SV, DV and SW. To determine the interfacial mechanical properties, two modes, i.e., the normal separation and the shear separation, were studied. Among the three defects, the vacancy defects, including SV and DV, were found to degrade both the cohesive strength and shear strength as the defect concentration increased from 0% to 13%, which were due to the vdW interaction energy decreased with the decreasing number of carbon atoms. The shear strength showed a more sensitive relationship with the defects compared with the cohesive strength, for instance, the maximum decrease in the shear strength was about 31% (111.10 to 76.61 MPa) while the result in cohesive strength was about 17% (962.77 to 821.73 MPa) for SV defect with a concentration of 13%. Moreover, the SV was found to degrade the shear strength more seriously compared with the DV at the same defect concentration. On the contrary, the introduction of SW defect was found to enhance the cohesive strength and shear strength, with a maximum increase of about 3% and 4%, respectively. The underlying enhancement mechanism can be explained by the fact that the absorbed energy between the SW defective Gr and epoxy was stronger than that for the pristine Gr. In addition, the existence of SW would increase in π–π attractions at the Gr–epoxy interface, leading to a better interfacial load transfer in Gr–epoxy system. The above results indicate that introduction of moderate SW defects in Gr may be a useful method to improve the mechanical performance of Gr/polymer nanocomposites.Besides, the effect of agglomeration on the shear strength was also investigated, the results showed that the interaction energy between Gr sheets was much stronger than that between Gr and epoxy. The agglomeration of Gr would degrade the shear strength between the Gr and epoxy compared with that when the Gr well dispersed in matrix, which agreed with the observation from the previous experimental results in the literature.
Conflicts of interest
The authors declare no competing financial interest.Appendix 1
Abbreviations and acronyms
| Gr | Graphene |
| MD | Molecular dynamics |
| SV | Single-vacancy |
| DV | Double-vacancy |
| SW | Stone–Wales |
| DGEBA | Bisphenol A diglycidyl ether |
| TETA | Triethylenetetramine |
| CNT | Carbon nanotube |
| PCFF | Polymer consistent force field |
| vdW | van der Waals |
Acknowledgements
The authors would like to acknowledge financial support from the National Natural Science Foundation of China (Grant No. 51210004, 51635006, 51675199) and Fundamental Research Funds for the Central Universities (Grant No. 2016YXZD059, 2015ZDTD028).Notes and references
- M. A. Rafiee, J. Rafiee, Z. Wang, H. Song, Z.-Z. Yu and N. Koratkar, ACS Nano, 2009, 3, 3884–3890 CrossRef CAS PubMed.
- H. Kim, A. A. Abdala and C. W. Macosko, Macromolecules, 2010, 43, 6515–6530 CrossRef CAS.
- S. Stankovich, D. A. Dikin, G. H. B. Dommett, K. M. Kohlhaas, E. J. Zimney, E. A. Stach, R. D. Piner, S. T. Nguyen and R. S. Ruoff, Nature, 2006, 442, 282–286 CrossRef CAS PubMed.
- X. Du, H. Zhou, W. Sun, H.-Y. Liu, G. Zhou, H. Zhou and Y.-W. Mai, Compos. Sci. Technol., 2017, 140, 123–133 CrossRef CAS.
- F. Lin, Y. Xiang and H.-S. Shen, Composites, Part B, 2017, 111, 261–269 CrossRef CAS.
- C. Li, A. R. Browning, S. Christensen and A. Strachan, Composites, Part A, 2012, 43, 1293–1300 CrossRef CAS.
- L. Gong, I. A. Kinloch, R. J. Young, I. Riaz, R. Jalil and K. S. Novoselov, Adv. Mater., 2010, 22, 2694–2697 CrossRef CAS PubMed.
- S. Gong, H. Ni, L. Jiang and Q. Cheng, Mater. Today, 2017, 20, 210–219 CrossRef CAS.
- C.-Y. Chang, S.-P. Ju, J.-W. Chang, S.-C. Huang and H.-W. Yang, RSC Adv., 2014, 4, 26074–26080 RSC.
- C. Lv, Q. Xue, D. Xia, M. Ma, J. Xie and H. Chen, J. Phys. Chem. C, 2010, 114, 6588–6594 CAS.
- N. Ding, X. Chen, C.-M. L. Wu and X. Lu, J. Phys. Chem. C, 2012, 116, 22532–22538 CAS.
- F. Liu, N. Hu, J. Zhang, S. Atobe, S. Weng, H. Ning, Y. Liu, L. Wu, Y. Zhao, F. Mo, S. Fu, C. Xu, Alamusi and W. Yuan, RSC Adv., 2016, 6, 66658–66664 RSC.
- F. Banhart, J. Kotakoski and A. V. Krasheninnikov, ACS Nano, 2011, 5, 26–41 CrossRef CAS PubMed.
- Y. Ren and G. Cao, Carbon, 2016, 103, 125–133 CrossRef CAS.
- A. Zandiatashbar, G.-H. Lee, S. J. An, S. Lee, N. Mathew, M. Terrones, T. Hayashi, C. R. Picu, J. Hone and N. Koratkar, Nat. Commun., 2014, 5, 3186 Search PubMed.
- Y. Wei, J. Wu, H. Yin, X. Shi, R. Yang and M. Dresselhaus, Nat. Mater., 2012, 11, 759–763 CrossRef CAS PubMed.
- N. Jing, Q. Xue, C. Ling, M. Shan, T. Zhang, X. Zhou and Z. Jiao, RSC Adv., 2012, 2, 9124–9129 RSC.
- G. Rajasekaran and A. Parashar, RSC Adv., 2016, 6, 26361–26373 RSC.
- S. Yang, S. Yu and M. Cho, Carbon, 2013, 55, 133–143 CrossRef CAS.
- S. Yang, J. Choi and M. Cho, Compos. Struct., 2015, 127, 108–119 CrossRef.
- X. Peng and S. A. Meguid, Comput. Mater. Sci., 2017, 126, 204–216 CrossRef CAS.
- Y. Yang, C. Ramirez, X. Wang, Z. Guo, A. Tokranov, R. Zhao, I. Szlufarska, J. Lou and B. W. Sheldon, Carbon, 2017, 115, 402–408 CrossRef CAS.
- R. Rahman and A. Haque, Composites, Part B, 2013, 54, 353–364 CrossRef CAS.
- S. Yu, S. Yang and M. Cho, Polymer, 2009, 50, 945–952 CrossRef CAS.
- S.-C. Shiu and J.-L. Tsai, Composites, Part B, 2014, 56, 691–697 CrossRef CAS.
- B. Kim, J. Choi, S. Yang, S. Yu and M. Cho, Polymer, 2015, 60, 186–197 CrossRef CAS.
- H. Shin, S. Yang, S. Chang, S. Yu and M. Cho, Polymer, 2013, 54, 1543–1554 CrossRef CAS.
- H. Sun, J. Phys. Chem. B, 1998, 102, 7338–7364 CrossRef CAS.
- F. Liu, N. Hu, H. Ning, S. Atobe, C. Yan, Y. Liu, L. Wu, X. Liu, S. Fu, C. Xu, Y. Li, J. Zhang, Y. Wang and W. Li, Carbon, 2017, 115, 694–700 CrossRef CAS.
- Q. L. Xiong, S. A. Meguid, Y. Wang and G. J. Weng, Mech. Mater., 2015, 85, 38–46 CrossRef.
- S. Plimpton, J. Comput. Phys., 1995, 117, 1–19 CrossRef CAS.
- F. Liu, N. Hu, H. Ning, Y. Liu, Y. Li and L. Wu, Comput. Mater. Sci., 2015, 108, 160–167 CrossRef CAS.
- J. Gou, B. Minaie, B. Wang, Z. Liang and C. Zhang, Comput. Mater. Sci., 2004, 31, 225–236 CrossRef CAS.
- Q. Zheng, Q. Xue, K. Yan, X. Gao, Q. Li and L. Hao, Polymer, 2008, 49, 800–808 CrossRef CAS.
- Q. Zheng, D. Xia, Q. Xue, K. Yan, X. Gao and Q. Li, Appl. Surf. Sci., 2009, 255, 3534–3543 CrossRef CAS.
- P. A. Amnaya, C. L. Dimitris and C. H. Daniel, Modell. Simul. Mater. Sci. Eng., 2009, 17, 015002 CrossRef.
- M. C. Wang, Z. B. Lai, D. Galpaya, C. Yan, N. Hu and L. M. Zhou, J. Appl. Phys., 2014, 115, 123520 CrossRef.
- H. Tan, L. Y. Jiang, Y. Huang, B. Liu and K. C. Hwang, Compos. Sci. Technol., 2007, 67, 2941–2946 CrossRef CAS.
- C. Lv, Q. Xue, D. Xia and M. Ma, Appl. Surf. Sci., 2012, 258, 2077–2082 CrossRef CAS.
- Q. L. Xiong and S. A. Meguid, Eur. Polym. J., 2015, 69, 1–15 CrossRef CAS.
- J. Moon, S. Yang and M. Cho, Carbon, 2017, 118, 66–77 CrossRef CAS.
- L.-C. Tang, Y.-J. Wan, D. Yan, Y.-B. Pei, L. Zhao, Y.-B. Li, L.-B. Wu, J.-X. Jiang and G.-Q. Lai, Carbon, 2013, 60, 16–27 CrossRef CAS.
| This journal is © The Royal Society of Chemistry 2017 |

