 Open Access Article
Creative Commons Attribution 3.0 Unported Licence
Synthesis, structure–property and flame retardancy relationships of polyphosphonamide and its application on epoxy resins†
Wei Zhao *a,
Gong Wanga,
Jiping Liub,
Daming Banc,
Tianjin Chenga,
Xiaodong Liua,
Yongxiang Lia and
Yongqing Huangd
aTechnology and Engineering Center for Space Utilization, Chinese Academy of Sciences, Beijing, 100094, China. E-mail: zhaowei@csu.ac.cn
bSchool of Material Science and Engineering, Beijing Institute of Technology, Beijing, 100081, China
cSchool of Chemistry and Material Science, Guizhou Normal University, Guiyang, 550001, China
dCollege of Chemical and Environmental Engineering, Shandong University of Science and Technology, Qingdao, 266590, China
First published on 26th October 2017
Abstract
A series of polyphosphonamides (PPDA) with heteroatoms and phosphonamide structures are proposed as highly effective flame retardants in epoxy resins (EP). The PPDAs were synthesized by solution polycondensation and well characterized. The impact of the heteroatoms on the thermal properties, pyrolysis route and flammability of PPDAs and their EP composites was investigated in detail. All the PPDAs show good thermal stability, high glass transition temperatures (Tg) and low flammability, associated to their backbone structures. With the addition of PPDAs, the flame retardancy of the composites was gradually enhanced. It is noteworthy that the heat release rate and thermal properties highly depend on the chemical environment of the phosphorus atom in PPDAs. The flame retardant mechanisms are suggested to enhance the charring of EP, protect the matrix in the condensed phase, and have a flame inhibition effect in the gas phase. The potential for increasing flame retardancy and maintaining high Tg and high fracture toughness is highlighted in this study.
1. Introduction
With the rapid development in the design of lightweight materials and advanced composites in modern society, epoxy resins (EPs) have found increasing use as engineering adhesives and as the matrix of fiber reinforced polymers in applications such as new energy automobiles and complex structural aircraft components.1–4 For their application in these thriving markets, high-performance EPs, with good physical properties, high material compatibility and high flame retardancy, need to be developed and fabricated.5,6 EP burns at a rapid heat release rate, producing small amounts of chars, and is unable to achieve any UL-94 rating.7 To obtain a higher flame retardant class, EP requires the addition of chemicals characterized by higher flame retardancy. Traditional EP are mainly prepared by blending with additional compounding with flame retardant additives.8–11 However, a major problem encountered in this system is that the high loading (20 wt%) leads to deterioration of physical properties of EP.12–14Researchers have attempted many methods to develop novel flame retardant for EP, such as layered double hydroxide (LDH),15–17 graphene,18,19 and phenylphosphonicdiamide.19–21
Polymeric flame retardants have shown the advantages of low toxicity, good compatibility, and negligible negative impact on polymer physical properties.22,23 Schartel et al. synthesized a phosphorus-modified polysulfone as both flame retardant and toughness modifier for epoxy resins, and proved that polyphosphates with a hyperbranched structure were more efficient than low-molecular-weight bisphenol A bis(diphenylphosphate) (BDP).24,25 Wang et al. reported that EP/polyphosphate composites exhibit a higher glass transition temperature than pure EP.26,27 Up to now, polymeric flame retardants were mostly represented by polyphosphates (PPEs); however, high loadings were always required to meet the desired flame retardant grade because of their poor flame retardancy.28,29
As families of polymeric flame retardant, polyphosphonamide (PPDAs) have been only scarcely investigated to date. In addition to nitrogen, PPDAs have shown a synergistic effect of P and N to give high thermal stabilities and high flame retardancy.30–32 Tai et al. prepared PPDAs with high char residues, relatively high molecular weight and low flammability.33 Steinmann et al. prepared a series of PPDAs and PPEs with pendant P–O–C structure by acyclic diene metathesis polycondensation, and the obtained PPDAs showed higher thermal stability and higher glass transition temperatures than the analogous PPEs.34 Li et al. prepared a hyperbranched PPDAs, and found that the flame retardant PLA achieved UL-94 V-0 rating with only 2 wt% the hyperbranched PPDAs.35 Such PPDAs possessed impressive high thermal stability and high flame retardancy, but their pendant P–O–C structure often tend to hydrolyze under basic conditions.36,37 Of note, fewer researchers reported that P–C structure possesses excellent hydrolysis stability and higher flame retardancy than P–O–C structure, and such reports hint at potential development of PPDAs with high flame retardancy.38–40 Zhao et al. systemically studied the impact of two types of reactive flame retardant (FR) with P–C and P–O–C structure on the flame retardant efficiency of EP (DGEBA/DDS system).41 The FR with P–C structure showed flame inhibition effect in the gas phase and endow EP with strong self-extinguishing ability at a low phosphorus content (0.7 wt%), whereas FR with P–O–C structure failed to achieve any rating. PPDAs with pendant P–C structure via polycondensation is plausible, although, to the best of our knowledge, such PPDAs have never been applied to develop flame retardant EP.
In this work, we prepared a series of PPDAs with pendent P–C structure by solution polycondensation of phenylphosphonic dichloride and aromatic diamines. The PPDAs have been characterized by 1H NMR and 31P NMR spectroscopy, and applied into flame retardant EPs. To prove the structure–property relationships and widely-useful of the phosphonamide structure with pendent P–C structure, aromatic diamines with methylene group, sulfone group and ether group were employed as staring materials. The thermal stability and flame retardancy of the synthesized PPDAs and flame retardant EP were investigated. The thermal properties of PPDAs and flame retardant EP, such as glass transition temperatures, highly depend on the introduction of microstructure. Besides, the impact of PPDAs on the EP/PPDA composites was studied. More importantly, the structure–property relationships in flame retardant EP were investigated in detail.
2. Experimental
2.1 Materials
Phenylphosphonic dichloride was purchased from Sigma-Aldrich. 4,4′-Diaminodiphenyl sulfone, 4,4′-diaminodiphenyl methane, 4,4′-diaminodiphenyl ether, m-phenylenediamine (m-PDA), dimethyl sulfoxide (DMSO) and ethanol were purchased from Sinopharm Chemical Reagent Beijing Co., Ltd (Beijing, China), were all reagent grade and used as received. Acetonitrile was purchased from Tianjin Guangfu Fine Chemical Research Institute (Tianjin, China) and freshly distilled before use. Epoxy resin (DGEBA, commercial name: E-44) was supplied by Sinopec Baling Company (Yueyang, China).2.2 Synthesis of PPDAs
A typical synthesis of poly(4,4′-diamino diphenyl sulfone phenyl phosphonamide) (POS) is given below.In a dry 250 mL three-neck and round-bottom glass flask equipped with a constant pressure funnel, mechanical stirrer and a reflux condenser, 24.8 g (0.1 mol) of 4,4′-diaminodiphenyl sulfone and 80 mL acetonitrile were mixed at 60 °C for 1 h. Then, a solution of 19.5 g (0.1 mol) phenylphosphonic dichloride in 20 mL acetonitrile was added dropwise to the mixture over 1 h. The temperature of the reaction mixture was gradually raised to refluxing temperature and maintained for another 12 h under a nitrogen gas atmosphere. After cooling to room temperature, the precipitate was filtered and washed with acetonitrile. The crude mixture was then dissolved in minimum of DMSO, and then precipitated into to ethanol give fluffy grey white solid powders which were washed with ethanol. The product was then dried under reduced pressure to give a grey white powder (87%). All the reaction processes are shown in Scheme 1.
The other two PPDAs, poly(4,4′-diamino diphenyl methane phenyl phosphonamide) (POM) and poly(4,4′-diamino diphenyl ether phenyl phosphonamide) (POA) were also prepared in the described method above.
2.3 Preparation of EP/PPDA composites
The obtained PPDAs were used as additive-type flame retardants to combine with DGEBA at 80 °C and mixed in a IKA RW 20 digital stirrer for 10 min, respectively. Then, the curing agent m-PDA were added and mixed with the same method for 3 min. The formulation was poured into an PTFE mould and cured at 80 °C for 2 h and post-cured at 120 °C for 2 h. All samples were slowly cooled to room temperature to avoid stress cracking. In order to determine the flame retardancy of the PPDAs, all samples were prepared with constant loadings of 15 wt% of PPDA, respectively.2.4 Measurements and characterization
3. Results and discussion
3.1 Synthesis and characterization of PPDAs
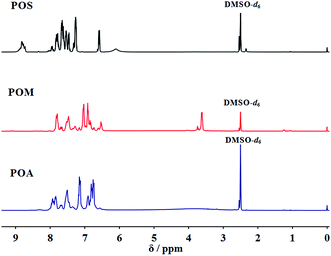
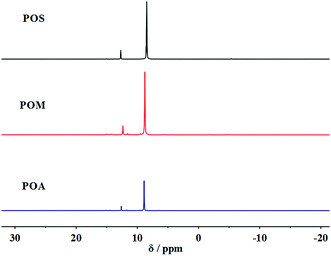
The synthesized PPDAs were also characterized by 1H NMR (Fig. 1) and 31P NMR (Fig. 2) spectroscopy. As for the PPDAs, the multiplied between 6.56 and 7.90 ppm correspond to the protons of the benzene ring. The CH3 protons in POM appear at 3.63 ppm. In addition, a signal at 8.82 ppm in POS representing the protons of the repeat imino group was observed.43 The 31P NMR spectra of the PPDAs all show two signals; one around 8.46 ppm corresponds to the phosphorus in the repeat unit and the other one around 12.61 ppm to the phosphorus in the chain end.44 For example, the phosphorus in the repeat unit is attached to one phenyl group and two imino groups whereas that at the end is attached to one phenyl group, one imino group and one aryloxy group.44 All the spectroscopic data support the structure of PPDAs.
| Sample | Tg (°C) | Tonset (°C) | Tmax (°C) | Char (700 °C, wt%) |
|---|---|---|---|---|
| POS | 191 | 341 | 370 | 48.8 |
| POM | 136 | 288 | 316, 427 | 31.1 |
| POA | 133 | 293 | 315, 437 | 41.4 |
![[double bond, length as m-dash]](https://www.rsc.org/images/entities/char_e001.gif) C vibrations at 1946 and 1801 cm−1) as a result of the decomposition of aromatic compounds was confirmed. It is notable that the characteristic peak of PO compounds was observed at 1035 cm−1 as a weak signal, which may be due to the scission of the phosphonamide structure and play a role in the gaseous flame retardant effect.45 Furthermore, additional strong absorbances of sulfur-containing fragments for POS were found at 1375 and 1340 cm−1, which are attributed to the sulfone groups in the DDS structure.46 As for the second decomposition stage of POM and POA (Fig. 4c), the main pyrolysis gases were aromatic compounds (3055, 1616 and 1508 cm−1), CO2 (2355 and 670 cm−1) and PO compound (968 cm−1), similar to those detected during the first decomposition stage.45 Besides, aromatic C–O compounds (1332 cm−1) were identified as thermal decomposition products for POA.
C vibrations at 1946 and 1801 cm−1) as a result of the decomposition of aromatic compounds was confirmed. It is notable that the characteristic peak of PO compounds was observed at 1035 cm−1 as a weak signal, which may be due to the scission of the phosphonamide structure and play a role in the gaseous flame retardant effect.45 Furthermore, additional strong absorbances of sulfur-containing fragments for POS were found at 1375 and 1340 cm−1, which are attributed to the sulfone groups in the DDS structure.46 As for the second decomposition stage of POM and POA (Fig. 4c), the main pyrolysis gases were aromatic compounds (3055, 1616 and 1508 cm−1), CO2 (2355 and 670 cm−1) and PO compound (968 cm−1), similar to those detected during the first decomposition stage.45 Besides, aromatic C–O compounds (1332 cm−1) were identified as thermal decomposition products for POA.
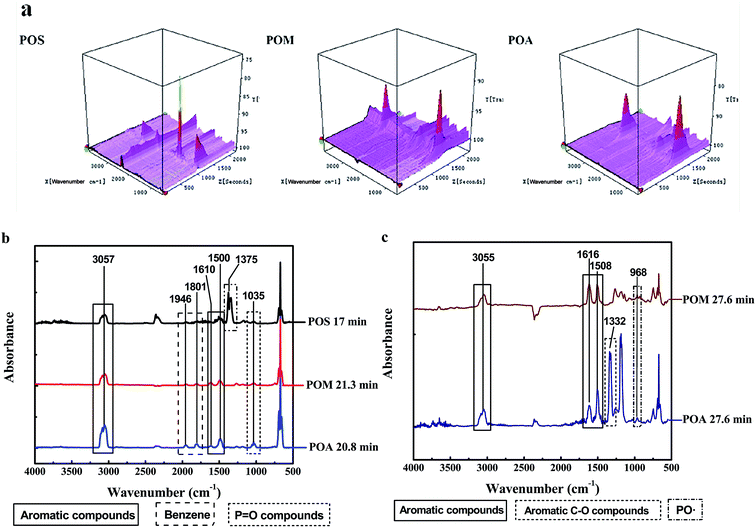 | ||
| Fig. 4 3D curves of the TG-FTIR spectra for the PPDAs (a) and the extracted FTIR spectra of the evolved pyrolysis gas at Tmax1 (b) and Tmax2 (c). | ||
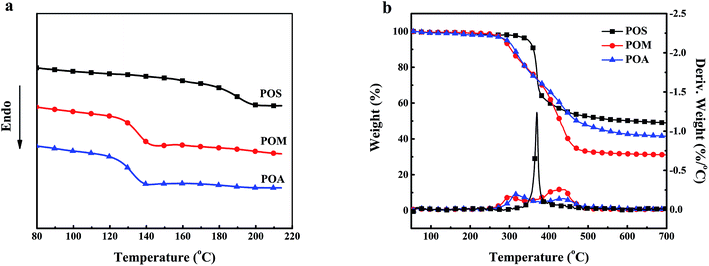
To summarize, the decomposition of the PPDAs can be divided into two steps; the first step is scission of the pendant group and the main chain of the polymers, corresponding to a few of aromatic fragments, the other is pyrolysis and charring of the residue at higher temperature. This result was also agreed with the two decomposition steps observed in the TGA curves of POA and POM. As for the one-step decomposition of POS, this may be explained by the overlap of the two decomposition steps.
| Sample | HRC (J g−1 K) | PHRR (W g−1) | THR (kJ g−1) |
|---|---|---|---|
| POS | 330 | 582.6 | 15.4 |
| POM | 166 | 294.2 | 20.5 |
| POA | 97 | 165.2 | 18.5 |
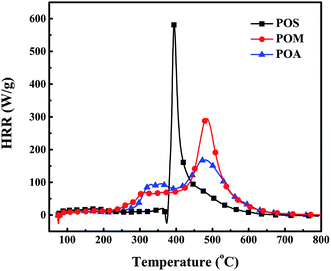
As for POS, it exhibits a sharp heat release peak and gives the highest HRC value of 330 J g−1 K. In the case of POM and POA, there are much broader heat release regions, between 250 to 600 °C and lower HRC values of 166 and 97 J g−1 K, respectively, compared to POS, indicating lower flammability. Generally speaking, the HRC value is mainly decided by two factors: the maximum decomposition rate and the heat of combustion of the pyrolysis gases decomposed at the temperature. From Fig. 5, it can be observed that the sulfur-containing gases were released at the maximum decomposition rate, which leads to a higher HRC value. The PHRR values of the PPDAs are similar to their HRC values. It is worth noting that POS also exhibits the lowest THR value of 15.4 kJ g−1, while POM and POA give higher values of 20.5 and 18.5 kJ g−1, respectively. It directly demonstrates that the incorporation of S or O into the backbone of polymers could efficiently reduce its flammability. It seems that a polymer with more heteroatom as well as high char residue yields possesses lower flammability.
Above all, the synthesized PPDAs all possess high glass transition temperature, good thermal stability, high char yield and lower flammability, associated to their backbone structures. Aromatic compounds and phosphorus-containing pyrolysis gases were detected as products of the thermal decomposition of the PPDAs. An expected high efficiency in flame retardancy could be deduced by the good thermal properties, lower flammability and phosphorus-containing gases generated from the PPDAs.
3.2 Thermal properties of EP and EP/PPDA composites
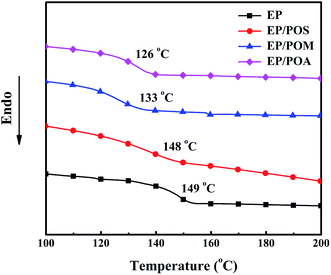
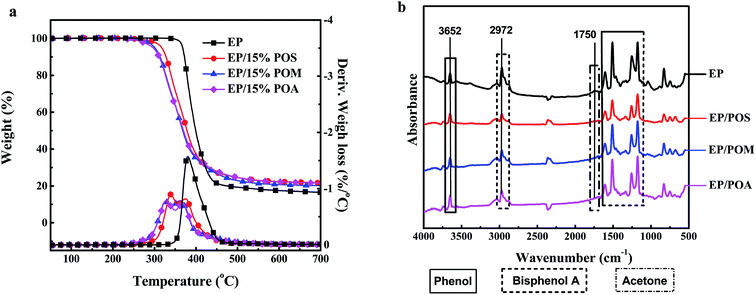
![[double bond, length as m-dash]](https://www.rsc.org/images/entities/char_e001.gif) C vibrations at 1609 cm−1. The peak at 1338 cm−1 is the typical absorption bands of aromatic C–O stretch of phenol and bisphenol A. The peak at 2972 cm−1 attribute the CH3 stretch of bisphenol A. Further, the broad peak at 1750 cm−1 and the strong peak at 1250 cm−1 confirm the presence of acetone as thermal decomposition products of EP and EP/PPDA composites.25 Furthermore, the weak peak at 3386 cm−1 is proposed as decomposition products of the curing agent m-PDA and PPDAs.
C vibrations at 1609 cm−1. The peak at 1338 cm−1 is the typical absorption bands of aromatic C–O stretch of phenol and bisphenol A. The peak at 2972 cm−1 attribute the CH3 stretch of bisphenol A. Further, the broad peak at 1750 cm−1 and the strong peak at 1250 cm−1 confirm the presence of acetone as thermal decomposition products of EP and EP/PPDA composites.25 Furthermore, the weak peak at 3386 cm−1 is proposed as decomposition products of the curing agent m-PDA and PPDAs.As for the EP/PPDA composites, the characteristic peaks of PPDAs such as P![[double bond, length as m-dash]](https://www.rsc.org/images/entities/char_e001.gif) O stretch at 1045 cm−1 and P–O stretch at 887 cm−1 of phosphates, phosphites, and phosphoric acid derivatives were detected as a weak signal and shifted in comparison with PPDAs, indicating a change in the chemical environment. The absence of phenol, bisphenol (3652 cm−1, 1609 cm−1), and acetone (1750 cm−1, 1250 cm−1) remained in comparison to EP.25 Besides, the reduced absorbance of flammable gases (acetone and bisphenol A) (Fig. 7b) and increased char residue at 700 °C demonstrate the reactions between PPDAs and EP, indicating the probable gas-phase activity of the PPDAs in flame retardancy.
O stretch at 1045 cm−1 and P–O stretch at 887 cm−1 of phosphates, phosphites, and phosphoric acid derivatives were detected as a weak signal and shifted in comparison with PPDAs, indicating a change in the chemical environment. The absence of phenol, bisphenol (3652 cm−1, 1609 cm−1), and acetone (1750 cm−1, 1250 cm−1) remained in comparison to EP.25 Besides, the reduced absorbance of flammable gases (acetone and bisphenol A) (Fig. 7b) and increased char residue at 700 °C demonstrate the reactions between PPDAs and EP, indicating the probable gas-phase activity of the PPDAs in flame retardancy.
3.3 Flame retardant properties of EP and EP/PPDA composites
As shown in Table 4, pure EP had no rating in UL-94 vertical tests, and a LOI value is 24.7%. For EP/PPDA composites, the LOI value increased with the incorporation of the PPDAs. While the LOI value of EP/POM increased to 28.9%, the UL-94 rating achieved a V-1 rating. When 15 wt% POS or POA was incorporated into EP, the UL-94 test achieved a V-0 rating, indicating a significant contribution of the heteroatom towards obtaining a reduced flammability. Obviously, the PPDAs are a series of efficient mono-component flame retardant for EP.
| Sample | LOI (%) | UL-94 | |||
|---|---|---|---|---|---|
| t1 (s) | t2 (s) | Dripping | Rating | ||
| EP | 24.7 | Infinite | — | No | No rating |
| EP/POS | 29.5 | 6 | 3 | No | V-0 |
| EP/POM | 28.9 | 19 | 36 | No | V-1 |
| EP/POA | 29.6 | 9 | 1 | No | V-0 |
| Sample | THR (MJ m−2) | PHRR (kW m−2) | TML (wt%) | av-EHC (MJ kg−1) | THR/TML (MJ m−2 g−1) | av-HRR (kW s−1 m−2) |
|---|---|---|---|---|---|---|
| EP | 77 ± 10 | 944 ± 88 | 95.2 ± 0.7 | 16.1 ± 0.8 | 3.7 ± 0.1 | 233 ± 25 |
| EP/15% POS | 54 ± 3 | 462 ± 25 | 78.8 ± 0.7 | 13.5 ± 0.4 | 3.1 ± 0.1 | 154 ± 20 |
| EP/15% POM | 54 ± 2 | 508 ± 10 | 79.4 ± 0.1 | 13.6 ± 0.5 | 3.1 ± 0.1 | 176 ± 20 |
| EP/15% POA | 52 ± 2 | 492 ± 20 | 79.5 ± 0.2 | 12.7 ± 0.5 | 3.0 ± 0.1 | 163 ± 11 |
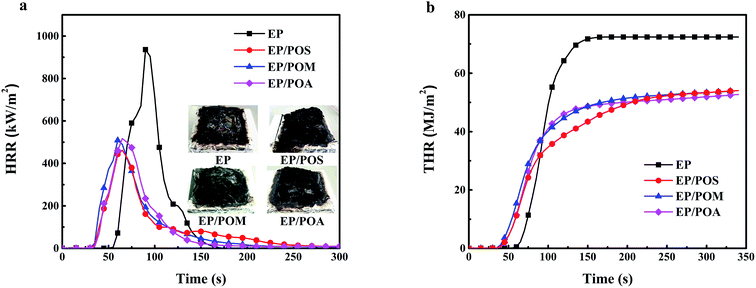 | ||
| Fig. 9 Cone calorimeter results: (a) heat release rate (HRR) of EP and EP/PPDA composites versus time, (b) total heat release (THR) of EP and EP/PDPA composites versus time. | ||
The THR divided by the total mass loss (THR/TML) equals the product between effective heat of combustion of the volatiles and the combustion efficiency.25 The THR/TML ratio for EP/PPDA composites was reduced by 16% due to flame inhibition. Moreover, monitoring the CO/CO2 ratio (Fig. 10) during cone calorimeter tests shows the peak CO/CO2 ratios of EP/POS, EP/POM, and EP/POA increased by 212%, 174% and 211% over EP, respectively. Thus, PPDAs in EP worked in the gas phase as well as in the condensed phase.
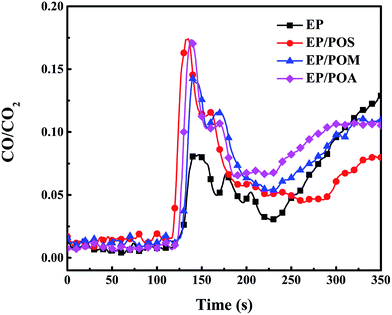 | ||
| Fig. 10 CO/CO2 weight ratio as a function of time during cone calorimeter tests for EP and EP/PPDA composites. | ||
In order to evaluate the flame retardant effect quantitatively, the main flame retardant modes of action were calculated according to eqn (1)–(3).47,48 The results are listed in Table 6. With the addition of PPDAs, the flame inhibition effect, charring effect, and barrier and protective effect of EP/PPDA composites all sharply increased compared with EP. It can be concluded that the flame inhibition effect of PPDAs is composed of the radical quenching effect and the dilution effect of volatile phosphorus-based pyrolysis gases. The best results in terms of increasing charring effect and barrier and protective effect were achieved by EP/POS compared to EP/POM and EP/POA, indicating that sulfone group in PPDA were more efficient in condensed phase action than methyl group and ether group. It is also noted that EP/POA showed a better flame inhibition effect than EP/POS and EP/POM, which may correspond to more phosphorus contents were released into gas phase. The protective barrier effect combined with flame inhibition effect plays a dominant role in the flame retardant performance of PPDAs in EP.
| Flame inhibition effect = 1 − EHCEP/PPDA/EHCEP | (1) |
| Charring effect = 1 − TMLEP/PPDA/TMLEP | (2) |
| Barrier and protective effect = 1 − (PHRREP/PPDA/PHRREP)/(THREP/PPDA/THREP) | (3) |
| Samples | Flame inhibition effect | Charring effect | Barrier and protective effect |
|---|---|---|---|
| EP/POS | 16% | 17.2% | 30% |
| EP/POM | 15% | 16.6% | 23% |
| EP/POA | 21% | 16.5% | 23% |
| Samples | C | N | O | P | S |
|---|---|---|---|---|---|
| EP/POS external | 75.98 | 4.33 | 17.68 | 1.33 | 0.69 |
| EP/POS internal | 80.34 | 3.67 | 14.04 | 0.56 | 1.38 |
| EP/POM external | 76.55 | 5.99 | 16.16 | 1.30 | — |
| EP/POM internal | 82.01 | 4.35 | 12.93 | 0.70 | — |
| EP/POA external | 76.03 | 5.45 | 16.92 | 1.61 | — |
| EP/POA internal | 82.00 | 3.86 | 13.91 | 0.23 | — |
3.4 Pyrolysis behaviors of POS
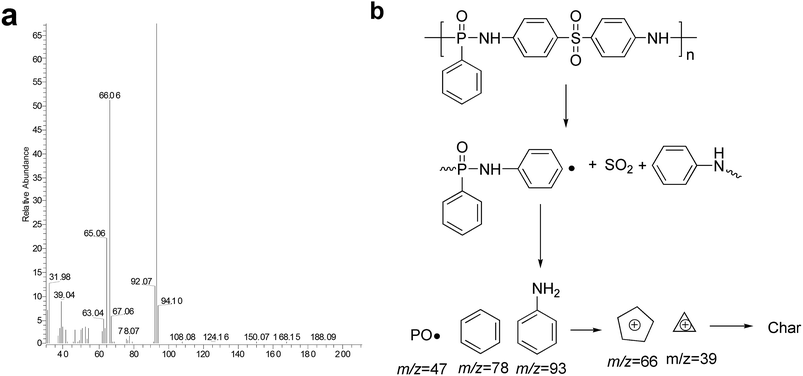
The pyrolysis behavior of POS was investigated by pyrolysis-GC/MS. In this part of the study, POS was selected to be representative sample of PPDAs. The recorded total ion chromatogram and the speculative decomposition route is presented in Fig. 11. The ion fragments, such as 66, 78 m/z for benzene and 94 m/z for aminobenzene, is mainly attributed to the decomposition products of phosphonamide and diphenyl sulfone structure.41 The peaks at 47, 63, and 94 m/z were assigned to PO, PO2 and P2O2 compound, which could act radical-scavenging mechanism during combustion.41,50 Speculative decomposition route of POS is shown in Fig. 11b. Phosphorous acid (H3PO3) was supposed to promote the char forming process in the condensed phase.3.5 Flame retardant mechanism
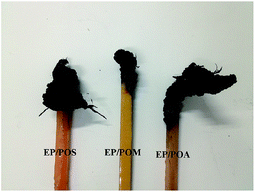
Combining the analysis in Section 3.2.3 and 3.3 about thermal decomposition behaviors and flame retardant properties of EP and EP/PPDA composites with 3.4 pyrolysis behaviors of POS, flame retardant mechanism of PPDAs in EP are proposed as below.In the condensed phase, PPDAs promote the decomposition and char-forming processes of EP at a low temperature. The acid compounds (H3PO3) from the thermal decomposition of PPDAs could also promote the char-forming process of EP matrix and the formation of protective char layers. The char yield observed in the cone test was increased from 4.8 wt% for EP up to about 21 wt% for EP/PPDA composites as evidence. The phosphorus and oxygen contents in the external char layer are higher than that from samples of internal char layer, indicating a better oxidation resistance of the protective char layer. The phosphorus-containing char layer could act as barrier to hinder the exchange of fuel, oxygen and heat between EP matrix and fire zone.
In the gas phase, PPDAs in EP showed obvious flame inhibition effect during combustion. As seen from Fig. 11, the pyrolysis behaviors of POS confirmed the presence of phosphorus-containing radicals in the decomposition route. As shown in Table 5, the reduced combustion efficiency also demonstrate the flame inhibition effect of PPDAs in the gas phase. The phosphorus-containing radicals could interrupt the chain reaction during combustion of EP.
Above all, the flame retardant mechanism of PPDAs in EP could be summarized as follows: char forming effect and barrier and protective effect in the condensed phase, flame inhibition effect in the gas phase. Moreover, as shown in Table 6, the heteroatom in PPDAs have slightly influence on the flame retardant mechanism of EP/PPDA composites, such as barrier and protective effect and flame inhibition effect.
3.6 Fracture toughness of EP and EP/PPDA composites
The quasi-static fracture toughness values, KIC, of EP and EP/PPDA composites are present in Table 8. As expected, the fracture toughness of EP/POS resulted in a moderate increase in KIC. In previous research, it is reported that phosphorus-containing polysulfone could act as toughness modifier for EP.51 The sulfone group in POS could endow EP with high fracture toughness. For EP/POM and EP/POA, the incorporation of POM and POA did not showed a serious deterioration on fracture toughness of EP, which may be explained by the decrease of crosslinking density of EP. Thus, the incorporation of PPDAs into EP showed some promising improvements in flame retardancy as well as slightly influence on fracture toughness.| Samples | KIC (MPa m1/2) |
|---|---|
| EP | 0.89 ± 0.05 |
| EP/POS | 0.93 ± 0.06 |
| EP/POM | 0.79 ± 0.05 |
| EP/POA | 0.83 ± 0.08 |
4. Conclusions
A series of PPDAs with different backbone structure were successfully synthesized and well characterized. The thermal properties, thermal degradation behaviors and flammability were investigated. The results showed that the PPDAs exhibit high thermal stability, high glass transition temperature and low flammability, associated to their backbone structures. The following order of thermal stability and char forming efficiencies of the incorporated groups were obtained: –SO2– > –O– > –CH2–. From TGA-FTIR results, the pyrolysis gases of the PPDAs have been found to be mainly aromatic compounds and phosphorus-containing gases. The high char yield, low flammability, generated phosphorus-containing gases indicated the potential high flame retardancy of the PPDAs.Cone calorimeter, LOI and UL-94 vertical burning tests all demonstrated the addition of PPDAs into EP have greatly enhanced flame retardancy of the composites. Due to the incorporation of heteroatom, POS and POA show better flame retardant performances in LOI and UL-94 tests than POM. Meanwhile, EP/POS shows a similar Tg with pure EP, which is attributed to the hydrogen-bond interaction. The heat release rate and thermal properties of flame retardant EP were highly depend on the chemical surrounding of phosphorus atom in PPDAs. The flame retardant mechanism of PPDAs in EP can be devices by the charring effect, barrier and protective effect in the condensed phase, and the flame inhibition effect in the gas phase. In addition, the incorporation of heteroatom into PPDAs could enhance the flame retardancy of EP composites, such as the sulfone group in promoting char forming process and the ether group in flame inhibition effect in gas phase. This paper might promote a directed design of new composites with high flame retardancy, glass transition temperature and fracture toughness for future applications, and provide a rapid approach to determine the flame retardancy of novel flame retardant.
Conflicts of interest
There are no conflicts to declare.Acknowledgements
Financial supported by the Prospective Project of Technology and Engineering Center for Space Utilization, CAS, Grant No. CSU-QZKT-201708, and the joint fund of Key Research Program of Frontier Sciences, CAS, Grant No. QYZDB-SSW-JSC050.References
- B. Schartel, B. Perret, B. Dittrich, M. Ciesielski, J. Krämer, P. Müller, V. Altstädt, L. Zang and M. Döring, Macromol. Mater. Eng., 2016, 301, 9–35 CrossRef CAS.
- S. L. Qiu, X. Wang, B. Yu, X. M. Feng, X. W. Mu, R. K. K. Yuen and Y. Hu, J. Hazard. Mater., 2017, 325, 327–339 CrossRef CAS PubMed.
- E. N. Kalali, X. Wang and D. Y. Wang, Ind. Eng. Chem. Res., 2016, 55, 6634–6642 CrossRef CAS.
- Y. Qiu, L. J. Qian and W. Xi, RSC Adv., 2016, 6, 56018–56027 RSC.
- P. Müller, M. Morys, A. Sut, C. Jäger, B. Illerhaus and B. Schartel, Polym. Degrad. Stab., 2016, 130, 307–319 CrossRef.
- W. J. Liang, B. Zhao, P. H. Zhao, C. Y. Zhang and Y. Q. Liu, Polym. Degrad. Stab., 2017, 135, 140–151 CrossRef CAS.
- C. Ma, B. Yu, N. N. Hong, Y. Pan, W. Z. Hu and Y. Hu, Ind. Eng. Chem. Res., 2016, 55, 10868–10879 CrossRef CAS.
- G. M. Wu, B. Schartel, H. Bahr, M. Kleemeier, D. Yu and A. Hartwig, Combust. Flame, 2012, 159, 3616–3623 CrossRef CAS.
- B. Perret, B. Schartel, K. Stöβ, M. Ciesielski, J. Diederichs, M. Döring, J. Krämer and V. Altstädt, Macromol. Mater. Eng., 2011, 296, 14–30 CrossRef CAS.
- M. Rakotomalala, S. Wagner and M. Döring, Materials, 2010, 3, 4300–4327 CrossRef CAS PubMed.
- C. Klinkowski, S. Wagner, M. Ciesielski and M. Döring, Polym. Degrad. Stab., 2014, 106, 122–128 CrossRef CAS.
- N. N. Tian, J. Gong, X. Wen, K. Yao and T. Tang, RSC Adv., 2014, 4, 17607–17614 RSC.
- S. M. Unlu, S. D. Dogan and M. Dogan, Polym. Adv. Technol., 2014, 25, 769–776 CrossRef CAS.
- C. Gérard, G. Fontaine and S. Bourbigot, Materials, 2010, 3, 4476–4499 CrossRef PubMed.
- E. N. Kalali, X. Wang and D. Y. Wang, J. Mater. Chem. A, 2015, 3, 6819–6826 CAS.
- X. Wang, E. N. Kalali and D. Y. Wang, ACS Sustainable Chem. Eng., 2015, 3, 3281–3290 CrossRef CAS.
- E. N. Kalali, X. Wang and D. Y. Wang, Ind. Eng. Chem. Res., 2016, 55, 6634–6642 CrossRef CAS.
- Y. Liu, H. V. Babu, J. Q. Zhao, A. Goñi-Urtiaga, R. Sainz, R. Ferritto, M. Pita and D. Y. Wang, Composites, Part B, 2016, 89, 108–116 CrossRef.
- J. T. Luo, S. R. Yang, L. Q. Lei, J. Q. Zhao and Z. Tong, Composites, Part A, 2017, 100, 275–284 CrossRef CAS.
- X. M. Zhao, D. Xiao, J. P. Alonso and D. Y. Wang, Mater. Des., 2017, 114, 623–632 CrossRef CAS.
- C. Ma, B. Yu, N. N. Hong, Y. Pan, W. Z. Hu and Y. Hu, Ind. Eng. Chem. Res., 2016, 55, 10868–10879 CrossRef CAS.
- T. C. Mauldin, M. Zammarano, J. W. Gilman, J. R. Shields and D. J. Boday, Polym. Chem., 2014, 5, 5139–5146 RSC.
- H. M. Stapleton, S. Klosterhaus, A. Keller, P. L. Ferguson, S. Van Bergen, E. Cooper, T. F. Webster and A. Blum, Environ. Sci. Technol., 2011, 45, 5323–5331 CrossRef CAS PubMed.
- R. M. Perez, J. K. W. Sandler, V. Altstädt, T. Hoffmann, D. Pospiech, M. Ciesielski, M. Döring, U. Braun, A. I. Balabanovich and B. Schartel, Polymer, 2007, 48, 778–790 CrossRef CAS.
- K. Täuber, F. Marsico, F. R. Wurm and B. Schartel, Polym. Chem., 2014, 5, 7042–7053 RSC.
- X. Wang, Y. Hu, L. Song, W. Y. Xing, H. D. Lu, P. Lv and G. X. Jie, Polymer, 2010, 51, 2435–2445 CrossRef CAS.
- X. Wang, L. Song, W. Y. Xing, H. D. Lu and Y. Hu, Mater. Chem. Phys., 2011, 125, 536–541 CrossRef CAS.
- L. Chen and Y. Z. Wang, Materials, 2010, 3, 4746–4760 CrossRef CAS PubMed.
- W. Zhao, J. P. Liu, Y. Zhang and D. M. Ban, RSC Adv., 2015, 5, 80415–80423 RSC.
- H. Y. Ma and Z. P. Fang, Thermochim. Acta, 2012, 543, 130–136 CrossRef CAS.
- P. A. Song, H. Liu, Y. Shen, B. X. Du, Z. P. Fang and Y. Wu, J. Mater. Chem., 2009, 19, 1305–1313 RSC.
- W. Zhao, J. P. Liu, H. Peng, J. Y. Liao and X. J. Wang, Polym. Degrad. Stab., 2015, 118, 120–129 CrossRef CAS.
- Q. L. Tai, Y. Hu, R. K. K. Yuen, L. Song and H. D. Lu, J. Mater. Chem., 2011, 21, 6621–6627 RSC.
- M. Steinmann, M. Wagner and F. R. Wurm, Chemistry, 2016, 22, 17329–17338 CrossRef CAS PubMed.
- Z. Li, P. Wei, Y. Yang, Y. G. Yan and D. Shi, Polym. Degrad. Stab., 2014, 110, 104–112 CrossRef CAS.
- J. M. Park, J. Y. Lee and Y. H. Park, Macromol. Res., 2010, 18, 539–544 CrossRef CAS.
- M. Papanastasiou, A. W. McMahon, N. S. Allen, A. M. Doyle, B. J. Johnson and K. Keck-Antoine, Polym. Degrad. Stab., 2006, 91, 2675–2682 CrossRef CAS.
- U. Braun, A. I. Balabanovich, B. Schartel, U. Knoll, J. Artner, M. Ciesielski, M. Döring, R. Perez, J. K. W. Sandler and V. Altstädt, Polymer, 2006, 47, 8495–8508 CrossRef CAS.
- R. M. Perez, J. K. W. Sandler, V. Altstädt, T. Hoffmann, D. Pospiech, J. Artner, M. Ciesielski, M. Döring, A. I. Balabanovich, U. Knoll, U. Braun and B. Schartel, J. Appl. Polym. Sci., 2007, 105, 2744–2759 CrossRef CAS.
- J. Jing, Y. Zhang, X. L. Tang and Z. P. Fang, RSC Adv., 2016, 6, 49019–49027 RSC.
- X. M. Zhao, H. V. Babu, J. Llorca and D. Y. Wang, RSC Adv., 2016, 6, 59226–59236 RSC.
- W. Vogt and S. Balasubramanian, Macromol. Chem., 1973, 163, 111–134 CrossRef CAS.
- X. Wang, W. Y. Xing, X. M. Feng, B. Yu, L. Song and Y. Hu, Polym. Chem., 2014, 5, 1145–1154 RSC.
- K. S. Annakutty and K. Kishore, Polymer, 1988, 29, 756–761 CrossRef CAS.
- L. J. Qian, L. J. Ye, Y. Qiu and S. R. Qu, Polymer, 2011, 52, 5486–5493 CrossRef CAS.
- F. Samperi, C. Puglisi, T. Ferreri, R. Messina, G. Cicala, A. Recca, C. L. Restuccia and A. Scamporrino, Polym. Degrad. Stab., 2006, 92, 1304–1315 CrossRef.
- S. Brehme, T. Köppl, B. Schartel and V. Altstädt, e-Polym., 2014, 14, 193–208 CAS.
- T. Shuo, V. Wachtendorf, P. Klack, L. J. Qian, Y. P. Dong and B. Schartel, RSC Adv., 2017, 7, 720–728 RSC.
- M. Lewin, J. Brozek and M. M. Martens, Polym. Adv. Technol., 2002, 13, 1091–1102 CrossRef CAS.
- B. Schartel, Materials, 2010, 3, 4710–4745 CrossRef CAS PubMed.
- R. M. Perez, J. K. W. Sandler, V. Altstädt, T. Hoffmann, D. Pospiech, M. Ciesielski, M. Döring, U. Braun, A. I. Balabanovich and B. Schartel, Polymer, 2007, 48, 778–790 CrossRef CAS.
Footnote |
| † Electronic supplementary information (ESI) available. See DOI: 10.1039/c7ra08318a |
| This journal is © The Royal Society of Chemistry 2017 |


