 Open Access Article
Contribution of surface functional groups and interface interaction to biosorption of strontium ions by Saccharomyces cerevisiae under culture conditions
Mingxue Liu a,
Faqin Dong*b,
Wei Zhangb,
Xiaoqin Niec,
Hongfu Weia,
Shiyong Sunb,
Xiaomei Zhonga,
Yuqi Liua and
Danni Wanga
aLife Science and Engineering College, Southwest University of Science and Technology, Mianyang 621010, China
bKey Laboratory of Solid Waste Treatment and Resource Recycle, Ministry of Education of China, Mianyang 621010, China. E-mail: fqdong@swust.edu.cn; Fax: +86-816-6089013; Tel: +86-816-6089013
cChina Fundamental Science on Nuclear Wastes and Environmental Safety Laboratory, Southwest University of Science and Technology, Mianyang 621010, China
First published on 1st November 2017
Abstract
Contribution of surface functional groups and detailed interface interaction for biosorption of strontium ions by Saccharomyces cerevisiae under culture conditions was investigated through chemical modification, in addition to spectroscopic and mesoscopic methods. The results showed that the biosorption ratio decreased approximately 10%, 60%, and 70% for ester group, carboxyl group, and amino group modified yeast cells, respectively. Fourier transform infrared spectroscopy and surface functional group potentiometric titration results revealed that –NH2, –COOH, and –OH were the major binding groups. The amino group displayed the greatest contribution to biosorption of strontium ions, followed by the carboxyl group and, finally, the ester group. Electrostatic interaction was the initial role and establishment of a coordination complex was the most common mechanism of interface interaction between strontium ions and the yeast cell surface. Mesoscopic analysis suggested that strontium ions may be first adsorbed on the cell surface and then transported into the cytoplasm. Transmembrane transport and the bioaccumulation model revealed that yeast cells may regulate the distribution of strontium ions through a transportation mechanism. A detailed interface interaction was discussed for S. cerevisiae biosorption of low concentration strontium ions under culture conditions. The results suggested that optimal biosorption for a microorganism relies upon enrichment of proteins and polysaccharides on the cell surface.
1. Introduction
The biosorption of strontium ions has been carried out with different biomasses.1–6 However, the mechanism underpinning the biosorption interface interaction is not fully understood, particularly with respect to following points. (1) Electrostatic interaction and ion exchange: electrostatic interactions are thought to exist in many instances of biosorption for heavy metals.7,8 However, this is not the main contributing factor for biosorption.7 Marešová et al. (2011) suggested that Sr2+ may undergo ion exchange with Ca2+ during biosorption.3 For example, equivalent amounts of Ca2+ and (or) Mg2+ were released during the biosorption of Sr2+.9–12 (2) Coordination and complexation: several charged functional groups on cell surface can complex with metal ions. Microorganisms may accumulate Ca2+, Mg2+, Cd2+, Zn2+, Cu2+, Hg2+ and Pb2+ through coordination and complexation.13,14 (3) Bioaccumulation and precipitation: bioaccumulation is thought to be an active uptake process associated with cell metabolism.1,6,15 Gola et al. (2016) observed that multiple heavy metal ions underwent bioaccumulation in the fungi Beauveria bassiana.16 Some mathematical models have been established to describe bioaccumulation process.6,15 Krejci et al. (2011) proposed a “sulfate trap” model in Closterium moniliferum for coprecipitation of Sr2+ and Ba2+.5 Precipitation is a possible mechanism for biosorption of Cr, Cu, Zn, Ag, and other metal ions.17–19 (4) Combination effects: mechanisms relating to electrostatic interactions, ion exchange, and similar phenomena often work cooperatively.7 Kazy et al. (2009) proposed an ion exchange, complexation and microprecipitation mechanism to explain the bioremoval of U and Th.12 The surface complexation and electrostatic attraction played an important role in biosorption of Cd2+ by Bacillus cereus, and bioaccumulation was the predominant mechanism for lower concentration metal ions.20However, a quantitative study on the contribution of surface functional groups to biosorption has not been reported in the literatures. Some studies investigated the role of functional groups to biosorption using spectroscopic method.2,8,14,21–24 The other reports indirectly proved that some functional groups were required for biosorption by pretreated biomasses.10,25–27 Besides these, few studies have focused on the interface interactions between metal ions and cell surface of microorganism under culture conditions. Such work will improve our understanding of the biosorption mechanism. It will also lay a foundation for better optimizing the biosorption process parameters and screening for microorganisms with higher biosorption efficiencies.
High concentration strontium ions (c0 > 100 mg L−1) may form precipitate with culture medium,4 while biosorption under culture conditions was a valid method for treatment of low concentration strontium ions.4,6 In this research, we evaluated the contribution of different functional groups to biosorption of strontium ions (c0 ≤ 100 mg L−1) by yeast cells before and after shielding the functional groups. Interface interaction between strontium ions and yeast cell was investigated through a chemical modification method, followed by spectroscopic and mesoscopic analyses, as well as mathematical methods. A detailed interface interaction for the biosorption of low concentration strontium ions was discussed based on the results of this study and other findings in the literatures.
2. Material and methods
2.1 Reagents and S. cerevisiae strain
All chemical reagents were of analytical grade. The strontium stock solution (500.0 mg L−1) was prepared by dissolving 1.258 g of strontium nitrate (Sr(NO3)2) in 1000.0 mL distilled deionized water.The yeast Saccharomyces cerevisiae was provided by the Experiment Center of Life Science and Engineering College at Southwest University of Science and Technology.
2.2 Chemical modifications of S. cerevisiae cells
Chemical modifications were carried out according to the literature as follows:28Control yeast cells were centrifuged (RT, 20 min, 4000 rpm). The pellets were collected and dried at 60 °C.
2.3 Characterization of yeast cell characteristics before and after chemical modification
The acidity constant and site density for yeast cell surface functional groups before and after chemical modification were measured with potentiometric titration using an autotitrator (ZDJ-4B, China) according to literature.27 The data was fitted with program ProtoFit Version 2.0.27,29 The cell viability assays was carried out with fluorophores SYT09 and propidium iodide (PI) dual staining (ThermoFisher), which was observed through confocal laser scanning microscope (Leica TCS SP8), as well as MTT (3-(4,5-dimethyl-2-thiazolyl)-2,5-diphenyl-2H-tetrazolium bromide, Beyotime, China) assay according to literatures.30,312.4 Biosorption of strontium ions by control and chemically modified as well as living S. cerevisiae4
The calculated volumes of strontium stock solutions were mixed with suspensions of S. cerevisiae cells prepared as described above to yield the following starting concentrations of strontium ions: 0.0, 10.0, 50.0, and 100.0 mg L−1. After a preset biosorption time, cell suspensions were centrifuged (RT, 15 min, 4000 rpm). Supernatants were collected to quantify the concentration of residual strontium ions. The pellets were collected for analysis of the interface interactions between S. cerevisiae cells and strontium ions.The biosorption ratio (R) was calculated according to the following eqn (1):
 | (1) |
The free strontium ions in solution (cMe, mg g−1), the strontium ion concentration on the cell walls (cpas, mg g−1) and the strontium ion concentration in the cytoplasm (cact, mg g−1) were measured according to literatures.4,6
2.5 Zeta potential analysis
The surface charge changes of live, control, chemical modified yeast cells before and after biosorption of strontium ions were measured using a zeta potential analyzer (NanoBrook 90 Plus PALS, Brookhaven) according to literatures.27,322.6 FTIR, SEM, AFM and TEM analysis
Fourier transform infrared (FTIR, Nicolet-5700, THERMO) and scanning electron microscopy (SEM, Leica-S440; Ultra 55, ZEISS) samples were prepared and analyzed according to a previous report.4 Atomic force microscopy (AFM, SPA300HV, Seiko Instruments) samples were prepared and analyzed according to the literature.18 Microstructures on the cell surface were observed by JEOL JSM-6700F field-emission scanning electron microscopy (FESEM) at Hefei National Laboratory for Physical Sciences at the Microscale (HFNL), Hefei, Anhui. Transmission electron microscopy (TEM, Tecnai G2 F20 S-TWIN, FEI) was carried out at Analysis and Testing Center of Sichuan University, Chengdu, Sichuan.3. Results and analysis
3.1 Changes in the functional groups and cell's viability of chemically modified S. cerevisiae
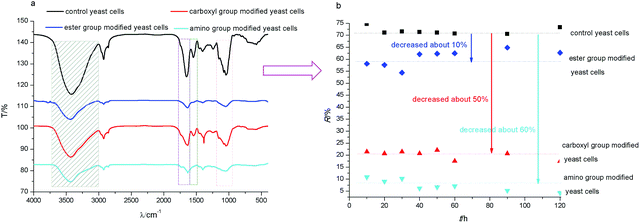
The FTIR spectrum of untreated yeast showed some characteristic peaks normally associated with the presence of microorganisms (Fig. 1a). The broad peak at 3392.3 cm−1 indicated the presence of both amine (νN–H) and bonded hydroxyl (νO–H) groups. The peaks at 1656.5 cm−1, 1543.1 cm−1, and 1243.8 cm−1 corresponded to the amide I, amide II, and amide III bands, respectively. The peak at 1402.0 cm−1 was the νC–O and δνC![[double bond, length as m-dash]](https://www.rsc.org/images/entities/char_e001.gif) O of –COOH. The peak at 1150.3 cm−1 was the stretching frequency for –C
O of –COOH. The peak at 1150.3 cm−1 was the stretching frequency for –C![[double bond, length as m-dash]](https://www.rsc.org/images/entities/char_e001.gif) O. The peak at 1079.0 cm−1 was the symmetrical stretching vibration of the phosphodiester group [υs(–PO2−)]. The peak at 1044.9 cm−1 represented the vibration absorption of the polysaccharide skeleton glycitols (–C–OH) and the stretching peak of –C–O–P.8,24,25,27,33
O. The peak at 1079.0 cm−1 was the symmetrical stretching vibration of the phosphodiester group [υs(–PO2−)]. The peak at 1044.9 cm−1 represented the vibration absorption of the polysaccharide skeleton glycitols (–C–OH) and the stretching peak of –C–O–P.8,24,25,27,33
Compared to the control group, the FTIR spectrum for ester group modified yeast cells (Fig. 1a) showed that the hydroxyl group blue-shifted by 7 cm−1. The amide I and amide II bands red-shifted by 9 cm−1 and 7 cm−1, respectively. The –C–O–P peak red-shifted by 3.6 cm−1. These results indicated that the ester group modification mainly affected the phosphate ester bond, as well as the hydroxyl groups.
The FTIR spectrum of carboxyl group modified yeast showed that amide I and amide II red-shifted by 8 cm−1 and 10 cm−1, respectively. The amide III band disappeared. The νC–O and δνC![[double bond, length as m-dash]](https://www.rsc.org/images/entities/char_e001.gif) O of –COOH blue-shifted by 4 cm−1. These results indicated that the carboxyl group modification mainly shielded the –C
O of –COOH blue-shifted by 4 cm−1. These results indicated that the carboxyl group modification mainly shielded the –C![[double bond, length as m-dash]](https://www.rsc.org/images/entities/char_e001.gif) O groups of the amide groups, in addition to the –NH and –C–N groups connected to other carboxyl groups.
O groups of the amide groups, in addition to the –NH and –C–N groups connected to other carboxyl groups.
A similar variety was observed in the amino group modified yeast cells. The amide I, amide II, and amide III bands red-shifted by 6 cm−1, 8 cm−1, and 6 cm−1, respectively. The νC–O and δνC![[double bond, length as m-dash]](https://www.rsc.org/images/entities/char_e001.gif) O of –COOH red-shifted by 18 cm−1. These results suggested that the amino group modification mainly shielded the amino groups of the amide groups and other amino groups.
O of –COOH red-shifted by 18 cm−1. These results suggested that the amino group modification mainly shielded the amino groups of the amide groups and other amino groups.
The above results showed that these three chemical modifications affected the carbonyl group, amide group, amino group, phosphate ester bond, and hydroxyl group. This may be due to the high concentration of protein in dried yeast cells.34
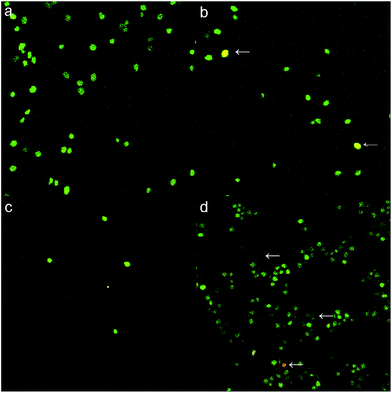
In order to investigate the cell viability before and after chemical modification, live/dead cell fluorophores SYT09 and PI dual staining and MTT assay were utilized. Under exciting of 488 nm laser, green fluorescence produced by binding of SYT09 and cell DNA molecules indicated the live cells, red fluorescence produced by binding of PI and cell DNA molecules indicated the dead cells or cell membrane breakdown. Fig. 2a showed that the control yeast cell presented good viability. Fig. 2b and d showed that the chemical modification decreased the cell's viability, the dead cells or cell membrane breakdown cells could be found. The carboxyl group modified yeast cells did not react well with fluorophores due to hydrophobicity, so, the effect of chemical modification was not remarkable (Fig. 2c). The MTT results showed that the cell's viability was 52.7%, 12.6% and 45.1% of that to control yeast cells for ester group, carboxyl group and amino group modified yeast cells, respectively. In combination with the results of SEM (in Section 3.6), chemical modification of functional groups would decrease the cell's viability, but did not greatly change the structure of yeast cells. So, chemical modification is a valid method to investigate the contribution of functional groups for biosorption.
3.2 The effects of chemically modified S. cerevisiae on biosorption of strontium ions and site density changes of functional groups
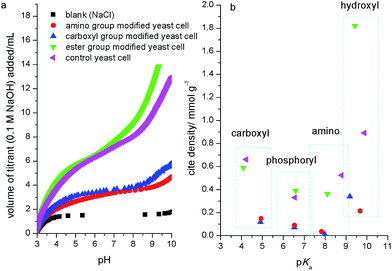
To analyze the contribution of different functional groups to biosorption of strontium ions, the biosorption ratio (R) was calculated. The results (Fig. 1b) showed that the control group yeast cells had an R of 80%, while the R for ester group, carboxyl group and amino group modified yeast cells decreased about 10%, 60% and 70%, respectively. This indicated that the amino group and carboxyl group were the main functional groups for biosorption. In order to investigate the site density changes of functional groups, the acidity constant and site density for yeast cell surface functional groups before and after chemical modification were measured with potentiometric titration.Potentiometric titration curves (Fig. 3a) showed that the consuming amount of titrant NaOH decreased greatly for yeast cells after carboxyl and amino groups modified, which indicated the decrease of surface reactive functional groups. When functional groups were modified, the site density for different functional groups also changed (Fig. 3b). The site density of ester group modified yeast cell was similar to that for control yeast cell, but the hydroxyl group increased greatly due to hydrophobic decrease by acetone extraction. While the carboxyl and amino group modified yeast cells shielded most surface reactive functional groups compared to control yeast cell. Furthermore, the chemical modification caused the functional group's pKa (acidity constant) shift. This was similar to the results for chemical modification of demulsifying bacteria,35 but contrary to some pretreated biomass. Zhang et al. (2010) showed that the site density of carboxyl and amine groups on the ethanol and caustic-pretreated biomass was higher than pristine biomass due to the more exposed functional groups by ethanol corroding or sodium hydroxide catalysis.27 Cho et al. (2011) observed similar changes for live and dried cells of Rhodotorula glutinis.36
So, above results suggested that the contribution of yeast cell surface functional groups to biosorption of strontium ions was greatest for the amino group, followed by the carboxyl group and, lastly, the ester group. This result was similar to previous reports.28,37
3.3 Zeta potential (ζ) value changes for different S. cerevisiae cells before and after biosorption of strontium ions
Markiewicz et al. (2013) thought that adsorption rely on not only electrostatic attraction but also hydrophobicity of adsorbents, which can be characterized with zeta potential (ζ) values.38 The results in Fig. 4 showed that the control yeast cells (unmodified) were charged with a large amount of negative charge in this research conditions. Zeta potential values increased for ester group and carboxyl group modified yeast cells, which suggested that the surface negative charge decreased after modification. But the zeta potential value of amino group modified yeast cells changed to positive (about +11 mV). These variations were consistent with the changes of biosorption ratio. That is to say, the positively charged amino group modified yeast cells was difficult to adsorb cation (Sr2+), the biosorption ratio decreased most greatly (about 70%, Fig. 1b) compared to that of control group yeast cells. The zeta potential values increased after biosorption of strontium ions for control, ester group and carboxyl group modified yeast cells. This indicated that there existed electrostatic interaction during the biosorption process, which was similar to the results for biosorption of Cu2+, Sr2+ and Ni2+.27,32,39 When shielding amino group, the surface of yeast cells was lack of enough negative charge, so, there should exist no electrostatic interaction.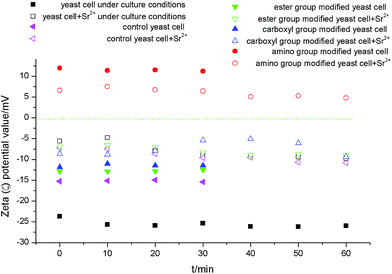 | ||
| Fig. 4 Zeta potential (ζ) value changes for different S. cerevisiae cells before and after biosorption of strontium ions. Note: measurement conditions: c0(Sr) = 100.0 mg L−1; temperature: 25 ± 1 °C. | ||
So, the changes of zeta potential indicated that electrostatic interaction was the initial role for yeast cell to adsorb strontium ions.
3.4 The interaction between strontium ions and the functional groups of chemically modified S. cerevisiae
To analyze the role of different functional groups during biosorption, FTIR was carried out for control and modified yeast cells before and after biosorption of strontium ions.For the control group (Fig. 5a), the hydroxyl and amino groups red-shifted by 25 cm−1 after biosorption of strontium ions. Amide II and amide III bands red-shifted by 8 cm−1 and 3 cm−1, respectively. These results indicated that the amino, carboxyl, and hydroxyl groups are the main biosorption functional groups. Strontium ions break the hydrogen bond of the –OH and –NH2 groups. Then, the O or N provide the lone pair of electrons to the unoccupied orbital of strontium ion to form –O–Sr, –N–Sr, or –CO–Sr binding states. The FTIR results were similar for biosorption times of 20 and 40 min in yeast cell samples. At 90 min, the hydroxyl group blue-shifted by 8 cm−1. The amide I band red-shifted by 8 cm−1. This indicated that the carbonyl group gradually substituted the hydroxyl group during the biosorption process.25 This suggested that the electrostatic interactions were converted into covalent bonds. In addition, the peaks at 2853 cm−1, 1455 cm−1, and 1079 cm−1 disappeared. This indicated that the phosphate ester group may bind strontium ions.
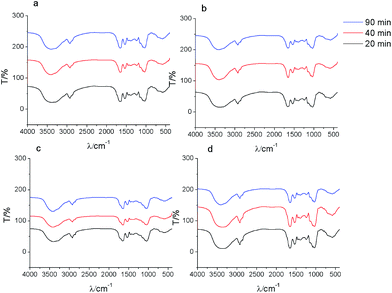 | ||
| Fig. 5 FTIR spectra of control (a) and ester group (b), carboxyl group (c), amino group (d) chemically modified S. cerevisiae cells after biosorption of strontium ions. | ||
For the ester group modification (Fig. 5b), the hydroxyl and amino groups red-shifted by 8 cm−1 after biosorption. The amide I band blue-shifted by 11 cm−1. These results suggested that the amino, carboxyl, and hydroxyl groups were the main biosorption functional groups on the surface of yeast cells after ester group was modified.
For the carboxyl group modification (Fig. 5c), the amide I and amide III bands shifted by 10 cm−1 and 35 cm−1, respectively. The νC–O and δνC![[double bond, length as m-dash]](https://www.rsc.org/images/entities/char_e001.gif) O of –COOH shifted by 23 cm−1. These results indicated that the coordination of –C
O of –COOH shifted by 23 cm−1. These results indicated that the coordination of –C![[double bond, length as m-dash]](https://www.rsc.org/images/entities/char_e001.gif) O or –NH with strontium ions was the primary type of binding during biosorption. The hydroxyl and amino groups blue-shifted by 10.4 cm−1 at 90 min. These results illustrated that O–Sr and N–Sr bonds formed.
O or –NH with strontium ions was the primary type of binding during biosorption. The hydroxyl and amino groups blue-shifted by 10.4 cm−1 at 90 min. These results illustrated that O–Sr and N–Sr bonds formed.
For the amino group modification (Fig. 5d), the results showed that the hydroxyl group blue-shifted by 18.8 cm−1. The amide I band blue-shifted by 8 cm−1. The νC–O and δνC![[double bond, length as m-dash]](https://www.rsc.org/images/entities/char_e001.gif) O of –COOH red-shifted by 10 cm−1. These results indicated that the O of –C
O of –COOH red-shifted by 10 cm−1. These results indicated that the O of –C![[double bond, length as m-dash]](https://www.rsc.org/images/entities/char_e001.gif) O or –OH constituted the primary binding site during strontium biosorption for amino group-modified yeast cells.
O or –OH constituted the primary binding site during strontium biosorption for amino group-modified yeast cells.
Based on the above results, the coordinated complexation form for interface interactions between strontium ions and functional groups during biosorption could be described as follows:
Specifically, the strontium ions may coordinate with the O of –C![[double bond, length as m-dash]](https://www.rsc.org/images/entities/char_e001.gif) O or –OH and the N of –NH, –C–N, or –NH2 in various molecules, such as proteins, chitins, and polysaccharides.
O or –OH and the N of –NH, –C–N, or –NH2 in various molecules, such as proteins, chitins, and polysaccharides.
3.5 The interactions between strontium ions and the functional groups of S. cerevisiae under culture conditions
After biosorption of strontium ions, the FTIR for low initial strontium ion concentration group (c0 = 10 mg L−1) did not show a significant difference compared to the control groups (Fig. 6). Under relative high initial strontium ion concentration conditions, the hydroxyl group red-shifted. For example, the hydroxyl group red shifted by 13 cm−1 for c0(Sr) 100.0 mg L−1 when t = 12 h. These results indicated that the O of –OH coordinated with strontium ions to form an O–Sr bond, which increased the bond distance of the hydroxyl group and led to the observed red-shift. The amide I red-shift was especially obvious for samples containing relative high initial concentrations of strontium ions. For example, the amide I band red shifted by 32 cm−1 for c0(Sr) 50.0 mg L−1 when t = 2 h. This indicated that the formation of –C–CO–O–Sr–CO–C–, which would likely weaken the vibration of the –C![[double bond, length as m-dash]](https://www.rsc.org/images/entities/char_e001.gif) O bond. The amide II band also red-shifted and disappeared under relative high initial concentration strontium ion conditions. This indicated that the N of the amide group participated in binding strontium ions. The νC–O and δνC
O bond. The amide II band also red-shifted and disappeared under relative high initial concentration strontium ion conditions. This indicated that the N of the amide group participated in binding strontium ions. The νC–O and δνC![[double bond, length as m-dash]](https://www.rsc.org/images/entities/char_e001.gif) O of –COOH shifted from 1402 cm−1 to 1384 cm−1. This shift may be due to the formation of O–Sr by carboxyl anion binding with strontium ions. The νasPO2− peak blue-shifted by 8.5 cm−1 at low concentration of strontium ions and disappeared at high concentration of strontium ions after biosorption.
O of –COOH shifted from 1402 cm−1 to 1384 cm−1. This shift may be due to the formation of O–Sr by carboxyl anion binding with strontium ions. The νasPO2− peak blue-shifted by 8.5 cm−1 at low concentration of strontium ions and disappeared at high concentration of strontium ions after biosorption.
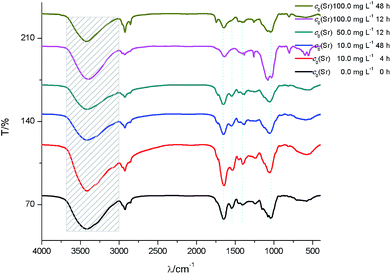 | ||
| Fig. 6 FTIR spectra of S. cerevisiae cells before and after biosorption of strontium ions under culture conditions. | ||
The results of FTIR under these culture conditions also suggested the formation of an interface interaction involving coordinated complexation between strontium ions and yeast cells during biosorption, as described above.
3.6 Mesoscopic analysis of the interface interaction for strontium ion biosorption by S. cerevisiae under culture conditions
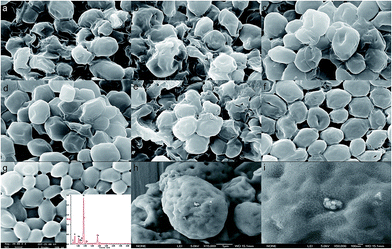
Compared to control cells (Fig. 7a), SEM results (Fig. 7b–d) showed that the chemically modified yeast cell surface did not display obvious changes. This is in contrast to the morphology of other chemically pretreated or modified cells. For example, caustic pretreatment typically makes cells corrugated and rough, and the cell volume often decreases.27SEM (Fig. 7e–g) also showed that the strontium ions did not cause obvious cell damage to S. cerevisiae under culture conditions. This is in contrast to the toxic effects of other heavy metal ions on cells.16,40 There was almost no difference in the morphology between the control group and the strontium ion biosorption groups, but few particles could be observed on the cell surface. The nanoscale results showed that the strontium ions formed some type of precipitate on local surface, but this was not in significant amounts when c0(Sr) ≤ 100 mg L−1 (Fig. 7h and i). The EDS (Fig. 7g) showed that strontium ions were biosorbed on the cell surface.
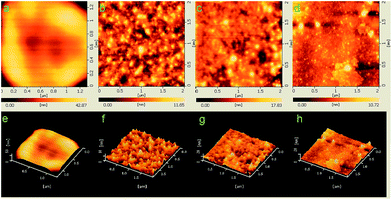
The characteristics of the yeast cell surface before and after biosorption were investigated at high resolution by AFM analysis. The yeast cell surface in the control group was smooth, and no large folds or particles were observed (Fig. 8a and e). The yeast cell surface displayed significant changes after biosorption of strontium ions (Fig. 8b–d and f–h). Many nanoparticle-like structures appeared on the cell surface. The particle sizes correlated with the initial concentrations of strontium ions, which is similar to the results of other studies.12,16,18,20,41 The average particle size was 2731 nm2, the average particle diameter was 58.96 nm, and the average particle number was 182 for c0(Sr) = 50 mg L−1 group. Meanwhile, for the c0(Sr) = 100 mg L−1 group, the values were 4487 nm2, 75.59 nm, and 77, respectively. The number of particles decreased, but the diameter of the particles increased when culture time increased (Fig. 8d and h). This result further displayed that the strontium ions interacted with surface of yeast cells under culture conditions.
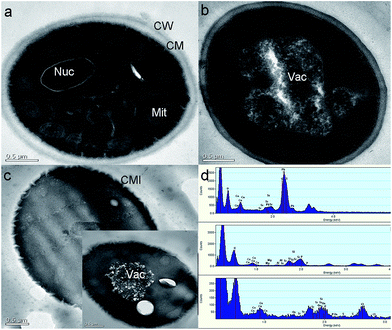
TEM of control group (Fig. 9a) showed that yeast cells had a completely spherical morphology. The mitochondria in the cytoplasm were uniformly arranged around the cell membrane. There was a large vacuole near the nucleus with low electron density. Some tubular structures were observed, which may be formed through the folding of the inner membrane (Fig. 9b).42 The cell structures after biosorption were similar to the control group's (Fig. 9c). However, the cell wall and membrane structure changed substantially (Fig. 9d). The cell wall and membrane displayed distinct jagged folds. We speculate that the structure and permeability of the cell wall and membrane are changed after biosorption of strontium ions.20,43,44 The shrinkage of the cytoplasm is also thought to be an adaptive response to heavy metal ion stress.43,44 At the same time, cell vacuole inclusions appeared to have a crystal-like structure of high electron density after biosorption of strontium ions (Fig. 9e). The EDS results (Fig. 9f) showed that the strontium content in the control group cells was at trace levels. The EDS of the cell wall and membrane for the 100 mg L−1 group showed that these structures contained some strontium, but high levels of strontium could not be detected in the crystal-like structures of the cytoplasmic vacuoles. This might be because the amount of strontium ions bioaccumulated in cytoplasm is very low.4
Cumulatively, the TEM results suggested that strontium ions may be first adsorbed on cell wall and membrane, and then transported into the cytoplasm where they are stored in cytoplasmic vacuoles.
3.7 Transmembrane transport and bioaccumulation of strontium ions by S. cerevisiae under culture conditions
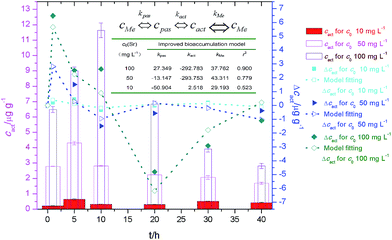
We have proposed the following mathematical kinetics model for the transmembrane transport and bioaccumulation under culture conditions,6
 | (2) |
We have quantified the adsorption and bioaccumulation of strontium ions by yeast cells at different preset times under culture conditions.4 The fitting curve and the parameters (Fig. 10) indicated that transmembrane transport and bioaccumulation varied according to strontium ion concentrations. When strontium ion concentration was very low (c0 = 10 mg L−1), the negative kpas factor and positive kact/kMe factors facilitated an increase in strontium ion transport into the cytoplasm. When strontium ion concentration was relative high (c0 = 100 mg L−1), the concentration of strontium ion on cell walls (cpas) was a positive factor (kpas > 0) to facilitate the strontium ions transport into the cytoplasm, but the concentration of strontium ion in cytoplasm (cact) was a negative factor (kact < 0) to inhibit the strontium ions entrance.
4. Discussion: interface interaction for biosorption of strontium ions by S. cerevisiae under culture conditions
To study the interface interactions between strontium ions and yeast cells, the contribution of functional groups, the bonding mode, and the transmembrane bioaccumulation required for biosorption were investigated. The results showed that binding to functional groups on yeast cells and transmembrane transport were the major interface interactions required for biosorption of low concentration strontium ions.The cell surface was the major interface for biosorption and surface functional groups contributed substantially to biosorption. Many studies have shown that the cell surface are the main sites for biosorption of metal ions.4,6,45,46 The quantity of strontium ions adsorbed on the cell wall was greater than 90% for Scenedesmus spinosus6 and S. cerevisiae.4 Latha et al. (2005) showed that Neurospora crassa adsorbed more than 90% of the cobalt ions on the cell wall, and this amount decreased for mutant N. crassa strains.46 Some reports have revealed that pretreated biomass has higher biosorption efficiency due to the exposure of more functional groups on the biomass surface.27 Pretreatment of baker's yeast with ethanol and caustic soda produced a higher biosorption efficiency for Cu2+ than untreated baker's yeast.27 However, some modification can decrease biosorption efficiency. For example, the biosorption of Pb2+, Cd2+, and Cu2+ by A. niger significantly decreased after esterification of carboxyl groups or methylation of amino groups.10 In this study, the biosorption ratio decreased by about 10%, 60% and 70% for ester, carboxyl, and amino groups modified yeast cells, respectively. This supports previous reports that the amino and carboxyl groups are the main functional binding groups for biosorption.25,41
Coordination between metal ions and surface functional groups were the common forms for interface interactions during biosorption. Cu2+ may be coordinated by the N in the –NH group and by the O of the –OH group in chitosan-cellulose beads23 and adsorbed on the yeast cell wall by –CONH–/–COO− groups through coordination.27 Hg2+ may bind to negatively charged functional groups in gum karaya to form analogous complexation or coordination as a mononuclear four-coordinate model.8 Sr2+ may coordinate with the N atom of amide in N-acetyl glucosamine of magnetic chitosan beads as a mononuclear six-coordinate model.2 The coordination of La3+ with O atom of uronic acid residues may involve two uronic acid anions, each of which bind La3+ through the C(6) and C(6′) carboxyl oxygen atoms and two C(5) ring oxygen atoms as a four-coordination model.47
In this research, the 1725.4 cm−1 peak (–C![[double bond, length as m-dash]](https://www.rsc.org/images/entities/char_e001.gif) O) disappeared after biosorption of strontium ions, which suggested that the O atom may participate in the coordination with strontium ions.24 Furthermore, if the strontium ion concentration was higher and the biosorption time was longer, the N atom likely participates in the coordination with strontium ions.
O) disappeared after biosorption of strontium ions, which suggested that the O atom may participate in the coordination with strontium ions.24 Furthermore, if the strontium ion concentration was higher and the biosorption time was longer, the N atom likely participates in the coordination with strontium ions.
Some metal ions may be transported into the cytoplasm. Gola et al. (2016) showed that visible dark spots were observed in the cytoplasm in the presence of heavy metal ions.16 Purchase et al. (2009) found electron-dense areas localized at the cell wall, cytoplasm, and in the culture medium of B. bassiana when these cells were grown in the presence of Pb2+.48 The bioaccumulation models6,20 also suggested that the energy-dependent efflux system controlled heavy metal ion homeostasis, which can act as a detoxifying mechanism.49,50
Based on above results and other literatures, we propose an interface interaction process (Fig. 11) for biosorption of low concentration strontium ions by S. cerevisiae under culture conditions.20,33,34,41,51–53 Strontium ions are first adsorbed on the cell surface (Fig. 11), and then some strontium ions are transported into the cytoplasm and stored in vacuoles. The yeast cells transport some strontium ions out of the cytoplasm when intracellular strontium ion concentration is high. Electrostatic interaction was the initial role for yeast cell to adsorb strontium ions. Coordination between strontium ions and yeast cell surface functional groups was a common form for interface interaction during biosorption. The S. cerevisiae cell wall is mainly composed of mannoprotein (constituting 40% of the cell wall mass, the same below), β-1,3-glucan (50%), β-1,6-glucan (10%), and chitin (1–3%).34 Strontium ions can be coordinated by the N atom in the –NH– group in mannoprotein or chitin. It can also be partly coordinated by certain membrane proteins and the O atom in the –OH and –C![[double bond, length as m-dash]](https://www.rsc.org/images/entities/char_e001.gif) O groups of glucan, mannoprotein, and chintin as a mononuclear six- (or four-) coordinate model. The other coordination atoms included the O atom of the C
O groups of glucan, mannoprotein, and chintin as a mononuclear six- (or four-) coordinate model. The other coordination atoms included the O atom of the C![[double bond, length as m-dash]](https://www.rsc.org/images/entities/char_e001.gif) O group in asparagine, the N atom of the –NH– group, and the O atom of the –C
O group in asparagine, the N atom of the –NH– group, and the O atom of the –C![[double bond, length as m-dash]](https://www.rsc.org/images/entities/char_e001.gif) O group in N-acetylglucosamine unit. Besides these, the carboxyl groups of some acidic amino acid residues can form carboxylate with strontium ions.20,33,34,41,51–53
O group in N-acetylglucosamine unit. Besides these, the carboxyl groups of some acidic amino acid residues can form carboxylate with strontium ions.20,33,34,41,51–53
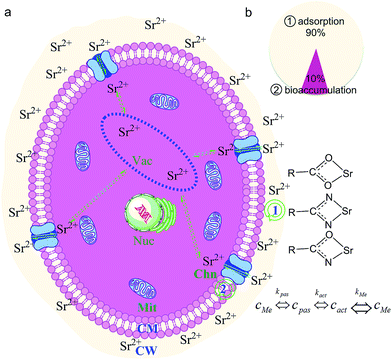 | ||
| Fig. 11 Interface interaction processes for S. cerevisiae cell biosorption of strontium ion under culture conditions.20,33,34,41,51–53 Note: (a) interface interaction for yeast cell biosorption of strontium ion under culture conditions, including ① adsorption; ② bioaccumulation; (b) distribution of strontium ions on yeast cell surface and in cytoplasm; Nuc: nucleus, Vac: vacuole, Mit: mitochondria, Chn: channel protein, CM: cell membrane, CW: cell wall. | ||
5. Conclusions
Five principle conclusions were reached in this study. First, the –NH2, –COOH, and –OH groups, as well as the –PO2− group, were the main functional groups on the yeast cell surface mediating biosorption, and the extent of contribution could be ordered as follows: –NH/–OH > –COO− > –COOC–. Second, strontium ions may coordinate with the O of –C![[double bond, length as m-dash]](https://www.rsc.org/images/entities/char_e001.gif) O or –OH and the N of –NH, –C–N, or –NH2 from protein and chitin. Third, the mesoscopic analysis and bioaccumulation model indicated that strontium ions may be transported into the cytoplasm, in addition to participating in adsorption. Fourth, the interface interaction mechanism for biosorption suggests that low concentration strontium ions may be adsorbed on the cell surface as a result of electrostatic interaction, coordination or bioaccumulate in the cytoplasm under culture conditions. Fifth, the optimal biosorption microorganism should be enriched for proteins and polysaccharides on the cell surface.
O or –OH and the N of –NH, –C–N, or –NH2 from protein and chitin. Third, the mesoscopic analysis and bioaccumulation model indicated that strontium ions may be transported into the cytoplasm, in addition to participating in adsorption. Fourth, the interface interaction mechanism for biosorption suggests that low concentration strontium ions may be adsorbed on the cell surface as a result of electrostatic interaction, coordination or bioaccumulate in the cytoplasm under culture conditions. Fifth, the optimal biosorption microorganism should be enriched for proteins and polysaccharides on the cell surface.
Conflicts of interest
There are no conflicts to declare.Acknowledgements
The authors thank the National Basic Research Program of China (973 Program: 2014CB846003), National Key Research and Development Plan of China (2016YFC0502204) and the National Nature Science Foundation of China (Grant number: 41272371, 41502316, 41672039).Notes and references
- S. Avery and J. Tobin, Appl. Environ. Microbiol., 1992, 58, 3883–3889 CAS.
- C. Chen and J. Wang, J. Hazard. Mater., 2008, 151, 65–70 CrossRef CAS PubMed.
- J. Marešová, M. Pipíška, M. Rozložník, M. Horník, L. Remenárová and J. Augustín, Desalination, 2011, 266, 134–141 CrossRef.
- M. Liu, F. Dong, W. Zhang, X. Nie, S. Sun, H. Wei, L. Luo, S. Xiang and G. Zhang, J. Hazard. Mater., 2016, 314, 295–303 CrossRef CAS PubMed.
- M. R. Krejci, B. Wasserman, L. Finney, I. McNulty, D. Legnini, S. Vogt and D. Joester, J. Struct. Biol., 2011, 176, 192–202 CrossRef CAS PubMed.
- M. Liu, F. Dong, W. Kang, S. Sun, H. Wei, W. Zhang, X. Nie, Y. Guo, T. Huang and Y. Liu, Int. J. Environ. Res. Public Health, 2014, 11, 6099–6118 CrossRef CAS PubMed.
- S. B. Choi and Y. S. Yun, J. Hazard. Mater., 2006, 138, 378–383 CrossRef CAS PubMed.
- V. T. P. Vinod, R. B. Sashidhar, N. Sivaprasad, V. U. M. Sarma, N. Satyanarayana, R. Kumaresan, T. N. Rao and P. Raviprasad, Desalination, 2011, 272, 270–277 CrossRef CAS.
- R. H. Crist, J. R. Martin, P. W. Guptill, J. M. Eslinger and D. R. Crist, Environ. Sci. Technol., 1990, 24, 337–342 CrossRef CAS.
- A. Kapoor and T. Viraraghavan, Bioresour. Technol., 1997, 61, 221–227 CrossRef CAS.
- T. A. Davis, B. Volesky and A. Mucci, Water Res., 2003, 37, 4311–4330 CrossRef CAS PubMed.
- S. K. Kazy, S. F. D'Souza and P. Sar, J. Hazard. Mater., 2009, 163, 65–72 CrossRef CAS PubMed.
- J. P. S. Cabral, Microbios, 1992, 71, 47–53 CAS.
- G. Sarret, A. Manceau, L. Spadini, J. C. Roux, J. L. Hazemann, Y. Soldo, L. Eybert-Bérard and J. J. Menthonnex, Environ. Sci. Technol., 1998, 32, 1648–1655 CrossRef CAS.
- K. Chojnacka and P. M. Wojciechowski, Am. J. Agric. Biol. Sci., 2007, 2, 291–298 CrossRef.
- D. Gola, P. Dey, A. Bhattacharya, A. Mishra, A. Malik, M. Namburath and S. Z. Ahammad, Bioresour. Technol., 2016, 218, 388–396 CrossRef CAS PubMed.
- X. Lu, X. J. Zhou and T. S. Wang, J. Hazard. Mater., 2013, 262, 297–303 CrossRef CAS PubMed.
- B. Li, D. Pan, J. Zheng, Y. Cheng, X. Ma, F. Huang and Z. Lin, Langmuir, 2008, 24, 9630–9635 CrossRef CAS PubMed.
- S. K. Das, M. Mukherjee and A. K. Guha, Langmuir, 2008, 24, 8643–8650 CrossRef CAS PubMed.
- F. Huang, C. L. Guo, G. N. Lu, X. Y. Yi, L. D. Zhu and Z. Dang, Chemosphere, 2014, 109, 134–142 CrossRef CAS PubMed.
- M. M. Figueira, B. Volesky and H. J. Mathieu, Environ. Sci. Technol., 1999, 33, 1840–1846 CrossRef CAS.
- P. X. Sheng, Y. P. Ting, J. P. Chen and L. J. Hong, J. Colloid Interface Sci., 2004, 275, 131–141 CrossRef CAS PubMed.
- N. Li and R. Bai, Sep. Purif. Technol., 2005, 42, 237–247 CrossRef CAS.
- R. C. Oliveira, P. Hammer, E. Guibal, J. M. Taulemesse and O. Garcia, Chem. Eng. J., 2014, 239, 381–391 CrossRef CAS.
- R. S. Bai and T. E. Abraham, Water Res., 2002, 36, 1224–1236 CrossRef CAS PubMed.
- M. Mukhopadhyay, S. B. Noronha and G. K. Suraishkumar, Bioresour. Technol., 2007, 98, 1781–1787 CrossRef CAS PubMed.
- Y. Zhang, W. Liu, M. Xu, F. Zheng and M. Zhao, J. Hazard. Mater., 2010, 178, 1085–1093 CrossRef CAS PubMed.
- D. H. Sun, Q. B. Li, X. P. Ling, L. Wang and M. X. Fu, Acta Sci. Circumstantiae, 2006, 26, 1107–1110 CAS.
- B. F. Turner and J. B. Fein, Comput. Geosci., 2006, 32, 1344–1356 CrossRef CAS.
- P. Stiefel, S. Schmidt-Emrich, K. Maniura-Weber and Q. Ren, BMC Microbiol., 2015, 15 DOI:10.1186/s12866-015-0376-x.
- T. T. Huo, F. Q. Dong, J. J. Deng, Q. B. Zhang, X. C. He and D. P. Sun, J. Environ. Sci., 2016, 37, 4410–4418 Search PubMed.
- W. Hu, F. Dong, G. Yang, X. Peng, X. Huang, M. Liu and J. Zhang, Environ. Sci. Pollut. Res. Int., 2017 DOI:10.1007/s11356-017-9891-7.
- F. Wang, Z. Yang, Y. Zhou, S. Weng, L. Zhang and J. Wu, J. Mol. Struct., 2006, 794, 1–11 CrossRef CAS.
- P. N. Lipke and R. Ovalle, J. Bacteriol., 1998, 180, 3735–3740 CAS.
- K. Wang, Influence of surface proteins and functional groups on surface properties of demulsifying bacteria, Master Dissertation, Tongji University, Shanghai, 2014.
- D. H. Cho, K. H. Chu and E. Y. Kim, World J. Microbiol. Biotechnol., 2011, 27, 1911–1917 CrossRef CAS.
- A. B. Pérez Marín, J. F. Ortuňo, M. I. Aguilar, V. F. Meseguer, J. Sáez and M. Lioréns, Biochem. Eng. J., 2010, 53, 2–6 CrossRef.
- M. Markiewicz, W. Mrozik, K. Rezwan, J. Thöming, J. Hupka and C. Jungnickel, Chemosphere, 2013, 90, 706–712 CrossRef CAS PubMed.
- H. Xu, Y. Liu and J. H. Tay, Bioresour. Technol., 2006, 97, 359–363 CrossRef CAS PubMed.
- A. Mishra and A. Malik, Water Res., 2012, 46, 4991–4998 CrossRef CAS PubMed.
- X. Pan, Z. Chen, Y. Cheng, D. Pan, S. Yin, F. Huang, X. Guan and Z. Lin, J. Nanosci. Nanotechnol., 2011, 11, 3597–35603 CrossRef CAS PubMed.
- M. Osumi, Micron, 1998, 29, 207–233 CrossRef CAS PubMed.
- R. Chakravarty, S. Manna, A. K. Ghosh and P. C. Banerjee, Res. J. Microbiol., 2007, 2, 742–748 CrossRef CAS.
- C. Nithya, B. Gnanalakshmi and S. K. Pandian, Mar. Environ. Res., 2011, 71, 283–294 CrossRef CAS PubMed.
- A. C. Texier, Y. Andrès, M. Illemassene and P. Le Cloirec, Environ. Sci. Technol., 2000, 34, 610–615 CrossRef CAS.
- J. N. L. Latha, K. Rashmi and P. M. Mohan, Can. J. Microbiol., 2005, 51, 1021–1026 CrossRef CAS PubMed.
- L. Fuks, D. Filipiuk and W. Lewandowski, J. Mol. Struct., 2001, 563–564, 587–593 CrossRef CAS.
- D. Purchase, L. N. L. Scholes, D. M. Revitt and R. B. E. Shutes, J. Appl. Microbiol., 2009, 106, 1163–1174 CrossRef CAS PubMed.
- D. H. Nies, FEMS Microbiol. Rev., 2003, 27, 313–339 CrossRef CAS PubMed.
- S. Silver and L. T. Phung, J. Ind. Microbiol. Biotechnol., 2005, 32, 587–605 CrossRef CAS PubMed.
- E. J. O'Neil and B. D. Smith, Coord. Chem. Rev., 2006, 250, 3068–3080 CrossRef.
- M. T. Murakami, A. Gabdoulkhakov, N. Genov, A. C. O. Cintra, C. Betzel and R. K. Arni, Biochimie, 2006, 88, 543–549 CrossRef CAS PubMed.
- M. Picard, A. M. Jensen, T. L. Sørensen, P. Champeil, J. V. Møller and P. Nissen, J. Mol. Biol., 2007, 368, 1–7 CrossRef CAS PubMed.
| This journal is © The Royal Society of Chemistry 2017 |

