 Open Access Article
Creative Commons Attribution 3.0 Unported Licence
Promotional effect of niobium substitution on the low-temperature activity of a WO3/CeZrOx monolithic catalyst for the selective catalytic reduction of NOx with NH3†
Haidi Xua,
Qingjin Linb,
Yun Wangc,
Li Land,
Shuang Liua,
Chenlu Lina,
Qin Wangc,
Jianli Wang*b and
Yaoiqng Chen *ab
*ab
aInstitute of New Energy and Low-Carbon Technology, Sichuan University, Chengdu 610064, PR China. E-mail: nic7501@scu.edu.cn; Fax: +86-28-85418451; Tel: +86-28-85418451
bCollege of Chemistry, Sichuan University, Chengdu 610064, PR China. E-mail: wangjianli@scu.edu.cn; Fax: +86-28-85418451; Tel: +86-28-85418451
cSinocat Environmental Technology Co., Ltd, Chengdu 611731, PR China
dCollege of Pharmacy and Biological Engineering, Chengdu University, Chengdu 610106, PR China
First published on 10th October 2017
Abstract
A series of Nb-substituted WO3/CeZrOx catalysts were prepared by the co-impregnation method and applied in the selective catalytic reduction of NOx with NH3 (NH3-SCR). NH3 oxidation, N2 sorption, XRD, Raman, UV-vis, XPS, H2-TPR, O2/NH3-TPD and in situ DRIFTS were performed to correlate the redox property and surface acidity to NH3-SCR performance of Nb-substituted catalysts. The catalyst with 5 wt% substitution amount of Nb2O5 presented excellent deNOx activity and N2 selectivity in a broad reaction temperature window of 190–434 °C at a gas space velocity of 30![[thin space (1/6-em)]](https://www.rsc.org/images/entities/char_2009.gif) 000 h−1. The characterization results demonstrated that the partial substitution of WO3 by Nb2O5 not only led to strong redox properties arising from abundant surface active oxygen species, but also promoted the adsorption of NH3 and the redistribution of acid sites due to Nb–OH related to Brønsted acid sites and Nb
000 h−1. The characterization results demonstrated that the partial substitution of WO3 by Nb2O5 not only led to strong redox properties arising from abundant surface active oxygen species, but also promoted the adsorption of NH3 and the redistribution of acid sites due to Nb–OH related to Brønsted acid sites and Nb![[double bond, length as m-dash]](https://www.rsc.org/images/entities/char_e001.gif) O bonded to strong Lewis acid sites. The enhancement of surface active oxygen species and Brønsted acid sites promoted the low-temperature (below 250 °C) deNOx activity. However, the preoxidation of NH3 at high temperatures slightly suppressed the NOx conversion of the catalyst with more strong Lewis acid sites at above 400 °C. Moreover, the catalyst also showed excellent sulfur tolerance and could be a promising candidate for practical applications in NOx abatement.
O bonded to strong Lewis acid sites. The enhancement of surface active oxygen species and Brønsted acid sites promoted the low-temperature (below 250 °C) deNOx activity. However, the preoxidation of NH3 at high temperatures slightly suppressed the NOx conversion of the catalyst with more strong Lewis acid sites at above 400 °C. Moreover, the catalyst also showed excellent sulfur tolerance and could be a promising candidate for practical applications in NOx abatement.
1 Introduction
It is well known that nitrogen oxides (NOx, including NO and NO2) derived from stationary resources like the coal fired power plants and mobile resources like the diesel engine, as one of the main air pollutants, would lead to several severe environmental problems, such as haze, acid rain, greenhouse effect, ozone depletion and photochemical smog.1,2 The emission regulations of many countries and regions are becoming more and more stringent, especially in the United States, Europe, Japan and China, in order to cope with serious pollution impacts of NOx.3,4 Currently, among the proposed or developed various techniques for NOx abatement, the selective catalytic reduction of NOx with NH3 (NH3-SCR) as a reductant is the most effective technology to remove NOx and has been widely used in the oxygen-rich exhausts.2,3 Until now, V2O5/WO3 (MoO3)/TiO2 serial catalyst is still the most typical commercial and well-studied metal oxides catalyst, even though it still has some drawbacks to solve, such as narrow operation temperature range, low N2 selectivity, low thermal stability due to the phase transformation of TiO2 from anatase to rutile at the high temperature range and the volatility and toxicity of vanadium oxide species.5,6 As a result, it is necessary to develop novel environmental friendly metal oxide NH3-SCR catalyst which possesses excellent low-temperature deNOx activity, high N2 selectivity and strong thermal stability in a broad operation temperature window, to be a promising candidate to substitute the conventional V-based catalysts.In recent, increasing interests have been focused on the cerium-based NH3-SCR catalysts and ceria zirconia mixed oxides could be one of the most promising supports for NOx abatement, considering its acid–base property, redox property and thermal stability.7,8 Among them, WO3/CeO2–ZrO2 serial catalysts have received increasing attentions since reported by Li et al.9 It was reported that NOx could be completely converted over WO3/CeO2–ZrO2 in a broad temperature range of 200–500 °C with the condition of NO/NO2 = 1![[thin space (1/6-em)]](https://www.rsc.org/images/entities/char_2009.gif) :
:![[thin space (1/6-em)]](https://www.rsc.org/images/entities/char_2009.gif) 1, the catalyst presented higher thermal stability than conventional V2O5–WO3–TiO2. After that, the promotion of WO3/CeO2–ZrO2 has been investigated to improve its NH3-SCR performance and seek its NH3-SCR reaction mechanism by different methods. For example, Zhang et al.10 used different synthesis methods to modify the morphology of CeO2–ZrO2–WO3 and achieve the optimal NH3-SCR performance; Can et al.11 altered the molar ratio of Ce/Zr and investigated its impact on a NOx storage reduction–selective reduction coupled process; Väliheikki et al.12 studied the impact of SO2 and hydrothermal aging on the NH3-SCR activity of W–CeZr catalyst. Our group has investigated the influences of molar ratios of Ce/Zr and W/Fe on the NH3-SCR performance of FeW/CexZr1−xO2, respectively, and found that FeW1.03/Ce0.68Zr0.32O2 (Ce/Zr = 68/32 and W/Fe = 1.03) could achieve the highest NOx conversion (higher than 95% NOx conversion in the range of 250–435 °C) under our test conditions.13,14 And then, the effects of the calcination temperature of CZ on the structure and NH3-SCR performance of WO3/Ce0.68Zr0.32O2 (denoted as W/CZ) were investigated and the catalyst calcined at 500–600 °C with higher thermal stability was obtained.15 In order to improve the sulfur tolerance of W/CZ, different loadings of TiO2 were introduced into CZ by a co-precipitation method and used to prepare WO3/CeZrTixO2 (W/CZTx) for NH3-SCR, respectively.16 It was found that the addition of TiO2 not only improved the sulfur tolerance but also enhanced the NOx conversion of W/CZ, the operation temperature window (the temperature range in which higher than 90% NOx conversion was achieved) of W/CZT20 with 20 wt% TiO2 was widened to 200–470 °C from 224–444 °C of W/CZ.
1, the catalyst presented higher thermal stability than conventional V2O5–WO3–TiO2. After that, the promotion of WO3/CeO2–ZrO2 has been investigated to improve its NH3-SCR performance and seek its NH3-SCR reaction mechanism by different methods. For example, Zhang et al.10 used different synthesis methods to modify the morphology of CeO2–ZrO2–WO3 and achieve the optimal NH3-SCR performance; Can et al.11 altered the molar ratio of Ce/Zr and investigated its impact on a NOx storage reduction–selective reduction coupled process; Väliheikki et al.12 studied the impact of SO2 and hydrothermal aging on the NH3-SCR activity of W–CeZr catalyst. Our group has investigated the influences of molar ratios of Ce/Zr and W/Fe on the NH3-SCR performance of FeW/CexZr1−xO2, respectively, and found that FeW1.03/Ce0.68Zr0.32O2 (Ce/Zr = 68/32 and W/Fe = 1.03) could achieve the highest NOx conversion (higher than 95% NOx conversion in the range of 250–435 °C) under our test conditions.13,14 And then, the effects of the calcination temperature of CZ on the structure and NH3-SCR performance of WO3/Ce0.68Zr0.32O2 (denoted as W/CZ) were investigated and the catalyst calcined at 500–600 °C with higher thermal stability was obtained.15 In order to improve the sulfur tolerance of W/CZ, different loadings of TiO2 were introduced into CZ by a co-precipitation method and used to prepare WO3/CeZrTixO2 (W/CZTx) for NH3-SCR, respectively.16 It was found that the addition of TiO2 not only improved the sulfur tolerance but also enhanced the NOx conversion of W/CZ, the operation temperature window (the temperature range in which higher than 90% NOx conversion was achieved) of W/CZT20 with 20 wt% TiO2 was widened to 200–470 °C from 224–444 °C of W/CZ.
However, it is inevitable that TiO2 would easily transform from anatase to rutile even though with low loading of TiO2, when the catalyst encountered the regeneration of diesel particulate filters (DPF) equipped in the upstream of NH3-SCR catalyst.17 Therefore, it is imperative to search one component introduced into W/CZ to develop a novel modified W/CZ catalyst without titanium, but the catalyst should keep the strong sulfur tolerance and excellent low-temperature catalytic activity of W/CZT20. Recently, NbOx has attracted much attention as a promoter to improve the NH3-SCR performance due to its unique acid property as well as excellent redox property.18–20 Usually, Nb2O5 was introduced into CeO2-based catalysts, which could not only promote the acidity of catalysts but also modify the redox property by generating oxygen vacancies due to the electronic interaction between Cen+ and Nbn+, to achieve better NH3-SCR performance.19,21,22 Ding et al. and Casapu et al. reported that the Nb2O5 modified CeZrO2 catalyst presented high deNOx activity and N2 selectivity, strong sulfur/water vapor resistance and hydrothermal stability.22,23
Therefore, in this work, a series of Nb-substituted W/CZ catalysts were prepared by co-impregnation method and applied for NOx removal by NH3-SCR reaction. The obtained 5W–5Nb/CZ catalyst with 5 wt% WO3 substituted by Nb2O5 exhibited better NH3-SCR activity than W/CZT20 in the previous work and maintained the sulfur tolerance of the latter. Several characterizations on the structure, redox property and surface acidity of Nb-substituted W/CZ catalysts were employed to illustrate the effects of Nb substitution on the catalytic performance of catalysts.
2 Experimental
2.1 Catalysts preparation
The carrier material CeZrO2 mixed oxides (denoted as CZ) were prepared by the conventional co-precipitation method followed as our previous work.15 Different amounts of Nb2O5 substituted WO3/CeZrO2 (labeled as W/CZ) catalysts were prepared by co-impregnating the asprepared CZ powders calcined at 600 °C for 3 h with ammonium metatungstate hydrate ((NH4)6H2W12O40, AR grade, 99.9%, Anda, China) and nibium(V) oxalate hydrate (C10H5NbO20, AR grade, 99.9%, Alfa Aesar, China) mixed solution. The total loadings of WO3 and Nb2O5 were 10 wt%, the mass ratios of WO3/Nb2O5 were 10![[thin space (1/6-em)]](https://www.rsc.org/images/entities/char_2009.gif) :
:![[thin space (1/6-em)]](https://www.rsc.org/images/entities/char_2009.gif) 0, 7
0, 7![[thin space (1/6-em)]](https://www.rsc.org/images/entities/char_2009.gif) :
:![[thin space (1/6-em)]](https://www.rsc.org/images/entities/char_2009.gif) 3, 5
3, 5![[thin space (1/6-em)]](https://www.rsc.org/images/entities/char_2009.gif) :
:![[thin space (1/6-em)]](https://www.rsc.org/images/entities/char_2009.gif) 5, 3
5, 3![[thin space (1/6-em)]](https://www.rsc.org/images/entities/char_2009.gif) :
:![[thin space (1/6-em)]](https://www.rsc.org/images/entities/char_2009.gif) 7 and 0
7 and 0![[thin space (1/6-em)]](https://www.rsc.org/images/entities/char_2009.gif) :
:![[thin space (1/6-em)]](https://www.rsc.org/images/entities/char_2009.gif) 10, respectively. The impregnated powders were dried at 120 °C overnight, and then calcined at 550 °C for 3 h in air. The resulting five catalyst powders were subsequently coated on honeycomb cordierites (cylinder, radius: 5.5 mm, length: 26 mm, bulk: 2.5 mL, 62 cell per cm−2, Coring, USA), and then dried at 120 °C overnight and calcined at 550 °C for 3 h in air. Finally, Nb-substituted W/CZ monolithic catalysts with coating amount of about 160 g L−1 were obtained and separately denoted as 10W/CZ, 7W–3Nb/CZ, 5W–5Nb/CZ, 3W–7Nb/CZ and 10Nb/CZ.
10, respectively. The impregnated powders were dried at 120 °C overnight, and then calcined at 550 °C for 3 h in air. The resulting five catalyst powders were subsequently coated on honeycomb cordierites (cylinder, radius: 5.5 mm, length: 26 mm, bulk: 2.5 mL, 62 cell per cm−2, Coring, USA), and then dried at 120 °C overnight and calcined at 550 °C for 3 h in air. Finally, Nb-substituted W/CZ monolithic catalysts with coating amount of about 160 g L−1 were obtained and separately denoted as 10W/CZ, 7W–3Nb/CZ, 5W–5Nb/CZ, 3W–7Nb/CZ and 10Nb/CZ.
2.2 Catalytic activity measurements
The NH3-SCR activity measurements of the prepared monolithic catalysts were carried out in a fixed-bed quartz tube flow reactor at atmospheric pressure. The flue gas composition was as follows: 500 ppm NO (when used), 500 ppm NH3 (when used), 5% O2, N2 as balance. The experimental procedures of water steam, sulphur and carbon dioxide were employed to 100 ppm SO2 (when used), 10 vol% water vapour, 10% CO2 and their mixtures into the above reaction gas. The premixed gases (2.0% NO in N2, 2.0% NH3 in N2, 0.1% SO2 in N2, 99.99% CO2 and 99.99% O2) were supplied by Testing Technology Research Institute, China. Reactant gases were regulated by mass-flow controllers before entering the reactor. In typical condition, 2.5 cm3 monolithic catalyst sample was used in each run and the total flow rate was about 1.25 L min−1, yielding the GHSV of 30![[thin space (1/6-em)]](https://www.rsc.org/images/entities/char_2009.gif) 000 h−1 by volume. The separate NH3/NO oxidation activity was tested in the absence of NO/NH3. The concentrations of NH3, NOx and N2O in the inlet and outlet gases were continually analyzed by an FT-IR (Antaris IGS, Nicolet). The data were recorded after 30 min when the reaction reached a steady state for each test.
000 h−1 by volume. The separate NH3/NO oxidation activity was tested in the absence of NO/NH3. The concentrations of NH3, NOx and N2O in the inlet and outlet gases were continually analyzed by an FT-IR (Antaris IGS, Nicolet). The data were recorded after 30 min when the reaction reached a steady state for each test.
The NOx conversions (XNOx) and N2 selectivity (SN2) were calculated as follows:
 | (1) |
 | (2) |
2.3 Characterizations
The textural properties of all catalysts were measured by N2 adsorption–desorption at −196 °C on a Quantachrome automated surface area & pore size analyzer (Autosorb SI). The samples were pretreated at 300 °C for 3 h prior to the measurement. The surface areas were determined by Brunauer–Emmett–Teller (BET) model.Powder X-ray diffraction (XRD) patterns of samples were collected in the 2θ range of 10–80° using a Rigaku D/max-RA Diffractometer equipped with a Cu Kα (λ = 0.15406 nm) radiation resource operated at 40 kV and 100 mA, respectively.
Visible Raman spectra of all catalysts were collected on a Lab-RAM HR laser Raman spectrograph with a spectral resolution of 2 cm−1 at room temperature. A Nd:Yag laser of 532 nm was used as the excitation source with a power output of 30 mW. All specimens were illuminated through a 50× objective and in powder form to prevent diffusion problems. Raman spectra were collected and recorded over the spectral range of 100–1000 cm−1. The specification of the grating was 600 g mm−1.
The UV-vis spectra (UV-vis) were performed in diffuse reflectance mode using PerkinElmer Lambda 750S spectrometer (USA) equipped with an internal integration sphere. The test samples were the mixture of the catalyst powder and BaSO4 with the weight ratio of 1![[thin space (1/6-em)]](https://www.rsc.org/images/entities/char_2009.gif) :
:![[thin space (1/6-em)]](https://www.rsc.org/images/entities/char_2009.gif) 6. The spectra were collected in the spectra range of 200–800 nm at room temperature.
6. The spectra were collected in the spectra range of 200–800 nm at room temperature.
The X-ray photoelectron spectra (XPS) data were recorded on Thermo Escalab 250Xi electron spectrophotometer with 15 kV high pressure and 14.9 mA electric current using Al Kα radiation (1486.6 eV), and operating in a constant pass energy mode (20 eV pass energy). The C 1s peak at 284.6 eV was used for the calibration of binding energy values. And the semi-quantitative surface relative atomic concentrations were obtained from the eqn (3). The pressure in the analytical chamber was about 10−8 Pa.
 | (3) |
Temperature programmed reduction of H2 (H2-TPR) experiments were performed in TP-5076 (Xianquan, Tianjin, China) with a thermal conductivity detector. All catalysts (100 mg) were pretreated in a quartz tubular micro-reactor in a flow of N2 at 450 °C for 1 h to yield a clean surface, and then cooled down to room temperature. The reduction was carried out in a flow of 5 vol% H2–95 vol% N2 to 800 °C with a heating rate of 10 °C min−1.
O2/NH3-TPD experiments were carried out in TP-5076 (Xianquan, Tianjin, China) with a thermal conductivity detector. A typical sample mass of 100 mg and a gas flow rate of 30 mL min−1 were used during the experiments. The experiment included four stages: (1) degasification of the sample in N2 at 400 °C for 1 h to clear the surface, (2) adsorption of 2 vol% NH3/O2–98% N2 at 80 °C for 1 h, (3) isothermal desorption in N2 at 80 °C until no NH3/O2 was detected and (4) temperature programmed desorption in N2 at 10 °C min−1 up to 900 °C. The detector was a thermal conductivity detector.
The in situ diffuse-reflectance infrared Fourier transform spectroscopy (in situ DRIFTS) of adsorbed species arising from NH3 adsorption at various temperature over the catalysts, were collected in the range of 4000–1000 cm−1 using Thermo Nicolet 6700 FTIR spectrometer. Diffuse reflectance measurements were performed in situ in a high temperature cell equipped with a KBr window. The catalyst was heated to 350 °C under N2 at a total flow rate of 100 mL min−1 for 1 h to remove any adsorbed impurities. And then the catalyst was cooled down to 50 °C, exposed to 1000 ppm NH3/N2 (100 mL min−1) for 1 h, and subsequently flushed with N2. Afterwards, the DRIFTS spectra of catalysts were collected between 50 and 300 °C at a 50 °C interval. The background spectrum was collected once every 50 °C in flowing N2 during the cooling process.
3 Results and discussions
3.1 Catalytic performance
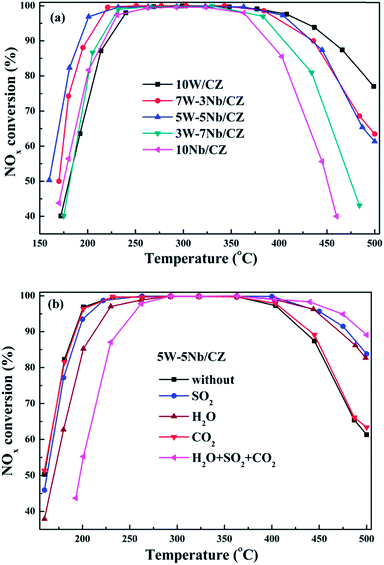
W/CZT20 catalyst presented excellent sulfur tolerance in our previous work.16 In order to compare the sulfur tolerance of 5W–5Nb/CZ and W/CZT20, 100 ppm SO2 was injected into the reaction gas and the NH3-SCR activities of the two catalysts in the temperature range of 160–500 °C were shown in Fig. S2.† It was clear that 5W–5Nb/CZ still presented high NOx conversion in the presence of SO2 from Fig. 1b. The low-temperature (below 220 °C) NOx conversion of 5W–5Nb/CZ was slightly affected by the introduction of SO2, its T50 and T90 were shifted to 162 °C from 160 °C and 190 °C to 195 °C, respectively. Furthermore, the deNOx activity of the catalyst was evidently improved by the presence of SO2 at above 400 °C, its T90 at high temperature range was transferred to 480 °C from 434 °C. Similar as W/CZT20, the influence of SO2 on the NOx conversion over 5W–5Nb/CZ was negligible in the low-temperature range. However, the NH3-SCR activities of 5W–5Nb/CZ in the absence or presence of SO2 were both higher than the corresponding catalytic activity of W/CZT20. Moreover, water steam, SO2 and CO2 often coexist in the exhausted gas emitted from the diesel engine. The co-effect of H2O, SO2 and CO2 on the NH3-SCR activity over 5W–5Nb/CZ was investigated in this work, and the results were displayed in Fig. 1b. The influence of CO2 on the NOx conversion of the catalyst could be neglected from Fig. 1b. But the effect of H2O on low-temperature activity was more negative than single SO2 or CO2, the T50 and T90 were transferred from 160 °C to 170 °C and 190° to 212 °C, respectively. The above phenomenon could be ascribed to H2O with stronger adsorption ability than SO2 and CO2 at the low-temperatures.2 As seen from Fig. 1b, the co-presence of H2O, SO2 and CO2 further depressed the low-temperature NOx conversion compared with the separate component. Nevertheless, the catalyst still could achieve higher 90% NOx conversion in the temperature range of 235–495 °C. Thus, 5W–5Nb/CZ showed excellent tolerances of water steam, sulfur and carbon dioxides, which could make it to be a promising catalyst of NOx abatement for practical application.
3.2 Textural and structural properties
| Samples | Surface area (m2 g−1) | Pore volume (cm3 g−1) | Pore radius (nm) | 2θ (°) | Lattice parameter (nm) | Crystal size (nm) |
|---|---|---|---|---|---|---|
| 10W/CZ | 98.9 | 0.242 | 4.90 | 28.880 | 0.5347 | 6.0 |
| 7W–3Nb/CZ | 97.1 | 0.236 | 4.86 | 28.980 | 0.5333 | 5.8 |
| 5W–5Nb/CZ | 102.5 | 0.241 | 4.70 | 28.940 | 0.5335 | 5.8 |
| 3W–7Nb/CZ | 97.0 | 0.221 | 4.56 | 28.840 | 0.5337 | 5.8 |
| 10Nb/CZ | 104.8 | 0.242 | 4.61 | 28.780 | 0.5336 | 5.7 |
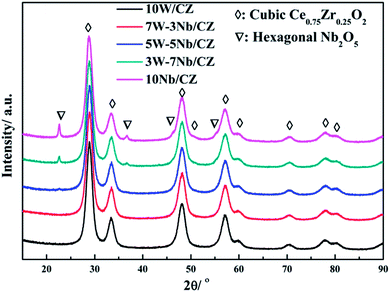
Powder XRD was employed to investigate the effect of the substitution of WO3 by Nb2O5 on the crystal structure of 10W/CZ, and the XRD patterns were presented in Fig. 4. The typical diffraction peaks located at around 28.9° observed over all catalysts were ascribed to the cubic Ce0.75Zr0.25O2 phase (JCPDS 28-0271). And the intensities of the Ce0.75Zr0.25O2 diffraction peaks could not be depressed by Nb2O5 substitution. When the substitution amount was 3 wt%, the lattice parameter was evidently decreased and the 2θ of the main diffraction peak was shifted to higher value compared to those of 10W/CZ in Table 1. Moreover, no typical diffraction peaks ascribed to Nb2O5 crystallites were observed over 7W–3Nb/CZ in Fig. 3. It indicated that the incorporation of Nb into the lattice of Ce0.75Zr0.25O2 could lead to a shrinkage of the crystal cells due to that the radius of Nb5+ (0.070 nm) was smaller than those of Ce4+ (0.092 nm) and Zr4+ (0.080 nm).16 Further enhanced the substitution amount of Nb2O5, a very weak diffraction peak ascribed to the hexagonal Nb2O5 (JCPDS 28-0317) phase located at around 22.4° was found over 5W–5Nb/CZ. Further increasing the amount of Nb2O5, the intensities of the hexagonal Nb2O5 phases were gradually enhanced, the values of 2θ were slightly transferred to lower ranges, but there was no obvious difference among the lattice parameters of the Nb-containing catalysts. The above facts suggested that more Nb2O5 could not incorporate into the lattice of Ce0.75Zr0.25O2 and disperse on the surface of the CZ carrier when the substitution amount of Nb2O5 was higher than 5 wt%, because other diffraction peaks ascribed to the hexagonal Nb2O5 at around 36.7, 46.2, 50.7 and 55.2° could be observed over 3W–7Nb/CZ and 10Nb/CZ rather than 5W–5Nb/CZ.
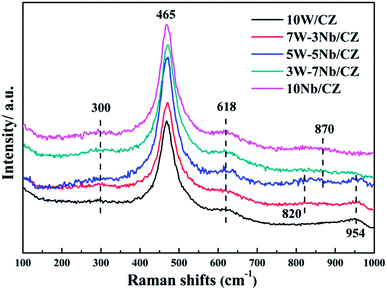
![[double bond, length as m-dash]](https://www.rsc.org/images/entities/char_e001.gif) O bonds was also emerged on 5W–5Nb/CZ.19 Additionally, its intensity was further increased when the loading of Nb2O5 was enhanced to 10 wt%, indicating a decline in the ratio of monomeric NbOx species and an the enhancement in degree of polymerization of surface NbOx species at high Nb2O5 loading.29 The above phenomena were consistent with the XRD results, a very weak peak assigned to Nb2O5 species was detected over 5W–5Nb/CZ and the peak intensity was increased with enhancing the loading of niobium to 10 wt%. It also illustrated a decrease in the dispersion of Nb2O5 species from the XRD results, when the content of Nb2O5 was higher than 5 wt%. According to the ref. 19, monolayer NbOx structured with [NbO4] would be easier to contact the surface of CZ carrier and improve the amount of Brønsted and strong Lewis acid sites, thus, 5W–5Nb/CZ could possess larger amount of Brønsted and strong Lewis acid sites than other catalysts. Furthermore, a broad weak peak centered at ca. 954 cm−1 could be assigned to the [WO4] or [WO6] units (amorphous WOx species) with symmetrical W
O bonds was also emerged on 5W–5Nb/CZ.19 Additionally, its intensity was further increased when the loading of Nb2O5 was enhanced to 10 wt%, indicating a decline in the ratio of monomeric NbOx species and an the enhancement in degree of polymerization of surface NbOx species at high Nb2O5 loading.29 The above phenomena were consistent with the XRD results, a very weak peak assigned to Nb2O5 species was detected over 5W–5Nb/CZ and the peak intensity was increased with enhancing the loading of niobium to 10 wt%. It also illustrated a decrease in the dispersion of Nb2O5 species from the XRD results, when the content of Nb2O5 was higher than 5 wt%. According to the ref. 19, monolayer NbOx structured with [NbO4] would be easier to contact the surface of CZ carrier and improve the amount of Brønsted and strong Lewis acid sites, thus, 5W–5Nb/CZ could possess larger amount of Brønsted and strong Lewis acid sites than other catalysts. Furthermore, a broad weak peak centered at ca. 954 cm−1 could be assigned to the [WO4] or [WO6] units (amorphous WOx species) with symmetrical W![[double bond, length as m-dash]](https://www.rsc.org/images/entities/char_e001.gif) O stretching mode,30,31 which could be detected over all W-containing catalysts, except for 3W–7Nb/CZ and 10Nb/CZ. There were no obvious differences among their intensities of the bands for the three catalysts, implying that the dispersion of tungsten oxides species could not be changed by the substitution of Nb2O5.
O stretching mode,30,31 which could be detected over all W-containing catalysts, except for 3W–7Nb/CZ and 10Nb/CZ. There were no obvious differences among their intensities of the bands for the three catalysts, implying that the dispersion of tungsten oxides species could not be changed by the substitution of Nb2O5.
| Sample | 10W/CZ | 7W–3Nb/CZ | 5W–5Nb/CZ | 3W–7Nb/CZ | 10Nb/CZ |
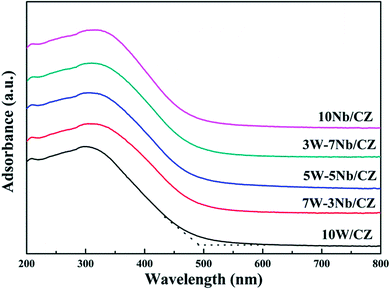
| Adsorption edge (nm) | 487.3 | 499.1 | 503.7 | 491.1 | 489.5 |
| Band gap width (eV) | 2.54 | 2.48 | 2.46 | 2.52 | 2.53 |
| Samples | Surface atomic concentration | ||||||
|---|---|---|---|---|---|---|---|
| W | Nb | Ce | Ce3+/Ce | Zr | O | Oads/O | |
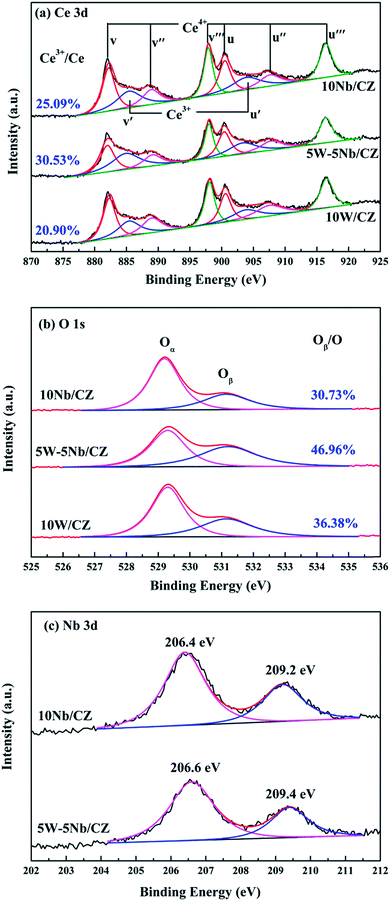
| 10W/CZ | 2.09 | — | 19.0 | 20.9 | 5.60 | 73.31 | 36.38 |
| 5W–5Nb/CZ | 1.51 | 2.96 | 18.98 | 30.53 | 5.75 | 70.80 | 46.96 |
| 10Nb/CZ | — | 3.78 | 22.66 | 25.09 | 5.82 | 67.74 | 30.73 |
As presented in Fig. 7b, two bands attributed to different oxygen species were obtained after fitting the spectra of O 1s. The first band at ca. 529.2 eV could be ascribed to the lattice oxygen, labeled as Oα, and the additional band at ca. 531.2 eV was assigned to the chemisorbed oxygen, denoted as Oβ.16,34 The relative ratios of Oβ in O on the surface of the catalysts were quantified by the following formula: Oβ = area (Oβ)/[area (Oα) + area (Oβ)] and shown in Fig. 7b. The value of 5W–5Nb/CZ was much higher than those of 10W/CZ and 10Nb/CZ, which was consistent with the above Ce3+/Ce ratio. In other words, the partial substitution of WO3 by Nb2O5 could form more chemisorbed oxygen accompanied with more Ce3+ on the surface of 5W–5Nb/CZ, as indicated by the Raman results. It could be contributed to that more Ce3+ resulted in more charge imbalance and unsaturated chemical bonds, which was beneficial for generating more oxygen vacancies and active oxygen.15 Li et al.21 and Weng et al.35 suggested that Nb could activate the adjacent oxygen species around cerium sites as the active sites possessed facile redox cycle between Ce4+ and Ce3+, thereby, the reducibility of these cerium sites was modified and finally the reactivity of NH3-SCR reaction was promoted over 5W–5Nb/CZ rather than 10W/CZ.
3.3 Redox properties
| Samples | Peak 1 | Peak 2 | Peak 3 | Peak 4 | ||||
|---|---|---|---|---|---|---|---|---|
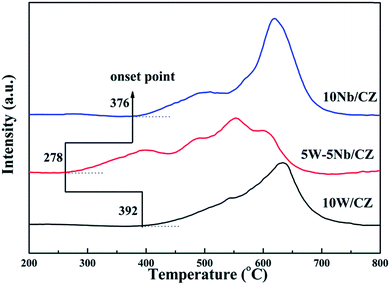
| Tm (°C) | H2 consumption (μmol g−1) | Tm (°C) | H2 consumption (μmol g−1) | Tm (°C) | H2 consumption (μmol g−1) | Tm (°C) | H2 consumption (μmol g−1) | |
| 10W/CZ | 545 | 247.6 | — | — | — | — | 622 | 493.3 |
| 5W–5Nb/CZ | 395 | 186.9 | 490 | 122.4 | 549 | 180.2 | 602 | 167.3 |
| 10Nb/CZ | 490 | 220.7 | — | — | 535 | 82.3 | 592 | 587.6 |
3.4 Surface acidity
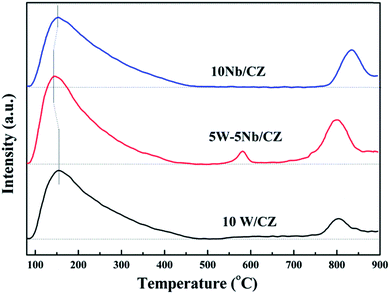
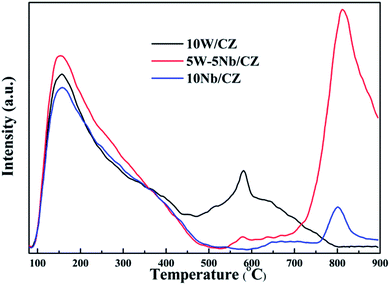
![[double bond, length as m-dash]](https://www.rsc.org/images/entities/char_e001.gif) O of amorphous WO3.31 Moreover, the desorption peaks of NH3 at about 800 °C were both observed over 5W–5Nb/CZ and 10Nb/CZ, and the peak intensity of the former was evidently higher than that of the later, no NH3 was desorbed over 10W/CZ at above 800 °C. So the desorption peak might be assigned to strong acid derived from Nb2O5. The above phenomena indicated that 5W–5Nb/CZ inherited the acidities of 10W/CZ and 10Nb/CZ due to the possible electronic interactions between W and Nb. As seen from Fig. 10, it was obvious that the total peak area of catalysts followed the decreased sequence of 5W–5Nb/CZ > 10W/CZ > 10Nb/CZ, which suggested that the total surface acidity was evidently improved by partial substitution of WO3 with Nb2O5 in 10W/CZ.
O of amorphous WO3.31 Moreover, the desorption peaks of NH3 at about 800 °C were both observed over 5W–5Nb/CZ and 10Nb/CZ, and the peak intensity of the former was evidently higher than that of the later, no NH3 was desorbed over 10W/CZ at above 800 °C. So the desorption peak might be assigned to strong acid derived from Nb2O5. The above phenomena indicated that 5W–5Nb/CZ inherited the acidities of 10W/CZ and 10Nb/CZ due to the possible electronic interactions between W and Nb. As seen from Fig. 10, it was obvious that the total peak area of catalysts followed the decreased sequence of 5W–5Nb/CZ > 10W/CZ > 10Nb/CZ, which suggested that the total surface acidity was evidently improved by partial substitution of WO3 with Nb2O5 in 10W/CZ.
![[double bond, length as m-dash]](https://www.rsc.org/images/entities/char_e001.gif) O in the overtone region due to the overlap of the above stretching mode in the fundamental region (at about 980 cm−1).29 According to the ref. 21 the negative Nb
O in the overtone region due to the overlap of the above stretching mode in the fundamental region (at about 980 cm−1).29 According to the ref. 21 the negative Nb![[double bond, length as m-dash]](https://www.rsc.org/images/entities/char_e001.gif) O at the overtone region implied that the bonds of Nb
O at the overtone region implied that the bonds of Nb![[double bond, length as m-dash]](https://www.rsc.org/images/entities/char_e001.gif) O were consumed during the process of NH3 adsorption. In other words, the bond of Nb
O were consumed during the process of NH3 adsorption. In other words, the bond of Nb![[double bond, length as m-dash]](https://www.rsc.org/images/entities/char_e001.gif) O could be a kind of acid sites for NH3 adsorption.
O could be a kind of acid sites for NH3 adsorption.
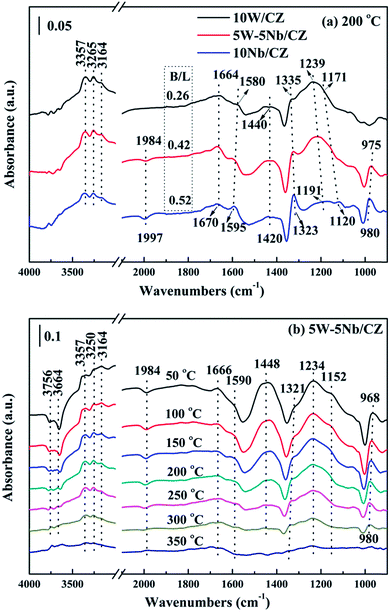 | ||
| Fig. 11 In situ DRIFT spectra of 500 ppm NH3 adsorption with 300 mL min−1 flow rate over the 10W/CZ, 5W–5Nb/CZ and 10Nb/CZ catalysts at 200 °C (a) and over 5W–5Nb/CZ at different temperatures (b). | ||
The bonds of Nb![[double bond, length as m-dash]](https://www.rsc.org/images/entities/char_e001.gif) O could act as either Lewis acid sites or Brønsted acid sites in the literatures.18,43 5W–5Nb/CZ was selected as a sample to illustrate the role of Nb
O could act as either Lewis acid sites or Brønsted acid sites in the literatures.18,43 5W–5Nb/CZ was selected as a sample to illustrate the role of Nb![[double bond, length as m-dash]](https://www.rsc.org/images/entities/char_e001.gif) O bonds during the process of NH3 adsorption and investigate the behaviours of NH3 adsorption in the temperature ranges of 50–350 °C, the results were presented in Fig. 11b. As mentioned above, the bands at 1234 and 1448 cm−1 could be considered as characteristic bands of Lewis and Brønsted acid sites, respectively, the negative bands at around 1984 cm−1 was ascribed to Nb
O bonds during the process of NH3 adsorption and investigate the behaviours of NH3 adsorption in the temperature ranges of 50–350 °C, the results were presented in Fig. 11b. As mentioned above, the bands at 1234 and 1448 cm−1 could be considered as characteristic bands of Lewis and Brønsted acid sites, respectively, the negative bands at around 1984 cm−1 was ascribed to Nb![[double bond, length as m-dash]](https://www.rsc.org/images/entities/char_e001.gif) O overtones. It could be seen that the stability of Brønsted acid sites was lower than that of Lewis acid sites, because the intensity of bands at 1448 cm−1 depressed quickly with the enhancement of temperatures and completely disappeared at 300 °C from Fig. 11b. Meanwhile, the intensities of the bands at around 1234 cm−1 and the negative ones at 1984 cm−1 declined and vanished simultaneously, they basically disappeared at 350 °C, suggesting that the bonds of Nb
O overtones. It could be seen that the stability of Brønsted acid sites was lower than that of Lewis acid sites, because the intensity of bands at 1448 cm−1 depressed quickly with the enhancement of temperatures and completely disappeared at 300 °C from Fig. 11b. Meanwhile, the intensities of the bands at around 1234 cm−1 and the negative ones at 1984 cm−1 declined and vanished simultaneously, they basically disappeared at 350 °C, suggesting that the bonds of Nb![[double bond, length as m-dash]](https://www.rsc.org/images/entities/char_e001.gif) O could play the role as Lewis acid sites in this work. Furthermore, the negative bands at 3664 and 3756 cm−1 attributed to the surface OH− groups, which were vanished simultaneously as the bands at 1448 cm−1 at 300 °C, were responsible for Brønsted acid sites.21 Therefore, combined the above analysis, the desorption peak of NH3 at about 150 °C should be attributed to weak Lewis and Brønsted acid sites, and the increased weak acid over 5W–5Nb/CZ could be Brønsted acid sites from Nb–OH in Fig. 10. While the desorption peak at about 800 °C could be assigned to strong Lewis acid sites derived from Nb2O5 promoted by the possible electronic interaction between Wn+ and Nbn+.40
O could play the role as Lewis acid sites in this work. Furthermore, the negative bands at 3664 and 3756 cm−1 attributed to the surface OH− groups, which were vanished simultaneously as the bands at 1448 cm−1 at 300 °C, were responsible for Brønsted acid sites.21 Therefore, combined the above analysis, the desorption peak of NH3 at about 150 °C should be attributed to weak Lewis and Brønsted acid sites, and the increased weak acid over 5W–5Nb/CZ could be Brønsted acid sites from Nb–OH in Fig. 10. While the desorption peak at about 800 °C could be assigned to strong Lewis acid sites derived from Nb2O5 promoted by the possible electronic interaction between Wn+ and Nbn+.40
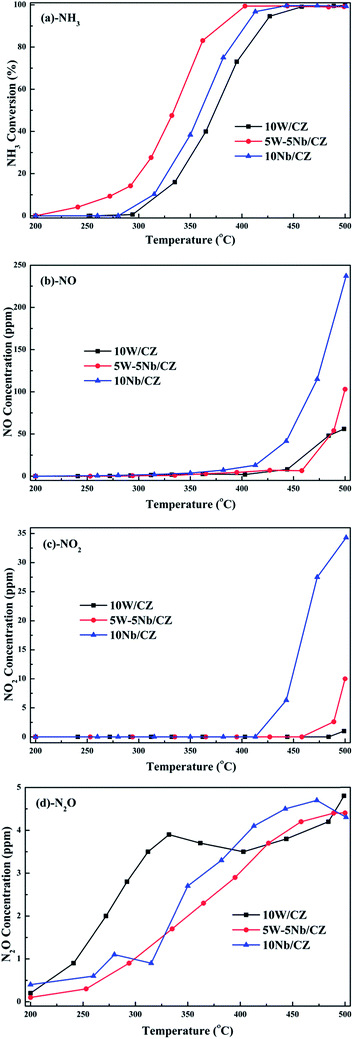
Based on the above analyses about the role of the acid sites, it could be declared that Lewis and Brønsted acid sites were together participated in the NH3-SCR reaction.44,45 The thermal stability of Brønsted acid sites was less than that of Lewis acid sites due to the vanish of the former at 300 °C from Fig. 11b, implying that Brønsted acid sites could mainly take part in the reaction in the relatively low temperature ranges.31 However, the bands at 1234 cm−1 assigned to Lewis acid sites still could be observed at 350 °C, which meant that the Lewis acid sites might contribute to the NH3-SCR reaction at the whole operation temperature range over 5W–5Nb/CZ. Consequently, WO3 partial substitution by Nb2O5 in 10W/CZ resulted in an evident improvement of the total acidity of the catalyst, both Lewis and Brønsted acid sites could be supplied by Nb2O5, even though the total acidity of 10Nb/CZ was the smallest in the three catalysts. Therefore, compared with 10W/CZ, the increment of Brønsted acid sites by the substitution of Nb2O5 could be one of reasons that significantly improving deNOx activity below 250 °C over 5W–5Nb/CZ, in contrast, the enhancement of Lewis acid sites could not inhibit a slight decline of NOx conversion due to the formation of NOx from non-selective oxidation of NH3 (in Fig. 3b and c) over 5W–5Nb/CZ in the high-temperature ranges.
4 Discussion
Analysis of the structure of catalysts from XRD and Raman, no obvious evidence of Nb2O5 over the catalysts with less than 5 wt% Nb2O5 indicated that niobium was as dispersed species over the surface of catalysts, while clear diffraction peak attributed to hexagonal Nb2O5 was detected over the catalysts with above 5 wt% Nb2O5. In addition, no diffraction peak ascribed to WO3 phase over all catalysts was supported by XRD and Raman, indicating that WO3 species were also dispersed over the surface of catalysts. The structural information from Raman, niobium oxides species with tetrahedral [NbO4] structure were only observed over the catalysts with low loading of Nb2O5 (≤5 wt%), since the [NbO4] structure with four oxygen atoms surrounding Nb represented monomeric dispersion. The polymeric niobium oxide species with octahedral [NbOx] structure was gradually formed and became to be the dominant structure by linking the isolated [NbO4] units with the bridging oxygen, with increasing the content of Nb2O5. It meant that the polymeric or bulk NbOx could be formed when the loading of Nb2O5 outstripped the monolayer coverage amount, which was supported by the results of XRD and Raman and was also in accordance with the literatures.19,29 Also, the symmetrical W![[double bond, length as m-dash]](https://www.rsc.org/images/entities/char_e001.gif) O stretching mode assigned to the amorphous WO3 species was detected by Raman of all W-containing catalysts except 3W–7Nb/CZ, suggesting the formation of a monolayer of WO3 over the above catalysts.30,31 According to the results of NH3-TPD and in situ DRIFTS of NH3, the decrease of medium Lewis acid sites for 5W–5Nb/CZ was closely related with the W
O stretching mode assigned to the amorphous WO3 species was detected by Raman of all W-containing catalysts except 3W–7Nb/CZ, suggesting the formation of a monolayer of WO3 over the above catalysts.30,31 According to the results of NH3-TPD and in situ DRIFTS of NH3, the decrease of medium Lewis acid sites for 5W–5Nb/CZ was closely related with the W![[double bond, length as m-dash]](https://www.rsc.org/images/entities/char_e001.gif) O bonds in WOx species due to the decreased amount of WO3, compared to 10W/CZ. Moreover, the increased strong Lewis acid sites and Brønsted acid sites were associated with Nb
O bonds in WOx species due to the decreased amount of WO3, compared to 10W/CZ. Moreover, the increased strong Lewis acid sites and Brønsted acid sites were associated with Nb![[double bond, length as m-dash]](https://www.rsc.org/images/entities/char_e001.gif) O and Nb–OH, which has been confirmed the relationships with monolayer NbOx species by the previous studies.19,43 Based on the analysis of in situ DRIFTS of NH3, Brønsted acid sites could be mainly participated in the relative low-temperature NH3-SCR reaction due to its lower thermal stability than Lewis acid sites, accordingly, Lewis acid sites could take part in the whole operation temperature range of SCR reaction over W–Nb/CZ serial catalysts. Consequently, 5W–5Nb/CZ should achieve the best low-temperature and high-temperature deNOx activity than single W or Nb-containing catalysts in Fig. 1a, because the former possessed more Brønsted and Lewis acid sites than other two catalysts; but it should be noted that the high-temperature NOx conversion (above 400 °C) over 5W–5Nb/CZ was obviously lower than that over 10W/CZ, under the condition of the former with far more Lewis acid sites (could inhibit the non-selective oxidation of NH3 in the high-temperature range) than the later. It indicated that the acidity was not the only factor affected the deNOx activity over 5W–5Nb/CZ, in case the acid sites were sufficient. Therefore, the relationship between the redox properties and the NH3-SCR performance should be discussed hereon.
O and Nb–OH, which has been confirmed the relationships with monolayer NbOx species by the previous studies.19,43 Based on the analysis of in situ DRIFTS of NH3, Brønsted acid sites could be mainly participated in the relative low-temperature NH3-SCR reaction due to its lower thermal stability than Lewis acid sites, accordingly, Lewis acid sites could take part in the whole operation temperature range of SCR reaction over W–Nb/CZ serial catalysts. Consequently, 5W–5Nb/CZ should achieve the best low-temperature and high-temperature deNOx activity than single W or Nb-containing catalysts in Fig. 1a, because the former possessed more Brønsted and Lewis acid sites than other two catalysts; but it should be noted that the high-temperature NOx conversion (above 400 °C) over 5W–5Nb/CZ was obviously lower than that over 10W/CZ, under the condition of the former with far more Lewis acid sites (could inhibit the non-selective oxidation of NH3 in the high-temperature range) than the later. It indicated that the acidity was not the only factor affected the deNOx activity over 5W–5Nb/CZ, in case the acid sites were sufficient. Therefore, the relationship between the redox properties and the NH3-SCR performance should be discussed hereon.
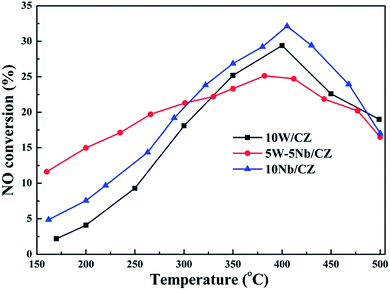
The results of XRD approved that Nbn+ would be incorporated into the lattice of CZ due to smaller radius of Nb5+ than those of Ce4+ and Zr4+. Compared with 10W/CZ, for W–Nb/CZ catalysts, the partial substitution of Ce4+/Zr4+ in CZ lattice by Nb5+ could bring excess electron compensation by the generation of Ce3+. UV-vis result indicated that 5W–5Nb/CZ, with the most excess electron derived from the strongest electronic interaction between Nb5+ and Ce4+ than other catalysts, possessed the most Ce3+ ions, which has been evidenced by the result of XPS. Ce3+ could lead to the charge imbalance and unsaturated chemical bonds, which was important to the formation of oxygen vacancies and less bonded oxygen.24,35 It meant that the contiguous oxygen species around Cen+ sites were activated by niobium. It was well known that cerium sites as active sites due to the facile redox cycle between Ce4+ and Ce3+, could improve the reducibility of these cerium sites and thereby promote the NH3-SCR activity of Ce-based catalysts.13,21,35 The electronic interaction between Cen+ and Nbn+ has been evidenced by the results of H2-TPR and O2-TPD. It has been reported that the low-temperature NH3-SCR activity was governed by the redox properties of catalysts.46,47 The amount of active oxides directly affected the redox property and thereby controlled the low-temperature deNOx activity, since the active oxygen species would be firstly consumed to carry out NH3-SCR reaction. 5W–5Nb/CZ achieved the highest low-temperature NOx conversion among the investigated catalysts, which was similar to its most active oxygen species in XPS, H2-TPR and O2-TPD. It indeed indicated that the amount of active oxygen species significantly affected the low-temperature deNOx activity. Moreover, the activity of NO oxidation over different catalysts followed the sequence of 5W–5Nb/CZ > 10Nb/CZ > 10W/CZ, which illustrated that the low-temperature activity was possibly improved by generating more NO2 due to more active oxygen species.41,48 However, the promoted oxidation ability of NH3 resulted in the peroxidation of NH3 to form more NO and NO2 (in Fig. 3b and c), and further led to the depressed high-temperature NOx conversion of 5W–5Nb/CZ. It showed that the constraint existed between the redox property and surface acidity over 5W–5Nb/CZ, even though it possessed the strongest redox property and largest amount of surface acid sites.
Although Lietti et al.47,49 has proposed that the low-temperature deNOx activity was governed by the redox properties of catalysts, whereas the high-temperature NOx conversion was controlled by the acid sites over the surface of catalysts. And Dong et al.8 suggested that the adequate acid sites initiated the NH3-SCR reaction and the redox ability of catalysts could upgrade the SCR activity. Based on the above analysis, it is reasonable that the balance should occur between the surface acidity and redox property over catalysts and then could achieve the optimal NH3-SCR performance both in low and high temperatures ranges. Therefore, it is necessary to investigate the balance between surface acidity and redox property over Nb-substituted W/CZ catalysts and the related work is under way.
5 Conclusions
A series of Nb substituted W/CZ catalysts, prepared by co-impregnated methods, displayed excellent deNOx activity and N2 selectivity. Among them, 5W–5Nb/CZ with the substitution of 5 wt% WO3 by 5 wt% Nb2O5 achieved above 90% NOx conversion in a broad reaction temperature window of 190–434 °C and nearly 100% N2 selectivity within the whole operation temperature range. The characterization results demonstrated that 5W–5Nb/CZ possessed more Brønsted acid sites from the substituted NbOx and stronger redox property due to more Ce3+, oxygen vacancies and active oxygen species than other catalysts, which could contribute to its best low-temperature (below 250 °C) NOx conversion. The high-temperature (above 400 °C) deNOx activity of 5W–5Nb/CZ was lower than that of 10W/CZ, in case that the former possessed more Lewis acid sites than the latter, which could be resulted from the formation of NOx from the peroxidation of NH3 in the high temperatures over 5W–5Nb/CZ with stronger redox property than 10W/CZ. Therefore, the constraint between the redox property and surface acidity could prevent the optimal NH3-SCR performance over 5W–5Nb/CZ in the whole operation temperature range, and the investigation on the balance between the redox property and surface acidity is under way.Conflicts of interest
There are no conflicts to declare.Acknowledgements
This work was financially supported by the National High-Tech Research and Development (863) Program of China (Grant 2015AA034603) and the Science and Technology Project of Chengdu City (Grant 2015-HM01-00475-SF).References
- S. Roy, M. S. Hegde and G. Madras, Appl. Energy, 2009, 86, 2283–2297 CrossRef CAS.
- T. Boningari and P. G. Smirniotis, Curr. Opin. Chem. Eng., 2016, 13, 133–141 CrossRef.
- K. Skalska, J. S. Miller and S. Ledakowicz, Sci. Total Environ., 2010, 408, 3976–3989 CrossRef CAS PubMed.
- F. Liu, Y. Yu and H. He, Chem. Commun., 2014, 50, 8445–8463 RSC.
- P. G. Smirniotis, D. A. Peña and B. S. Uphade, Angew. Chem., Int. Ed., 2001, 40, 2479–2482 CrossRef CAS PubMed.
- S. S. R. Putluru, L. Schill, A. Godiksen, R. Poreddy, S. Mossin, A. D. Jensen and R. Fehrmann, Appl. Catal., B, 2016, 183, 282–290 CrossRef CAS.
- M. Haneda, T. Morita, Y. Nagao, Y. Kintaichi and H. Hamada, Phys. Chem. Chem. Phys., 2001, 3, 4696–4700 RSC.
- C. Tang, H. Zhang and L. Dong, Catal. Sci. Technol., 2016, 6, 1248–1264 CAS.
- Y. Li, H. Cheng, D. Li, Y. Qin, Y. Xie and S. Wang, Chem. Commun., 2008, 12, 1470–1472 RSC.
- P. Ning, Z. Song, H. Li, Q. Zhang, X. Liu, J. Zhang, X. Tang and Z. Huang, Appl. Surf. Sci., 2015, 332, 130–137 CrossRef CAS.
- F. Can, S. Berland, S. Royer, X. Courtois and D. Duprez, ACS Catal., 2013, 3, 1120–1132 CrossRef CAS.
- A. Väliheikki, T. Kolli, M. Huuhtanen, T. Maunula and R. L. Keiski, Top. Catal., 2015, 58, 1002–1011 CrossRef.
- H. Xu, Y. Cao, Y. Wang, Z. Fang, T. Lin, M. Gong and Y. Chen, Chin. Sci. Bull., 2014, 59, 3956–3965 CrossRef CAS.
- H. Xu, Y. Li, B. Xu, Y. Cao, X. Feng, M. Sun, M. Gong and Y. Chen, J. Ind. Eng. Chem., 2016, 36, 334–345 CrossRef CAS.
- H. Xu, M. Sun, S. Liu, Y. Li, J. Wang and Y. Chen, RSC Adv., 2017, 7, 24177–24187 RSC.
- H. Xu, X. Feng, S. Liu, Y. Wang, M. Sun, J. Wang and Y. Chen, Appl. Surf. Sci., 2017, 419, 697–707 CrossRef CAS.
- S. Shwan, R. Nedyalkova, J. Jansson, J. Korsgren, L. Olsson and M. Skoglundh, Ind. Eng. Chem. Res., 2012, 51, 12762–12772 CrossRef CAS.
- I. Nowak and M. Ziolek, Chem. Rev., 1999, 99, 3603–3624 CrossRef CAS PubMed.
- Z. Ma, X. Wu, Z. Si, D. Weng, J. Ma and T. Xu, Appl. Catal., B, 2015, 179, 380–394 CrossRef CAS.
- M. Casapu, O. Kröcher, M. Mehring, M. Nachtegaal, C. Borca, M. Harfouche and D. Grolimund, J. Phys. Chem. C, 2010, 114, 9791–9801 CAS.
- R. Qu, X. Gao, K. Cen and J. Li, Appl. Catal., B, 2013, 142, 290–297 CrossRef.
- S. Ding, F. Liu, X. Shi and H. He, Appl. Catal., B, 2016, 180, 766–774 CrossRef CAS.
- M. Casapu, A. Berhard, D. Peitz, M. Mehring, M. Elsener and O. Kröcher, Appl. Catal., B, 2011, 103, 79–84 CrossRef CAS.
- H. Xu, Y. Wang, Y. Cao, Z. Fang, T. Lin, M. Gong and Y. Chen, Chem. Eng. J., 2014, 240, 62–73 CrossRef CAS.
- Y. Cui, R. Fang, H. Shang, Z. Shi, M. Gong and Y. Chen, J. Alloys Compd., 2015, 628, 213–221 CrossRef CAS.
- I. Kosacki, T. Suzuki, H. U. Anderson and P. Colomban, Solid State Ionics, 2002, 149, 99–105 CAS.
- B. M. Reddy and A. Khan, Langmuir, 2003, 19, 3025–3030 CrossRef CAS.
- M. A. Bañares and I. E. Wachs, J. Raman Spectrosc., 2002, 33, 359–380 CrossRef.
- L. J. Burcham, J. Datka and I. E. Wachs, J. Phys. Chem. B, 1999, 103, 6015–6024 CrossRef CAS.
- X. Li, M. Shen, X. Hong, H. Zhu, F. Gao, Y. Kong, L. Dong and Y. Chen, J. Phys. Chem. B, 2005, 109, 3949–3955 CrossRef CAS PubMed.
- Y. Peng, K. Li and J. Li, Appl. Catal., B, 2013, 140–141, 483–492 CrossRef CAS.
- S. Tsunekawa, T. Fukuda and A. Kasuya, J. Appl. Phys., 2000, 87, 1318–1321 CrossRef CAS.
- J. Zhu, F. Gao, L. Dong, W. Yu, L. Qi, Z. Wang, L. Dong and Y. Chen, Appl. Catal., B, 2010, 95, 144–152 CrossRef CAS.
- D. R. Sellick, A. Aranda, T. García, J. M. López, B. Solsona, A. M. Mastral, D. J. Morgan, A. F. Carley and S. H. Taylor, Appl. Catal., B, 2013, 132–133, 98–106 CrossRef CAS.
- J. Yu, Z. Si, L. Chen, X. Wu and D. Weng, Appl. Catal., B, 2015, 163, 223–232 CrossRef CAS.
- Z. Ma, D. Weng, X. Wu, Z. Si and B. Wang, Catal. Commun., 2012, 27, 97–100 CrossRef CAS.
- P. W. Seo, S. P. Cho, S. H. Hong and S. C. Hong, Appl. Catal., A, 2010, 380, 21–27 CrossRef CAS.
- L. Zhu, J. Yu and X. Wang, J. Hazard. Mater., 2007, 140, 205–210 CrossRef CAS PubMed.
- Y. Peng, C. Liu, X. Zhang and J. Li, Appl. Catal., B, 2013, 140–141, 276–282 CrossRef CAS.
- L. Zhang, L. Li, Y. Cao, Y. Xiong, S. Wu, J. Sun, C. Tang, F. Gao and L. Dong, Catal. Sci. Technol., 2015, 5, 2188–2196 CAS.
- W. Shan, F. Liu, H. He, X. Shi and C. Zhang, Appl. Catal., B, 2012, 115–116, 100–106 CrossRef CAS.
- F. Liu, K. Asakura, H. He, Y. Liu, W. Shan, X. Shi and C. Zhang, Catal. Today, 2011, 164, 520–527 CrossRef CAS.
- T. Onfroy, G. Clet and M. Houalla, J. Phys. Chem. B, 2005, 109, 14588–14594 CrossRef CAS PubMed.
- L. Chen, J. Li and M. Ge, Environ. Sci. Technol., 2010, 44, 9590–9596 CrossRef CAS PubMed.
- A. Vittadini, M. Casarin and A. Selloni, J. Phys. Chem. B, 2005, 109, 1652–1655 CrossRef CAS PubMed.
- L. Lietti and P. Forzatti, J. Catal., 1994, 147, 241–249 CrossRef CAS.
- L. Lietti, J. L. Alemany, P. Forzatti, G. Busca, G. Ramis, E. GIamello and F. Bregani, Catal. Today, 1996, 29, 143–148 CrossRef CAS.
- Y. Wei, J. Liu, Z. Zhao, A. Duan and G. Jiang, J. Catal., 2012, 287, 13–29 CrossRef CAS.
- L. Lietti, P. Forzatti and F. Berti, Catal. Lett., 1996, 41, 35–39 CrossRef CAS.
Footnote |
| † Electronic supplementary information (ESI) available: The N2 selectivity of 10W/CZ, Nb-substituted W/CZ and 10Nb/CZ, sulfur tolerance of 5W–5Nb/CZ, H2-TPR profiles after deconvolution of 10W/CZ 5W–5Nb/CZ and 10Nb/CZ. See DOI: 10.1039/c7ra08429c |
| This journal is © The Royal Society of Chemistry 2017 |

